| Param | Original file | Final file |
|---|---|---|
| Filename | modeM0/AS1A13_054T01_9000006098_45500cztM0_level2.fits | modeM0/AS1A13_054T01_9000006098_45500cztM0_level2_quad_clean.evt |
| Size (bytes) | 493,727,040 | 112,631,040 |
| Size | 470.9 MB | 107.4 MB |
| Events in quadrant A | 5,977,921 | 751,154 |
| Events in quadrant B | 4,086,028 | 763,021 |
| Events in quadrant C | 3,214,026 | 744,147 |
| Events in quadrant D | 4,462,130 | 671,086 |
| Mode M0 | |||
|---|---|---|---|
| Quadrant | BADHDUFLAG | Total packets | Discarded packets |
| A | 0 | 22326 | 2 |
| B | 0 | 16757 | 2 |
| C | 0 | 14403 | 2 |
| D | 0 | 17861 | 2 |
| Mode SS | |||
|---|---|---|---|
| Quadrant | BADHDUFLAG | Total packets | Discarded packets |
| A | 0 | 140 | 0 |
| B | 0 | 140 | 0 |
| C | 0 | 140 | 0 |
| D | 0 | 140 | 0 |
| Mode M9 | |||
|---|---|---|---|
| Quadrant | BADHDUFLAG | Total packets | Discarded packets |
| A | 0 | 13 | 0 |
| B | 0 | 14 | 0 |
| C | 0 | 14 | 0 |
| D | 0 | 14 | 0 |
| Quadrant | Total seconds | Saturated seconds | Saturation percentage |
|---|---|---|---|
| A | 6906 | 217 | 3.142195% |
| B | 6906 | 395 | 5.719664% |
| C | 6906 | 100 | 1.448016% |
| D | 6906 | 234 | 3.388358% |
Noise dominated data is calculated using 1-second bins in cleaned event files. If a bin has >2000 counts, and if more than 50% of those come from <1% of pixels, then it is considered to be noise-dominated and hence unusable.
| Quadrant | # 1 sec bins | Bins with >0 counts | Bins with >2000 counts | High rate bins dominated by noise | Noise dominated (total time) | Noise dominated (detector-on time) | Marked lightcurve |
|---|---|---|---|---|---|---|---|
| A | 7876 | 6907 | 5 | 5 | 0.06% | 0.07% | 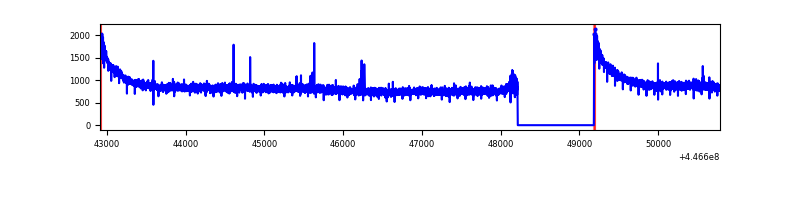 |
| B | 7876 | 6907 | 216 | 216 | 2.74% | 3.13% | 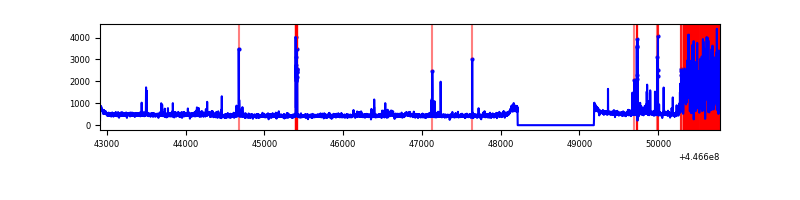 |
| C | 7876 | 6907 | 25 | 25 | 0.32% | 0.36% | 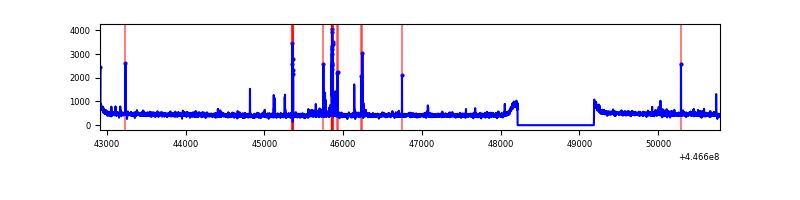 |
| D | 7876 | 6907 | 105 | 105 | 1.33% | 1.52% | 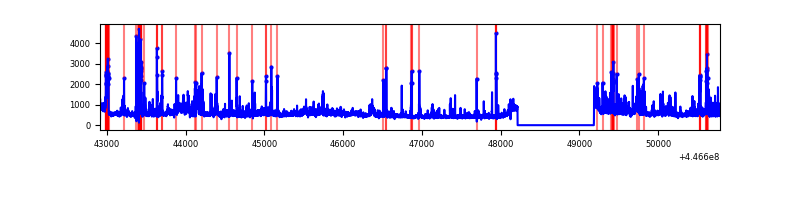 |
Top three noisy pixels from each quadrant. If the there are fewer than three noisy pixels in the level2.evt file, extra rows are filled as -1
| Pixel properties | Quadrant properties | ||||||
|---|---|---|---|---|---|---|---|
| Quadrant | DetID | PixID | Counts | Sigma | Mean | Median | Sigma |
| A | 10 | 83 | 2859234 | 17153.98 | 800 | 782 | 166.6 |
| A | 2 | 79 | 10859 | 60.47 | 800 | 782 | 166.6 |
| A | 3 | 137 | 9238 | 50.75 | 800 | 782 | 166.6 |
| B | 12 | 16 | 724647 | 4634.75 | 786 | 763 | 156.2 |
| B | 5 | 172 | 96367 | 612.12 | 786 | 763 | 156.2 |
| B | 15 | 201 | 72183 | 457.28 | 786 | 763 | 156.2 |
| C | 14 | 254 | 99660 | 534.19 | 785 | 788 | 185.1 |
| C | 1 | 3 | 32336 | 170.45 | 785 | 788 | 185.1 |
| C | 2 | 14 | 17354 | 89.5 | 785 | 788 | 185.1 |
| D | 11 | 241 | 402799 | 2056.5 | 781 | 758 | 195.5 |
| D | 6 | 239 | 248753 | 1268.53 | 781 | 758 | 195.5 |
| D | 13 | 249 | 226169 | 1153.01 | 781 | 758 | 195.5 |
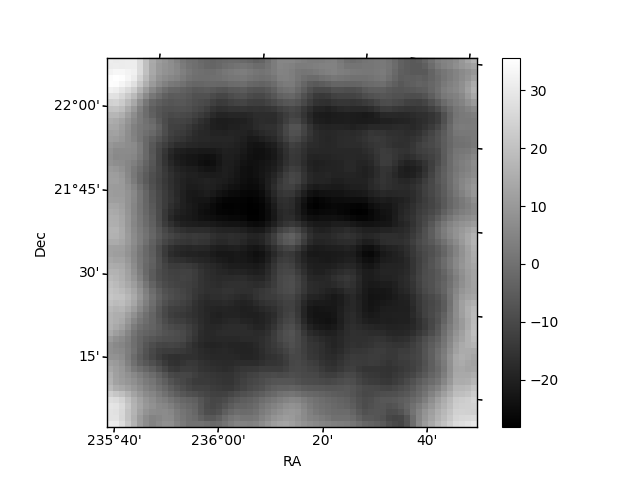
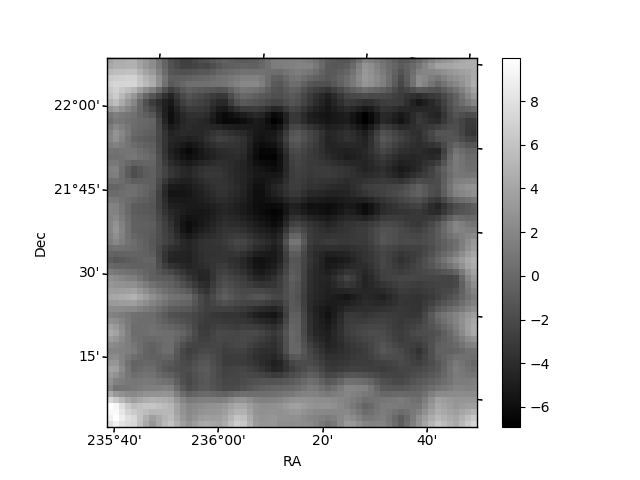
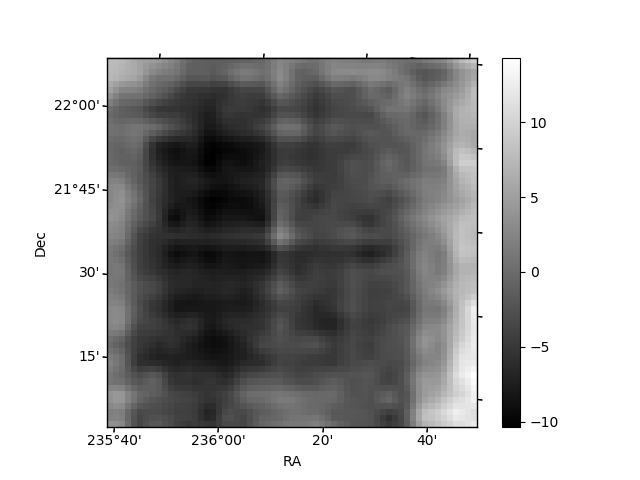
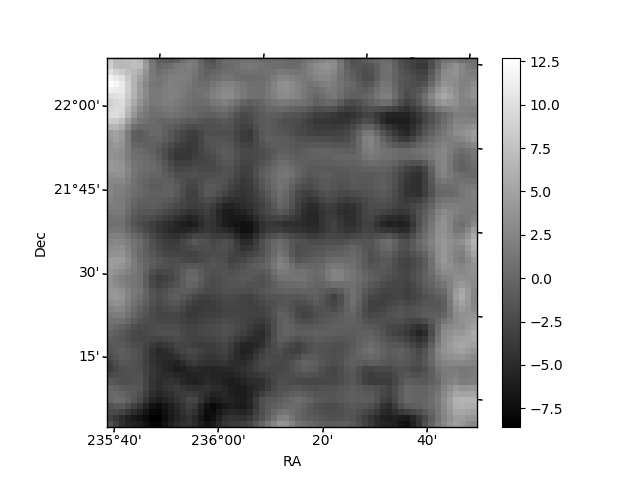
Histogram calculated using DETX and DETY for each event in the final _common_clean file
| Quadrant A | 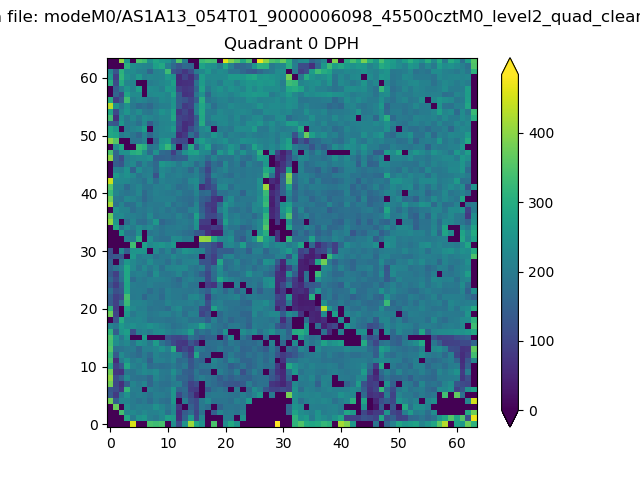 |
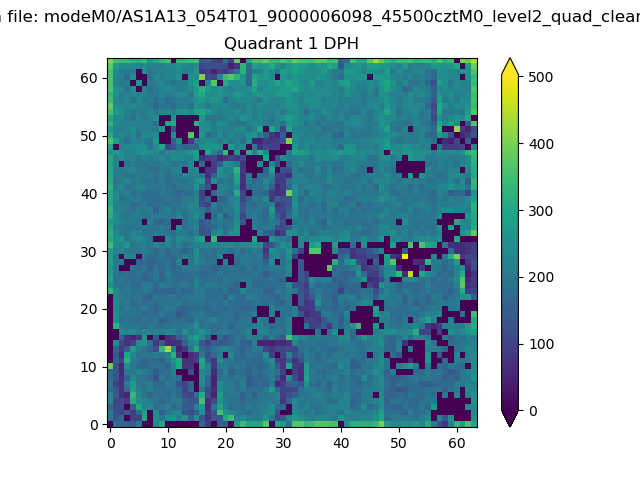 |
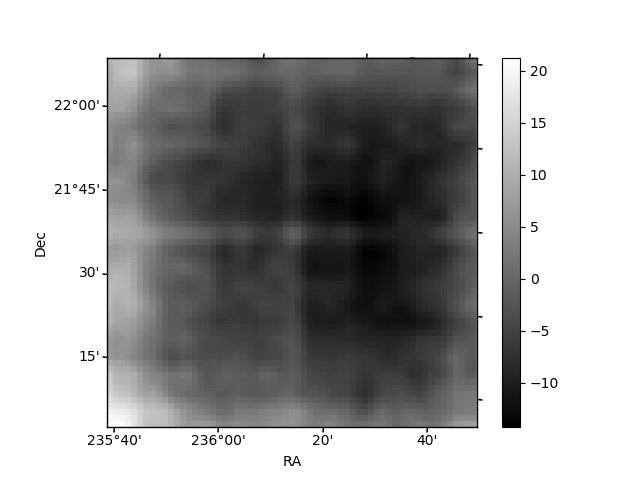
Quadrant B |
|---|---|---|---|
| Quadrant D | 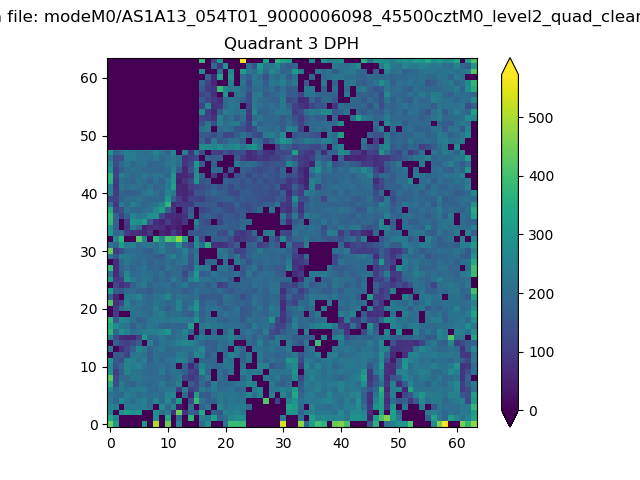 |
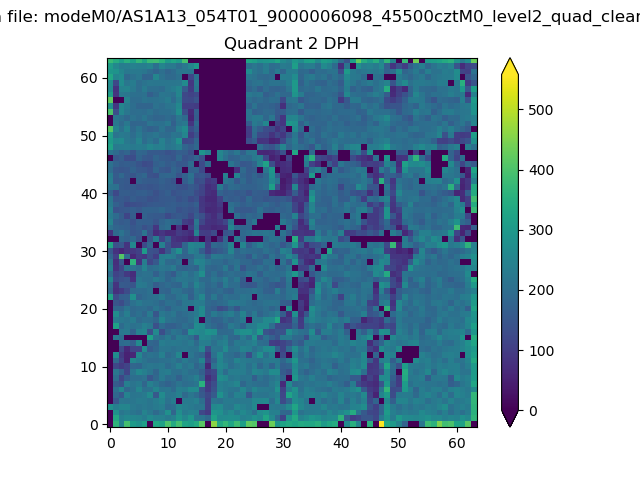 |
Quadrant C |
| Plot type | Count rate plots | Images |
|---|---|---|
| Comparison with Poisson distribution Blue bars denote a histogram of data divided into 1 sec bins. Red curve is a Poisson curve with rate = median count rate of data. |
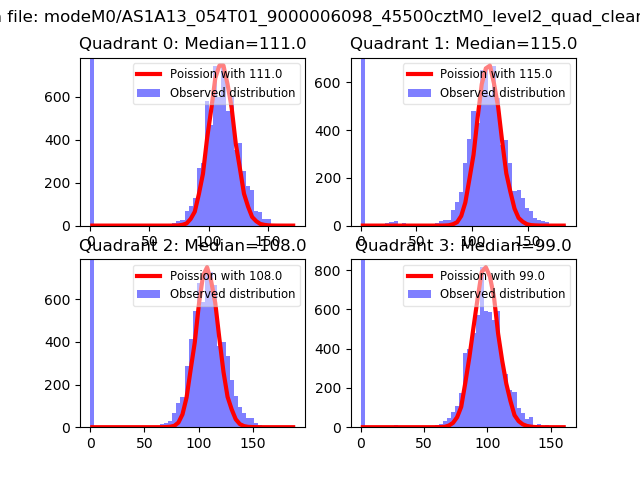 |
 |
| Quadrant-wise count rates Data is divided into 100 sec bins |
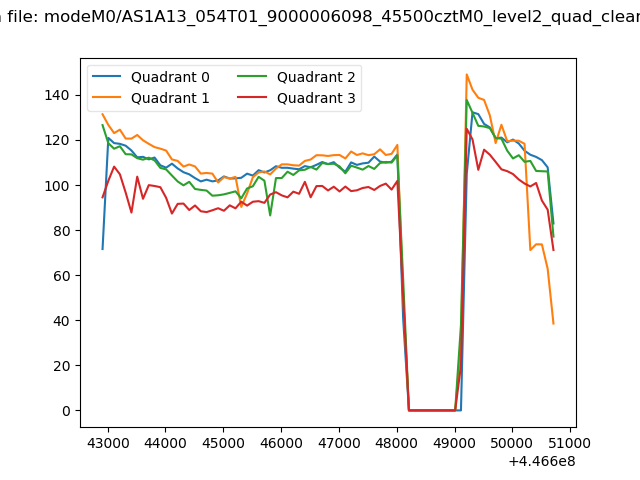 |
|
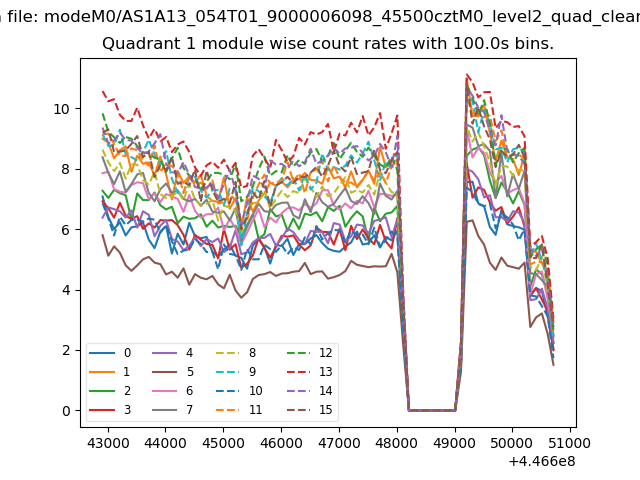
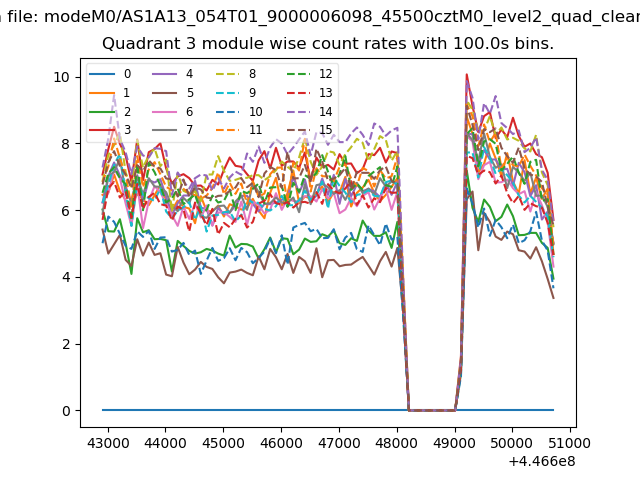
| Module-wise count rates for Quadrant A Data is divided into 100 sec bins |
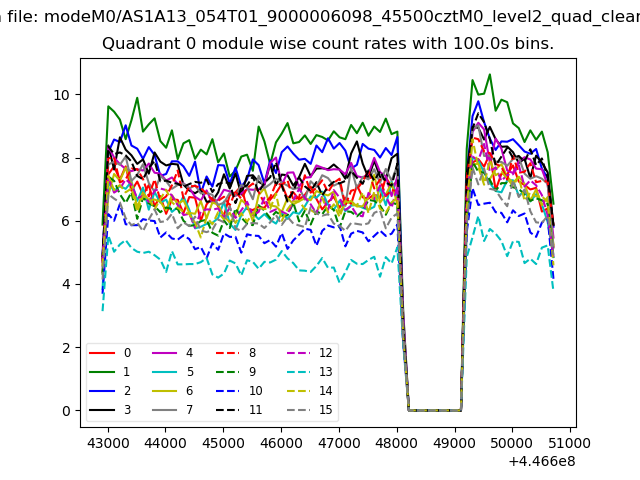 |
 |
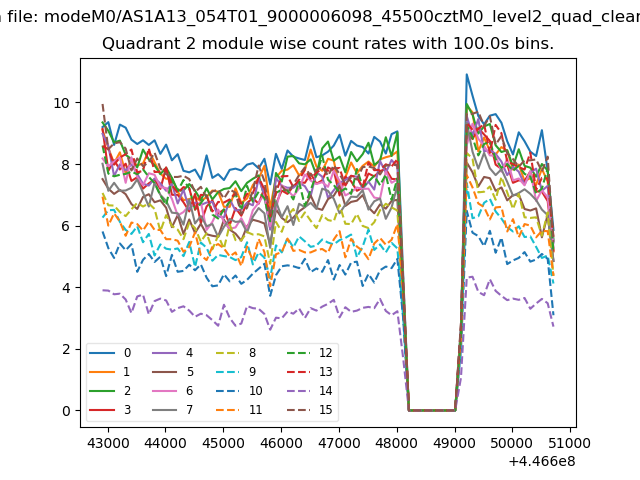
| Module-wise count rates for Quadrant B Data is divided into 100 sec bins |
 |
 |
| Module-wise count rates for Quadrant C Data is divided into 100 sec bins |
 |
 |
| Module-wise count rates for Quadrant D Data is divided into 100 sec bins |
 |
 |
| Parameter | Plot |
|---|---|
| CZT HV Monitor | 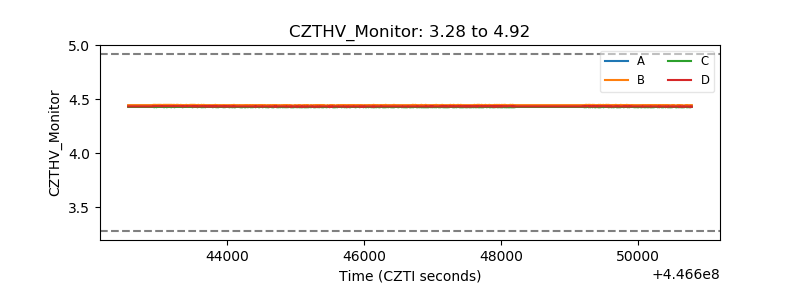 |
| D_VDD | 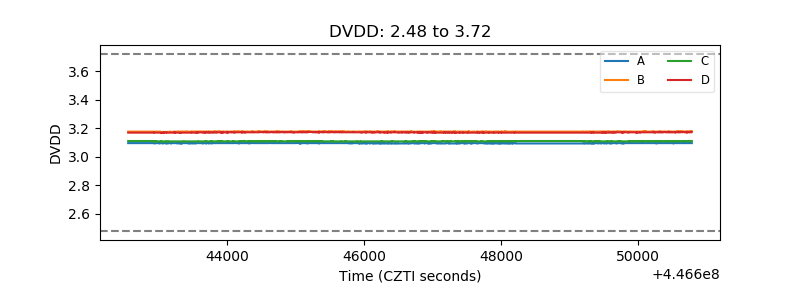 |
| Temperature 1 | 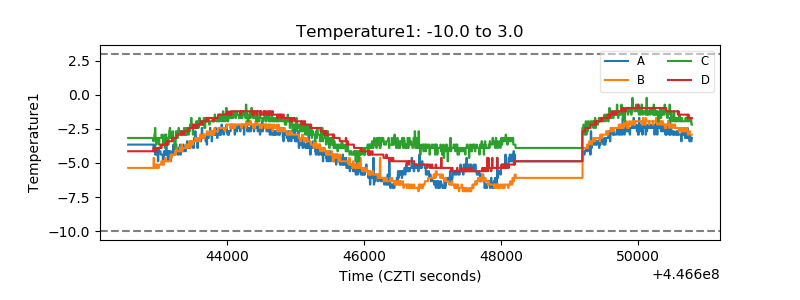 |
| Veto HV Monitor |  |
| Veto LLD | 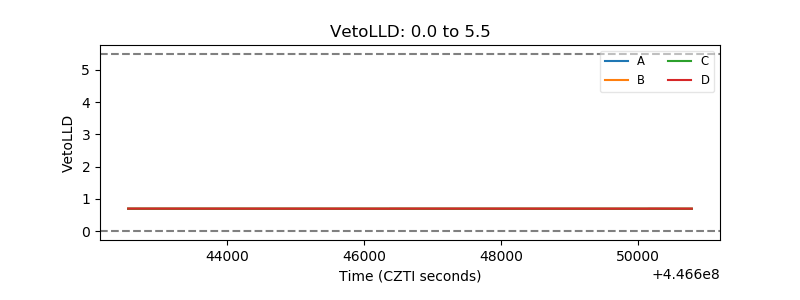 |
| Alpha Counter |  |
| _CPM_Rate | 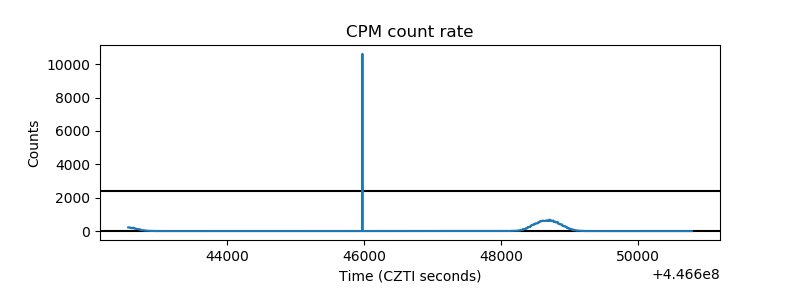 |
| CZT Counter | 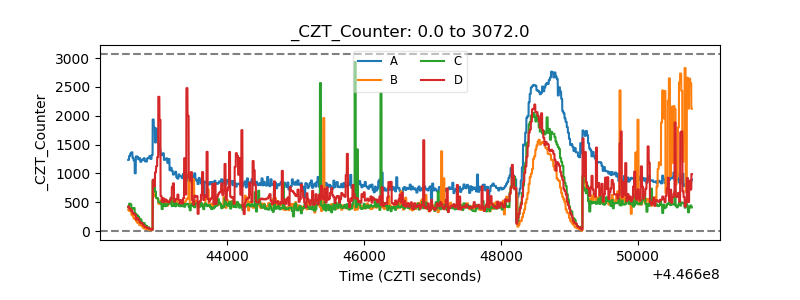 |
| +2.5 Volts monitor | 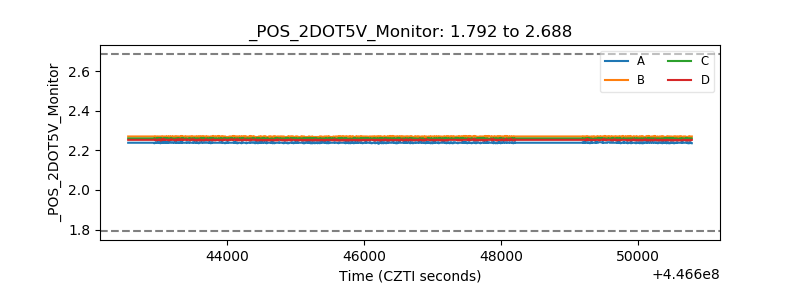 |
| +5 Volts monitor | 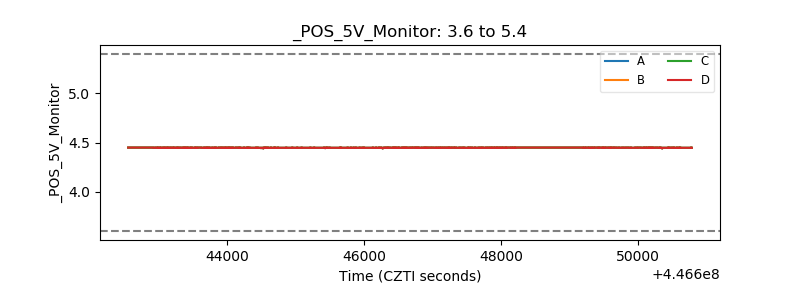 |
| _ROLL_ROT | 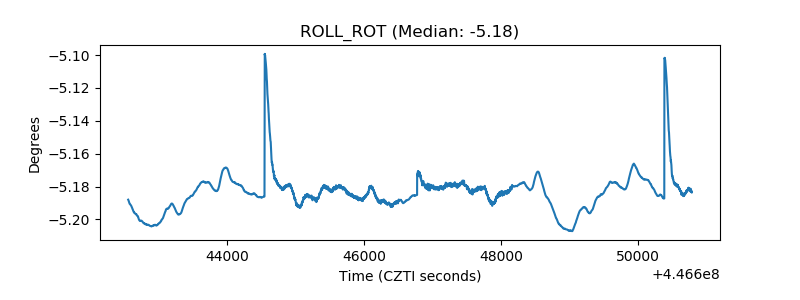 |
| _Roll_DEC | 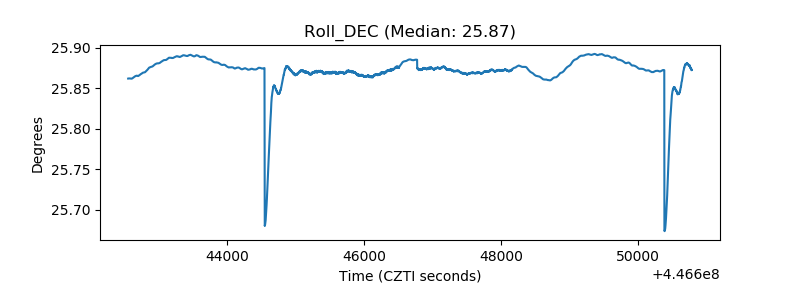 |
| _Roll_RA | 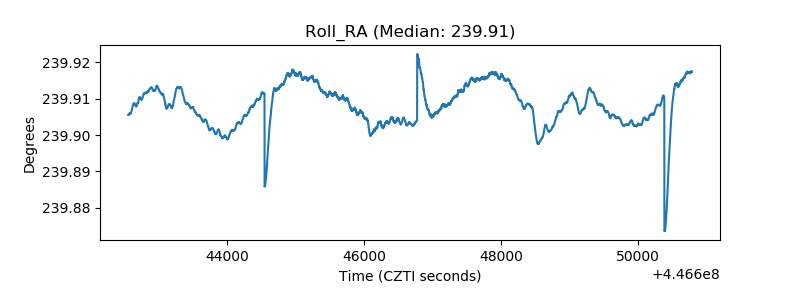 |
| Veto Counter | 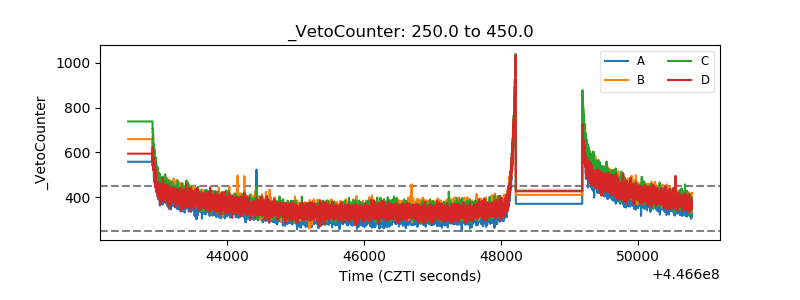 |