| Param | Original file | Final file |
|---|---|---|
| Filename | modeM0/AS1A13_054T01_9000006098_45501cztM0_level2.fits | modeM0/AS1A13_054T01_9000006098_45501cztM0_level2_quad_clean.evt |
| Size (bytes) | 509,584,320 | 110,424,960 |
| Size | 486.0 MB | 105.3 MB |
| Events in quadrant A | 5,724,749 | 750,637 |
| Events in quadrant B | 4,759,679 | 729,737 |
| Events in quadrant C | 3,254,358 | 738,639 |
| Events in quadrant D | 4,617,123 | 668,403 |
| Mode M0 | |||
|---|---|---|---|
| Quadrant | BADHDUFLAG | Total packets | Discarded packets |
| A | 0 | 21530 | 3 |
| B | 0 | 18475 | 1 |
| C | 0 | 14088 | 1 |
| D | 0 | 18124 | 1 |
| Mode SS | |||
|---|---|---|---|
| Quadrant | BADHDUFLAG | Total packets | Discarded packets |
| A | 0 | 134 | 0 |
| B | 0 | 134 | 0 |
| C | 0 | 134 | 0 |
| D | 0 | 134 | 0 |
| Mode M9 | |||
|---|---|---|---|
| Quadrant | BADHDUFLAG | Total packets | Discarded packets |
| A | 0 | 10 | 0 |
| B | 0 | 10 | 0 |
| C | 0 | 10 | 0 |
| D | 0 | 10 | 0 |
| Quadrant | Total seconds | Saturated seconds | Saturation percentage |
|---|---|---|---|
| A | 6538 | 211 | 3.227287% |
| B | 6539 | 687 | 10.506194% |
| C | 6539 | 106 | 1.621043% |
| D | 6539 | 253 | 3.869093% |
Noise dominated data is calculated using 1-second bins in cleaned event files. If a bin has >2000 counts, and if more than 50% of those come from <1% of pixels, then it is considered to be noise-dominated and hence unusable.
| Quadrant | # 1 sec bins | Bins with >0 counts | Bins with >2000 counts | High rate bins dominated by noise | Noise dominated (total time) | Noise dominated (detector-on time) | Marked lightcurve |
|---|---|---|---|---|---|---|---|
| A | 7608 | 6539 | 15 | 15 | 0.20% | 0.23% | 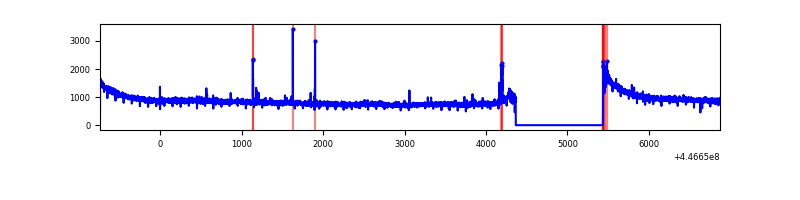 |
| B | 7609 | 6540 | 410 | 410 | 5.39% | 6.27% | 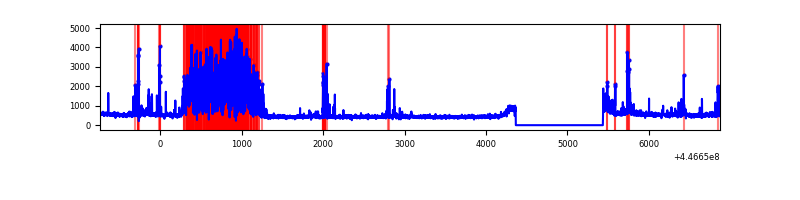 |
| C | 7609 | 6540 | 21 | 21 | 0.28% | 0.32% | 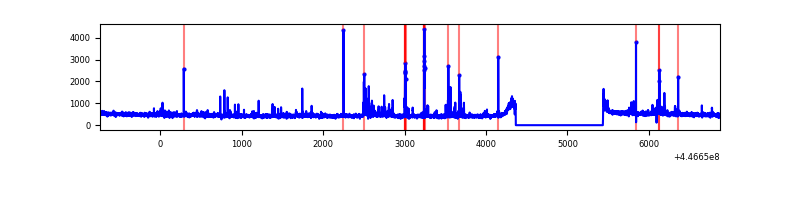 |
| D | 7609 | 6540 | 117 | 117 | 1.54% | 1.79% | 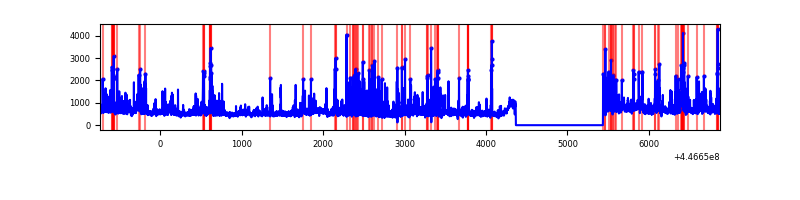 |
Top three noisy pixels from each quadrant. If the there are fewer than three noisy pixels in the level2.evt file, extra rows are filled as -1
| Pixel properties | Quadrant properties | ||||||
|---|---|---|---|---|---|---|---|
| Quadrant | DetID | PixID | Counts | Sigma | Mean | Median | Sigma |
| A | 10 | 83 | 2658101 | 16446.41 | 778 | 762 | 161.6 |
| A | 2 | 79 | 33612 | 203.31 | 778 | 762 | 161.6 |
| A | 13 | 248 | 11977 | 69.41 | 778 | 762 | 161.6 |
| B | 12 | 16 | 1460165 | 9845.83 | 754 | 731 | 148.2 |
| B | 5 | 172 | 161314 | 1083.35 | 754 | 731 | 148.2 |
| B | 0 | 189 | 36514 | 241.4 | 754 | 731 | 148.2 |
| C | 14 | 254 | 108378 | 594.72 | 769 | 776 | 180.9 |
| C | 1 | 3 | 80230 | 439.14 | 769 | 776 | 180.9 |
| C | 2 | 14 | 30729 | 165.55 | 769 | 776 | 180.9 |
| D | 1 | 52 | 564466 | 2935.64 | 762 | 740 | 192.0 |
| D | 11 | 241 | 425967 | 2214.4 | 762 | 740 | 192.0 |
| D | 2 | 249 | 224907 | 1167.37 | 762 | 740 | 192.0 |
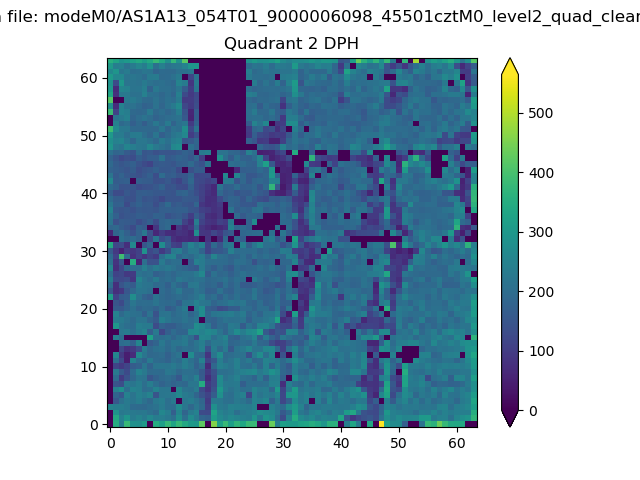
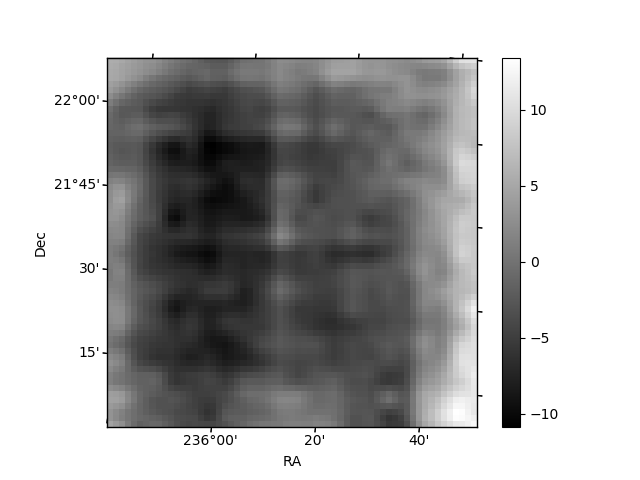
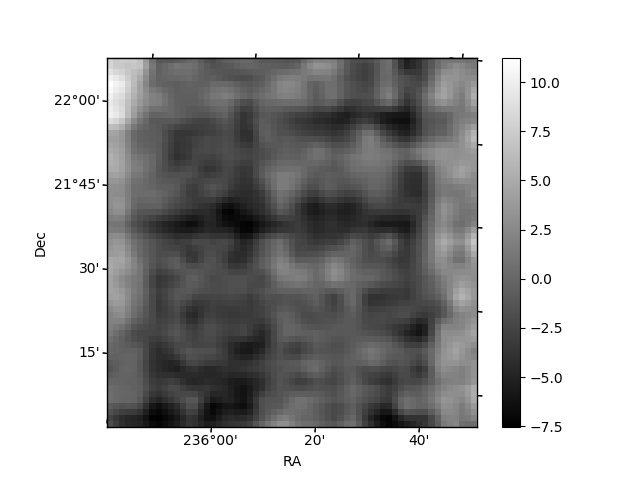
Histogram calculated using DETX and DETY for each event in the final _common_clean file
| Quadrant A | 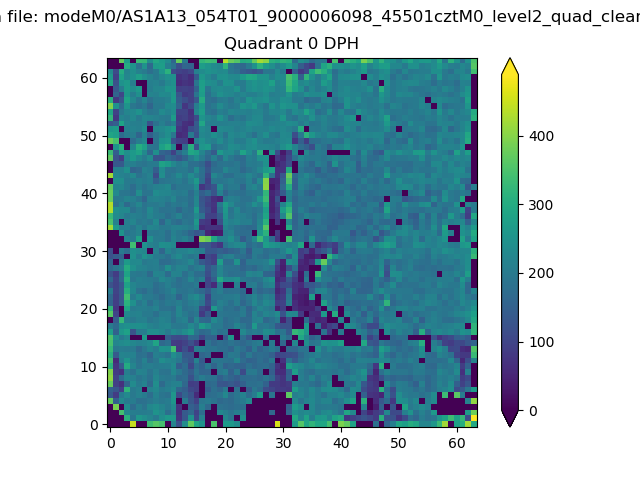 |
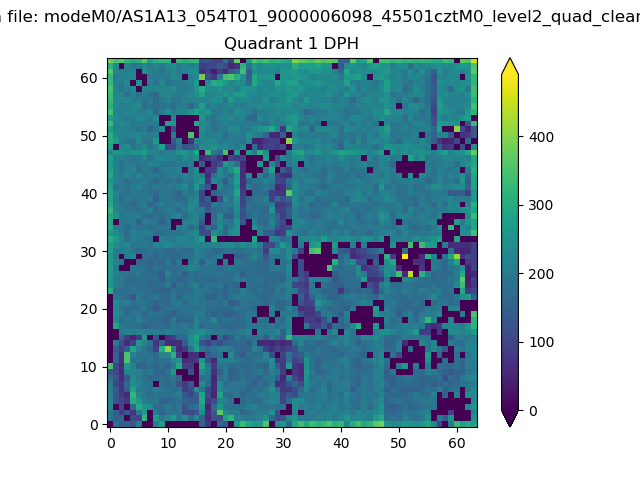 |
Quadrant B |
|---|---|---|---|
| Quadrant D | 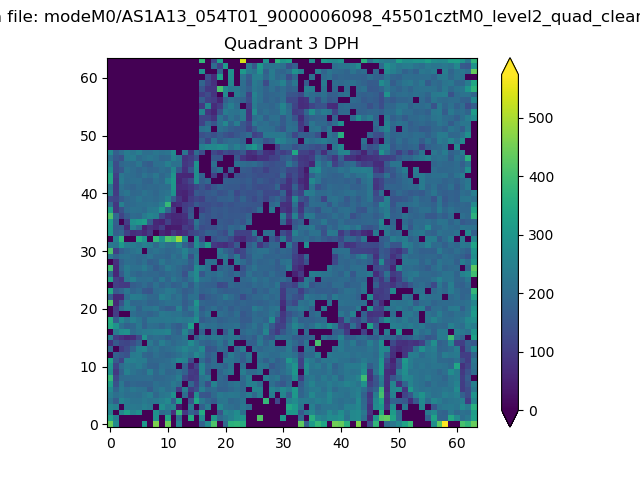 |
 |
Quadrant C |
| Plot type | Count rate plots | Images |
|---|---|---|
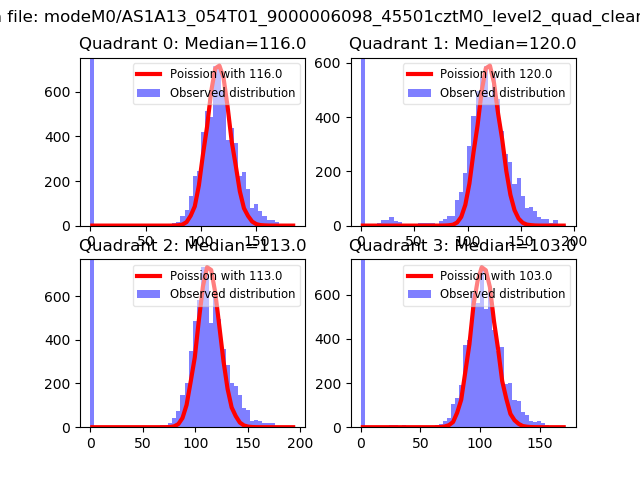
| Comparison with Poisson distribution Blue bars denote a histogram of data divided into 1 sec bins. Red curve is a Poisson curve with rate = median count rate of data. |
 |
 |
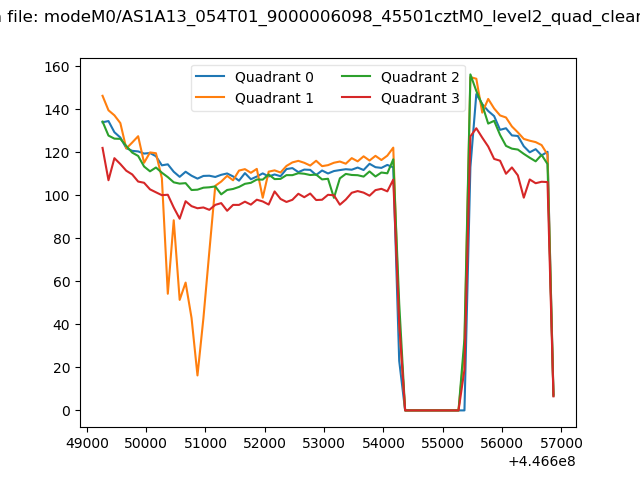
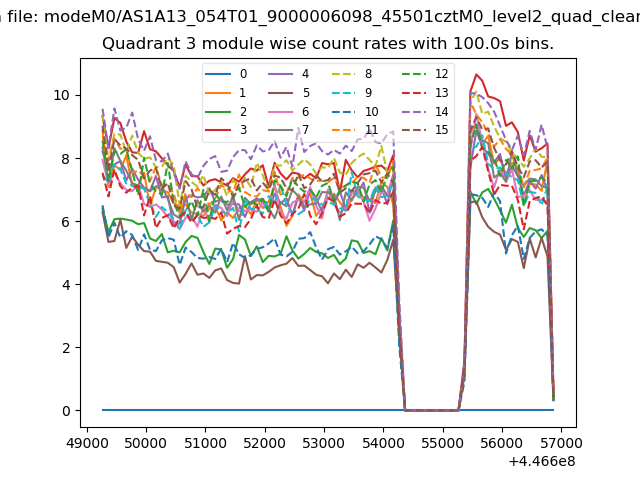
| Quadrant-wise count rates Data is divided into 100 sec bins |
 |
|
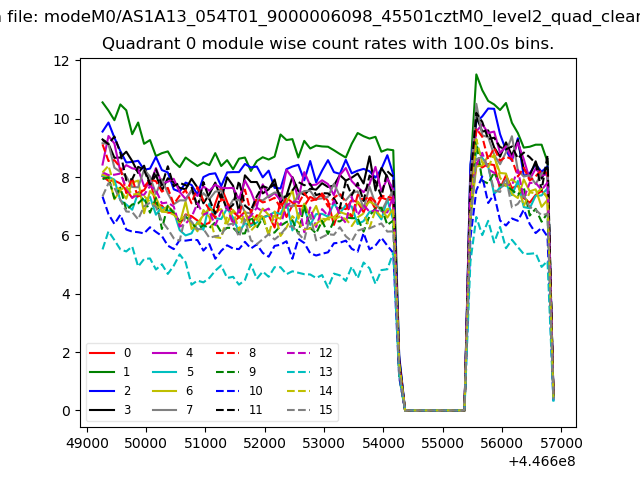
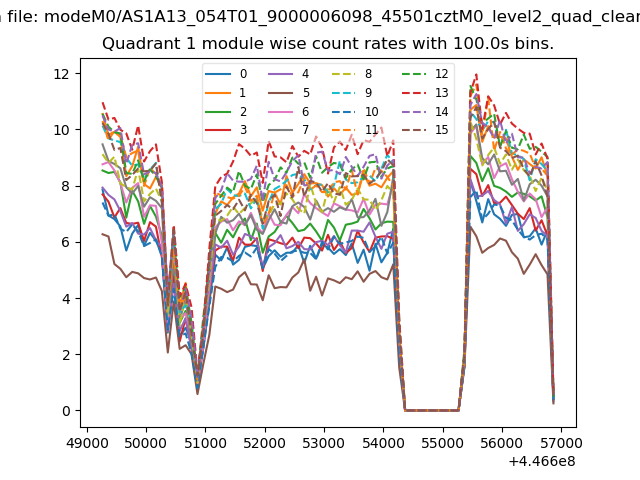
| Module-wise count rates for Quadrant A Data is divided into 100 sec bins |
 |
 |
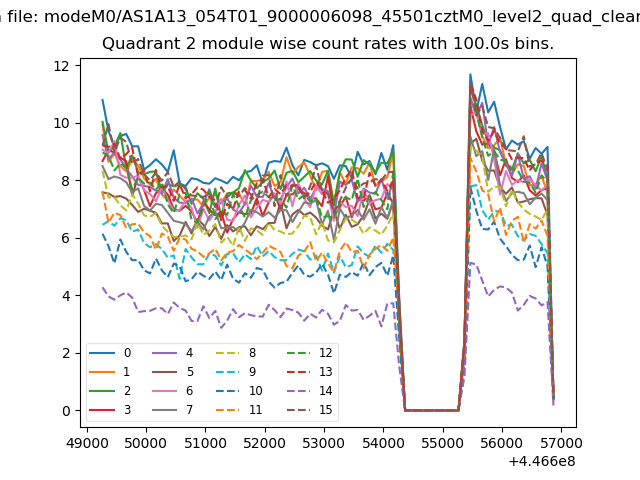
| Module-wise count rates for Quadrant B Data is divided into 100 sec bins |
 |
 |
| Module-wise count rates for Quadrant C Data is divided into 100 sec bins |
 |
 |
| Module-wise count rates for Quadrant D Data is divided into 100 sec bins |
 |
 |
| Parameter | Plot |
|---|---|
| CZT HV Monitor | 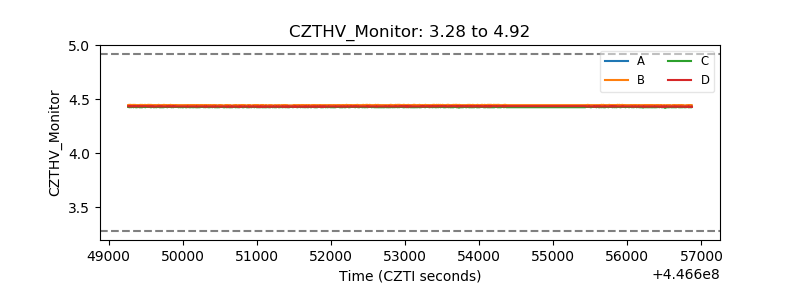 |
| D_VDD | 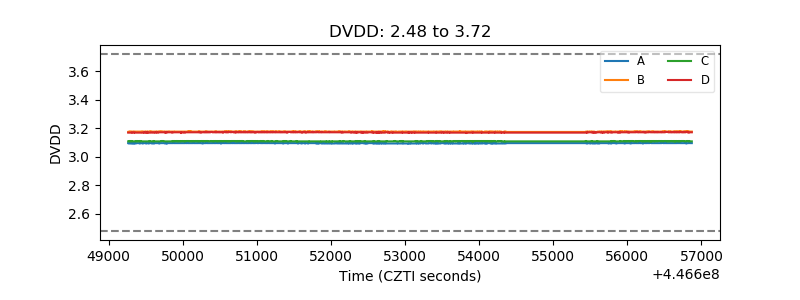 |
| Temperature 1 | 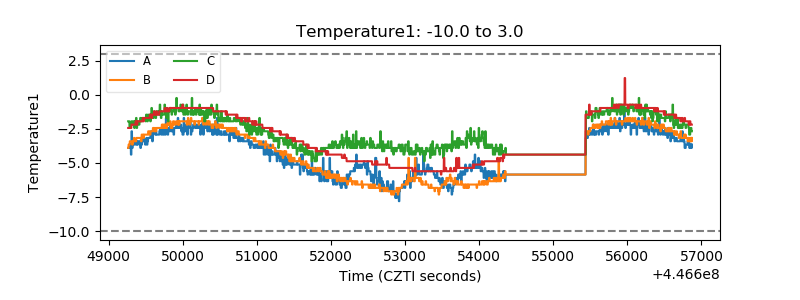 |
| Veto HV Monitor | 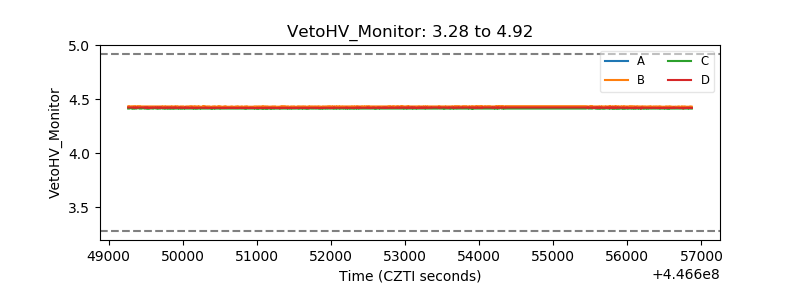 |
| Veto LLD | 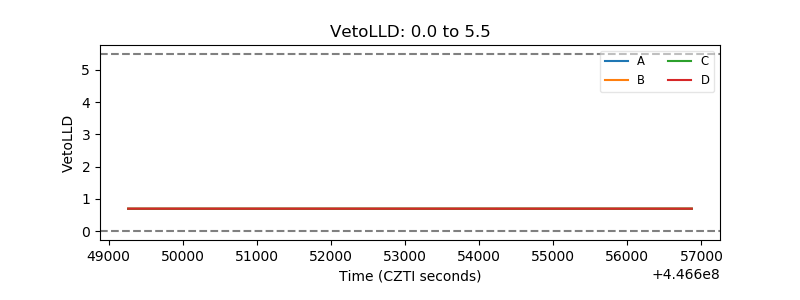 |
| Alpha Counter | 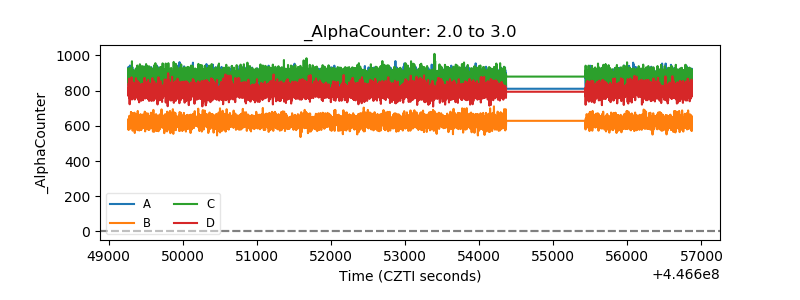 |
| _CPM_Rate | 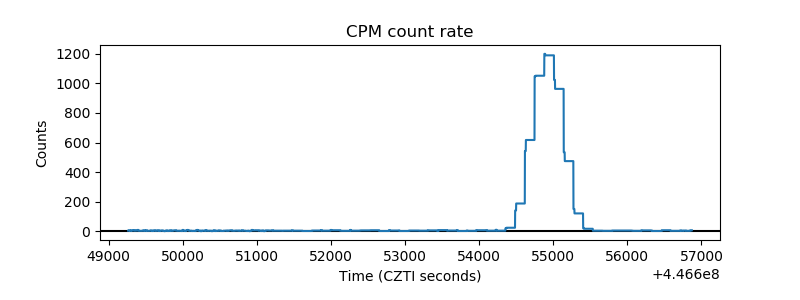 |
| CZT Counter | 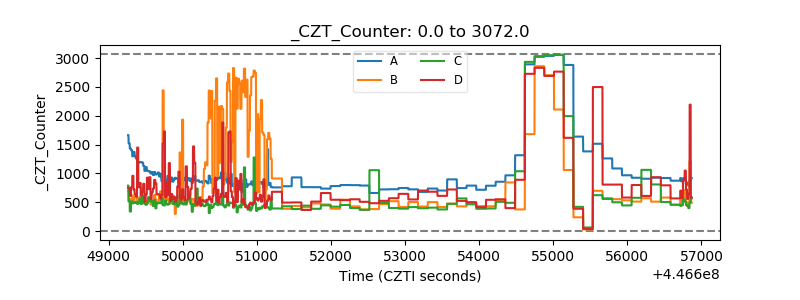 |
| +2.5 Volts monitor | 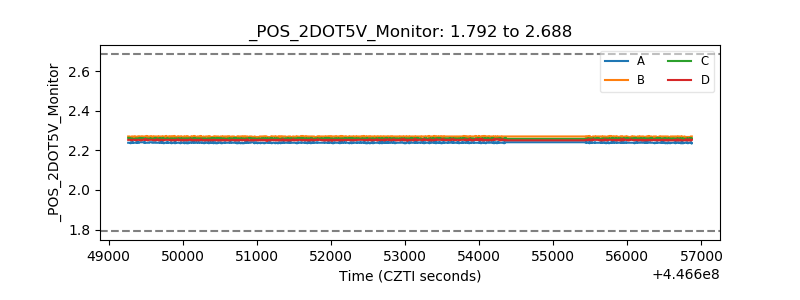 |
| +5 Volts monitor | 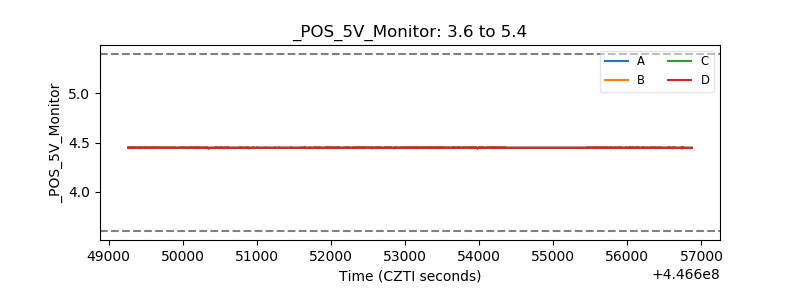 |
| _ROLL_ROT | 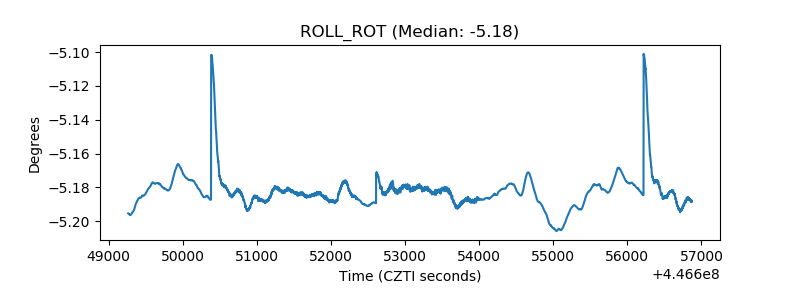 |
| _Roll_DEC | 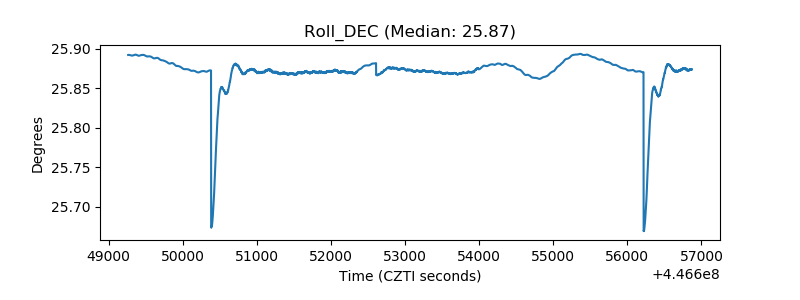 |
| _Roll_RA | 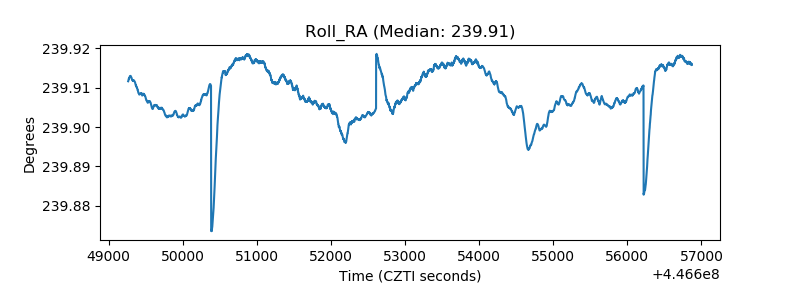 |
| Veto Counter | 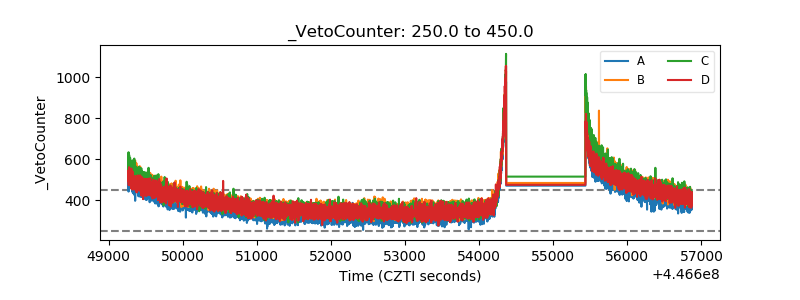 |