| Param | Original file | Final file |
|---|---|---|
| Filename | modeM0/AS1A13_054T01_9000006098_45502cztM0_level2.fits | modeM0/AS1A13_054T01_9000006098_45502cztM0_level2_quad_clean.evt |
| Size (bytes) | 487,396,800 | 115,704,000 |
| Size | 464.8 MB | 110.3 MB |
| Events in quadrant A | 5,852,143 | 776,871 |
| Events in quadrant B | 3,440,920 | 820,465 |
| Events in quadrant C | 3,263,698 | 777,792 |
| Events in quadrant D | 4,981,846 | 675,823 |
| Mode M0 | |||
|---|---|---|---|
| Quadrant | BADHDUFLAG | Total packets | Discarded packets |
| A | 0 | 21937 | 2 |
| B | 0 | 14434 | 2 |
| C | 0 | 13982 | 2 |
| D | 0 | 19372 | 2 |
| Mode SS | |||
|---|---|---|---|
| Quadrant | BADHDUFLAG | Total packets | Discarded packets |
| A | 0 | 132 | 0 |
| B | 0 | 132 | 0 |
| C | 0 | 132 | 0 |
| D | 0 | 132 | 0 |
| Mode M9 | |||
|---|---|---|---|
| Quadrant | BADHDUFLAG | Total packets | Discarded packets |
| A | 0 | 15 | 0 |
| B | 0 | 16 | 0 |
| C | 0 | 16 | 0 |
| D | 0 | 16 | 0 |
| Quadrant | Total seconds | Saturated seconds | Saturation percentage |
|---|---|---|---|
| A | 6489 | 228 | 3.513638% |
| B | 6489 | 104 | 1.602712% |
| C | 6489 | 56 | 0.862999% |
| D | 6489 | 429 | 6.611188% |
Noise dominated data is calculated using 1-second bins in cleaned event files. If a bin has >2000 counts, and if more than 50% of those come from <1% of pixels, then it is considered to be noise-dominated and hence unusable.
| Quadrant | # 1 sec bins | Bins with >0 counts | Bins with >2000 counts | High rate bins dominated by noise | Noise dominated (total time) | Noise dominated (detector-on time) | Marked lightcurve |
|---|---|---|---|---|---|---|---|
| A | 7704 | 6490 | 25 | 25 | 0.32% | 0.39% | 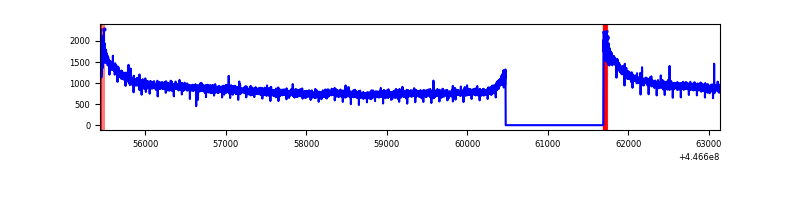 |
| B | 7704 | 6490 | 24 | 24 | 0.31% | 0.37% | 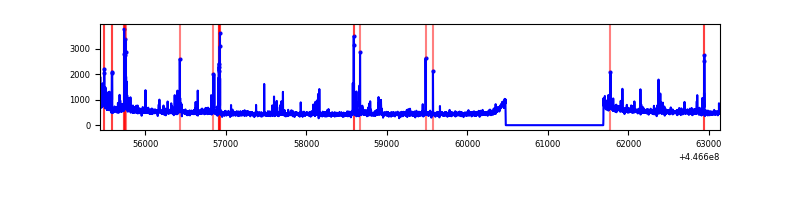 |
| C | 7704 | 6490 | 12 | 12 | 0.16% | 0.18% | 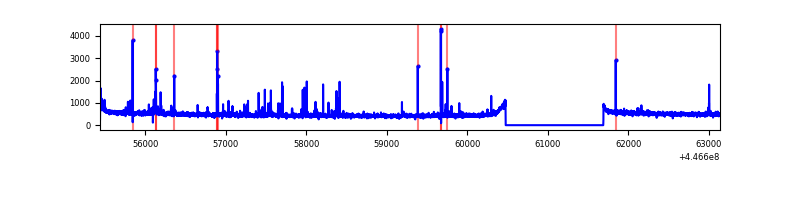 |
| D | 7704 | 6490 | 272 | 272 | 3.53% | 4.19% | 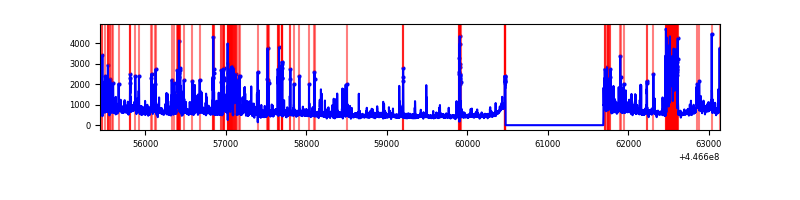 |
Top three noisy pixels from each quadrant. If the there are fewer than three noisy pixels in the level2.evt file, extra rows are filled as -1
| Pixel properties | Quadrant properties | ||||||
|---|---|---|---|---|---|---|---|
| Quadrant | DetID | PixID | Counts | Sigma | Mean | Median | Sigma |
| A | 10 | 83 | 2781582 | 16890.6 | 789 | 772 | 164.6 |
| A | 13 | 252 | 9566 | 53.41 | 789 | 772 | 164.6 |
| A | 3 | 137 | 8741 | 48.4 | 789 | 772 | 164.6 |
| B | 5 | 172 | 87206 | 559.21 | 795 | 771 | 154.6 |
| B | 0 | 186 | 65791 | 420.66 | 795 | 771 | 154.6 |
| B | 0 | 189 | 54448 | 347.28 | 795 | 771 | 154.6 |
| C | 14 | 254 | 111009 | 600.22 | 785 | 792 | 183.6 |
| C | 12 | 2 | 45272 | 242.23 | 785 | 792 | 183.6 |
| C | 2 | 14 | 16761 | 86.96 | 785 | 792 | 183.6 |
| D | 1 | 52 | 748485 | 3939.23 | 760 | 738 | 189.8 |
| D | 13 | 249 | 492083 | 2588.47 | 760 | 738 | 189.8 |
| D | 11 | 241 | 467412 | 2458.5 | 760 | 738 | 189.8 |
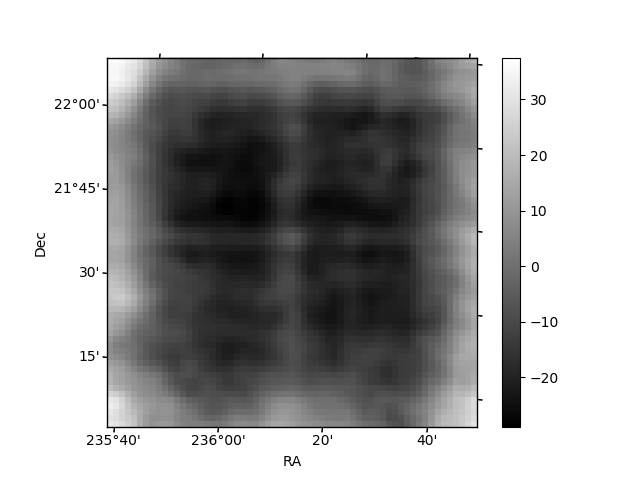
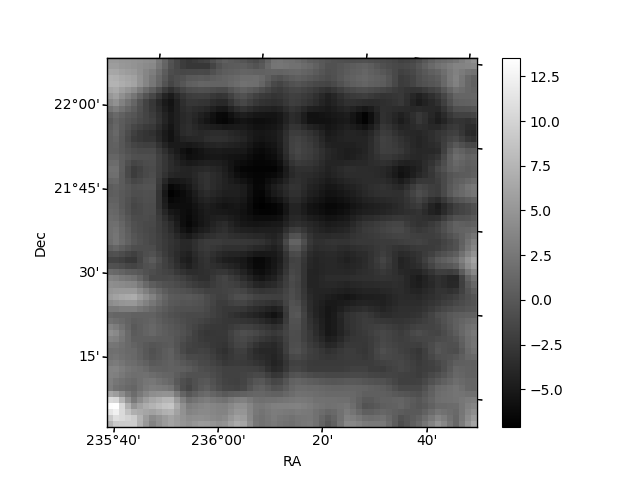
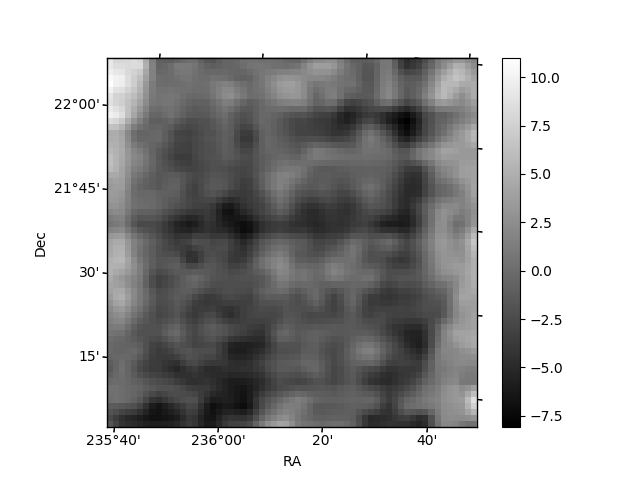
Histogram calculated using DETX and DETY for each event in the final _common_clean file
| Quadrant A | 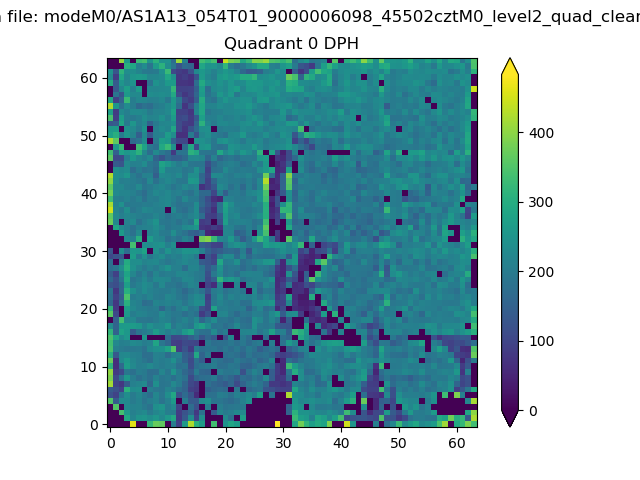 |
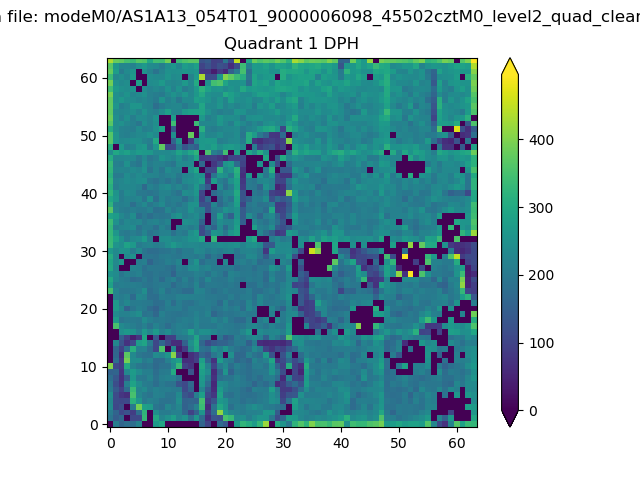 |
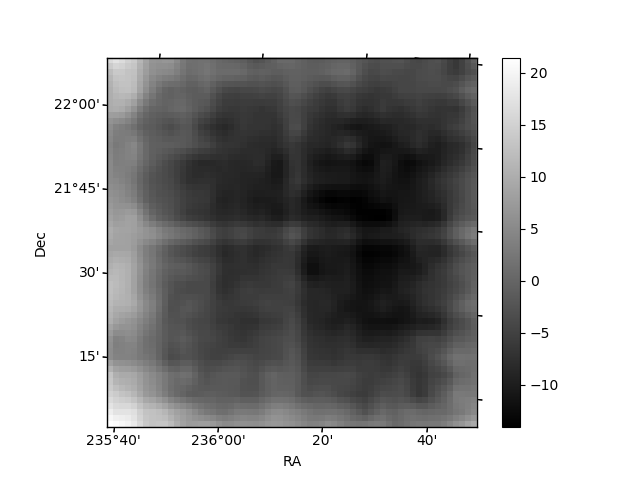
Quadrant B |
|---|---|---|---|
| Quadrant D | 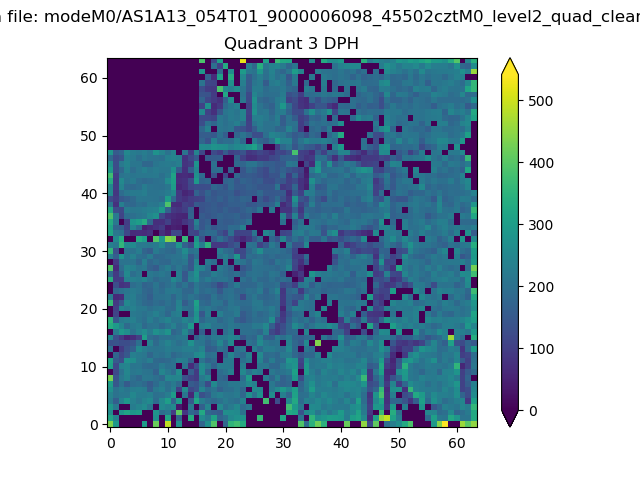 |
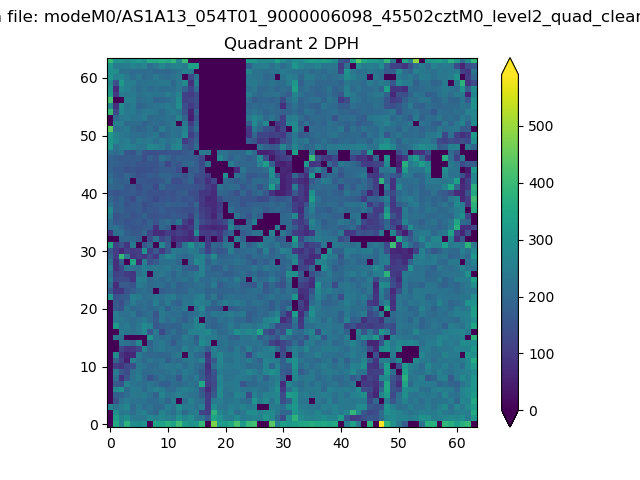 |
Quadrant C |
| Plot type | Count rate plots | Images |
|---|---|---|
| Comparison with Poisson distribution Blue bars denote a histogram of data divided into 1 sec bins. Red curve is a Poisson curve with rate = median count rate of data. |
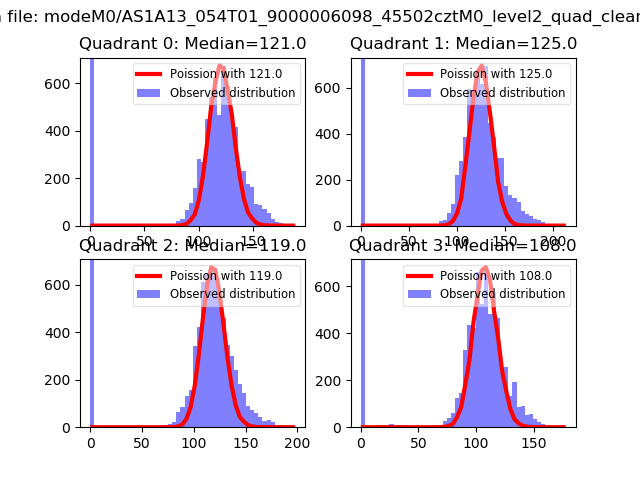 |
 |
| Quadrant-wise count rates Data is divided into 100 sec bins |
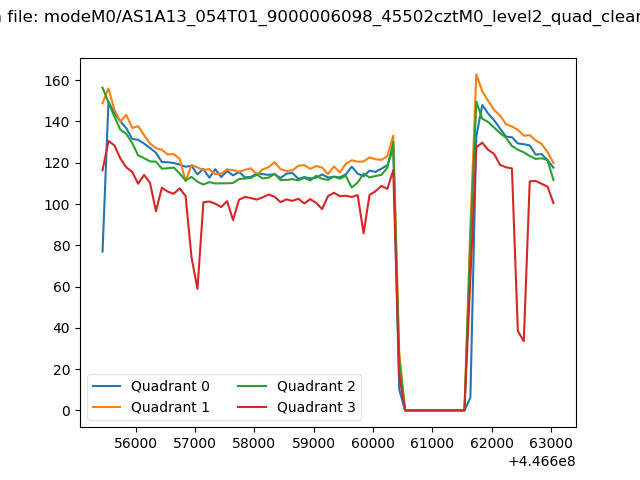 |
|
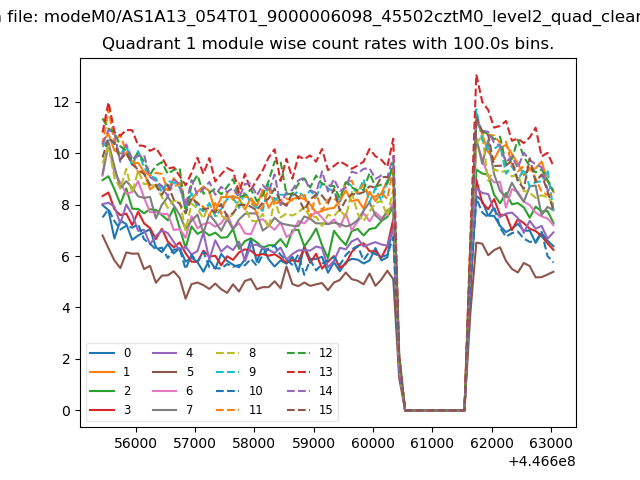
| Module-wise count rates for Quadrant A Data is divided into 100 sec bins |
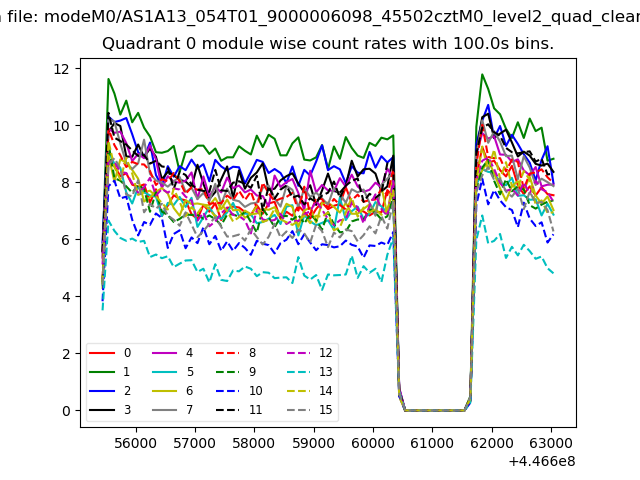 |
 |
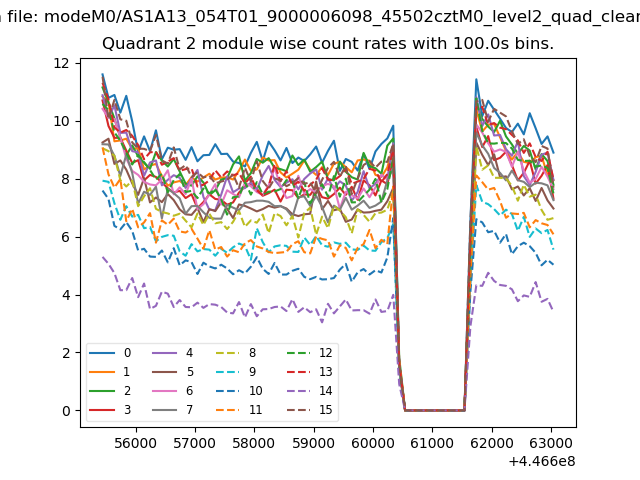
| Module-wise count rates for Quadrant B Data is divided into 100 sec bins |
 |
 |
| Module-wise count rates for Quadrant C Data is divided into 100 sec bins |
 |
 |
| Module-wise count rates for Quadrant D Data is divided into 100 sec bins |
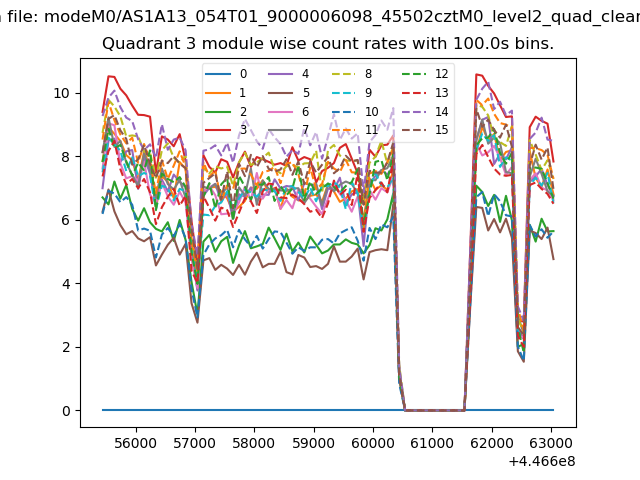 |
 |
| Parameter | Plot |
|---|---|
| CZT HV Monitor | 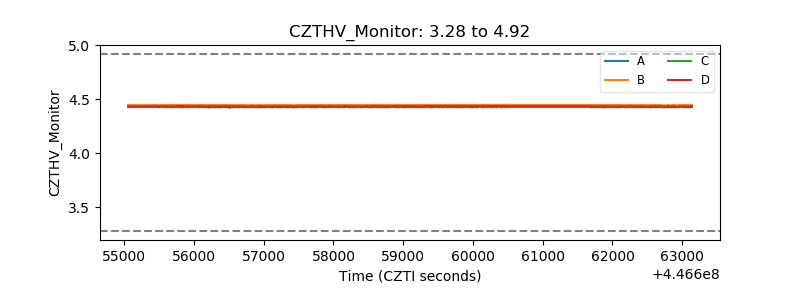 |
| D_VDD | 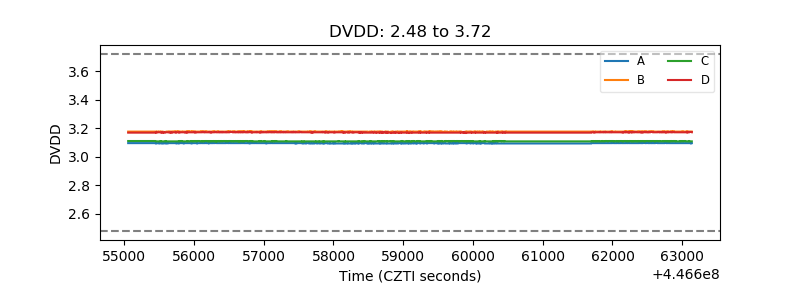 |
| Temperature 1 | 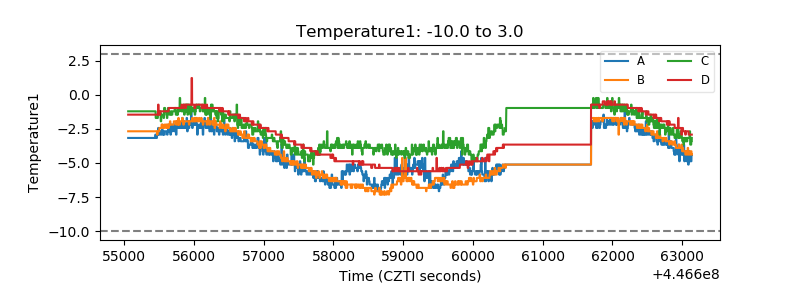 |
| Veto HV Monitor | 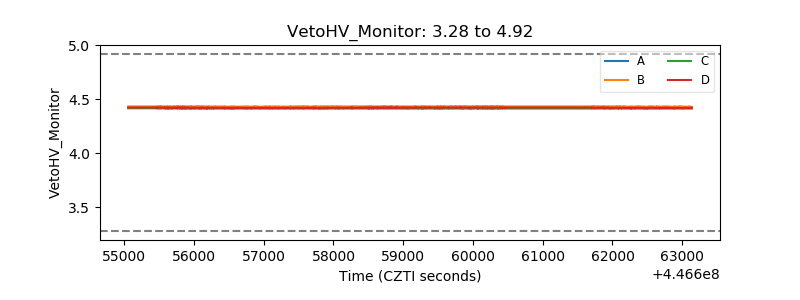 |
| Veto LLD | 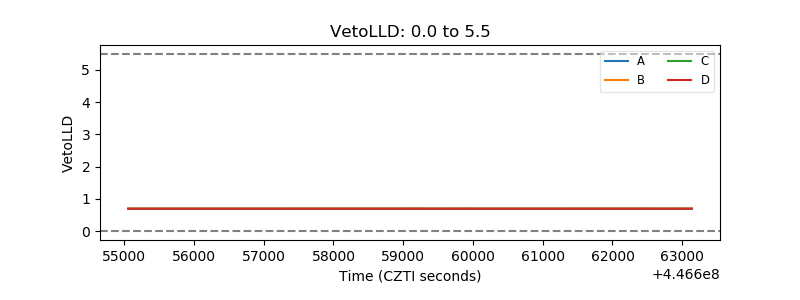 |
| Alpha Counter | 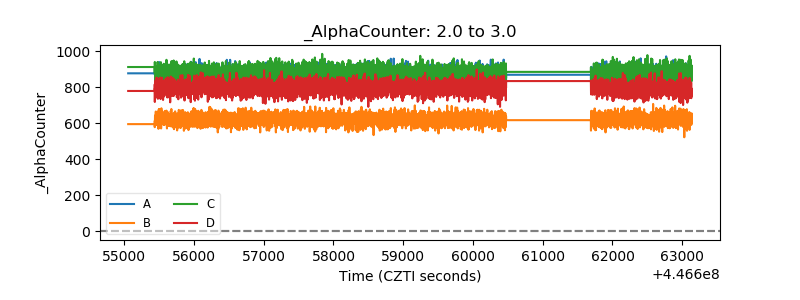 |
| _CPM_Rate | 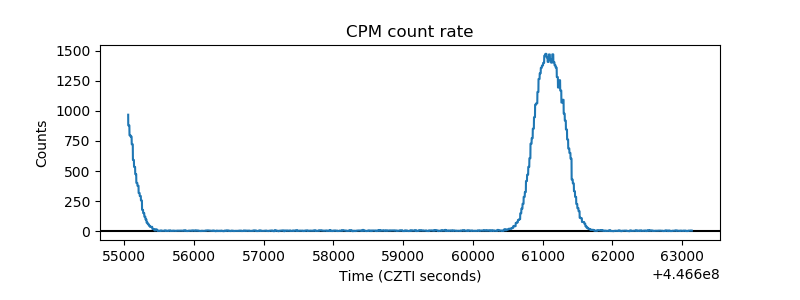 |
| CZT Counter | 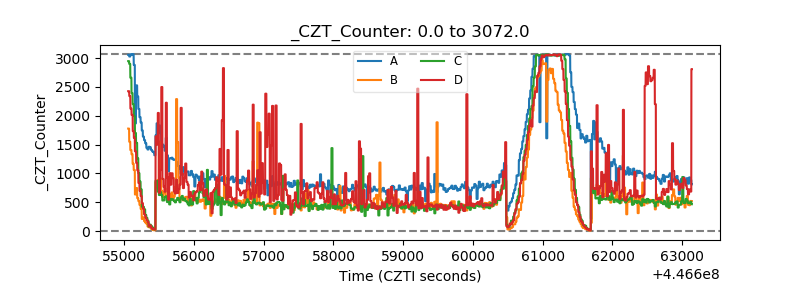 |
| +2.5 Volts monitor | 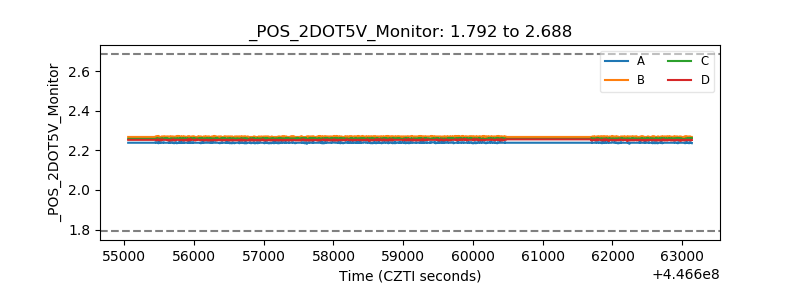 |
| +5 Volts monitor | 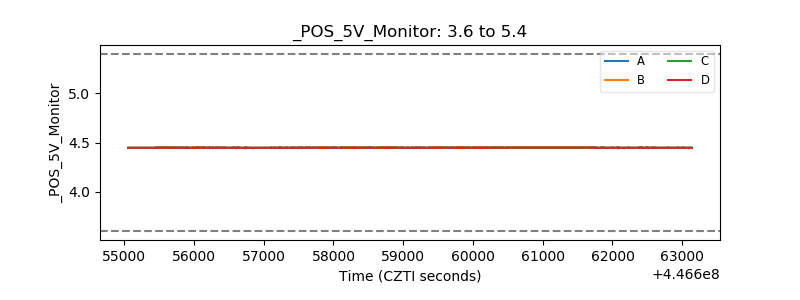 |
| _ROLL_ROT | 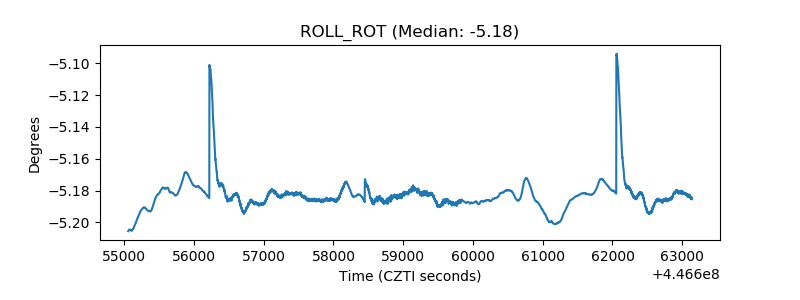 |
| _Roll_DEC | 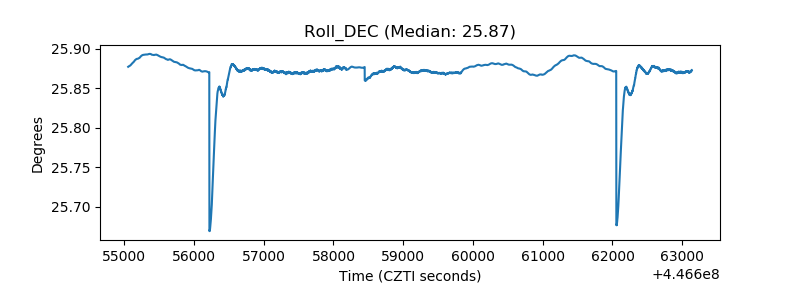 |
| _Roll_RA | 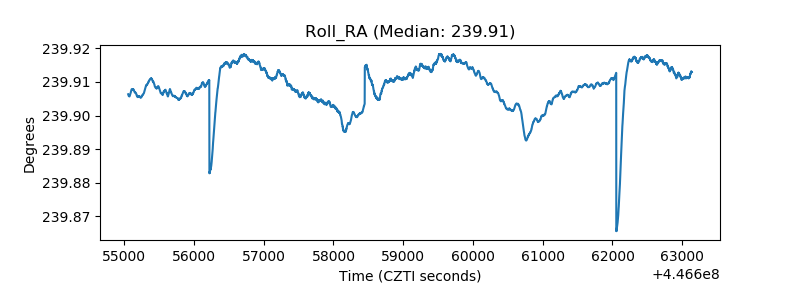 |
| Veto Counter | 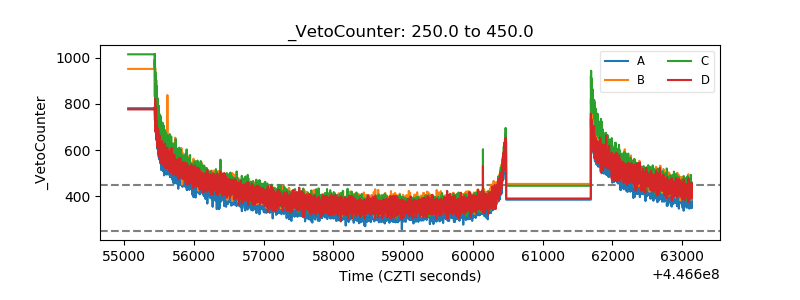 |