| Param | Original file | Final file |
|---|---|---|
| Filename | modeM0/AS1A13_054T01_9000006098_45503cztM0_level2.fits | modeM0/AS1A13_054T01_9000006098_45503cztM0_level2_quad_clean.evt |
| Size (bytes) | 509,935,680 | 113,417,280 |
| Size | 486.3 MB | 108.2 MB |
| Events in quadrant A | 5,832,730 | 763,925 |
| Events in quadrant B | 3,423,406 | 807,525 |
| Events in quadrant C | 3,247,145 | 774,720 |
| Events in quadrant D | 5,877,372 | 642,453 |
| Mode M0 | |||
|---|---|---|---|
| Quadrant | BADHDUFLAG | Total packets | Discarded packets |
| A | 0 | 21833 | 2 |
| B | 0 | 14414 | 2 |
| C | 0 | 13809 | 2 |
| D | 0 | 21949 | 9 |
| Mode SS | |||
|---|---|---|---|
| Quadrant | BADHDUFLAG | Total packets | Discarded packets |
| A | 0 | 130 | 0 |
| B | 0 | 130 | 0 |
| C | 0 | 130 | 0 |
| D | 0 | 130 | 0 |
| Mode M9 | |||
|---|---|---|---|
| Quadrant | BADHDUFLAG | Total packets | Discarded packets |
| A | 0 | 20 | 0 |
| B | 0 | 21 | 0 |
| C | 0 | 21 | 0 |
| D | 0 | 21 | 0 |
| Quadrant | Total seconds | Saturated seconds | Saturation percentage |
|---|---|---|---|
| A | 6389 | 280 | 4.382532% |
| B | 6389 | 162 | 2.535608% |
| C | 6389 | 83 | 1.299108% |
| D | 6388 | 769 | 12.038197% |
Noise dominated data is calculated using 1-second bins in cleaned event files. If a bin has >2000 counts, and if more than 50% of those come from <1% of pixels, then it is considered to be noise-dominated and hence unusable.
| Quadrant | # 1 sec bins | Bins with >0 counts | Bins with >2000 counts | High rate bins dominated by noise | Noise dominated (total time) | Noise dominated (detector-on time) | Marked lightcurve |
|---|---|---|---|---|---|---|---|
| A | 7589 | 6390 | 30 | 30 | 0.40% | 0.47% | 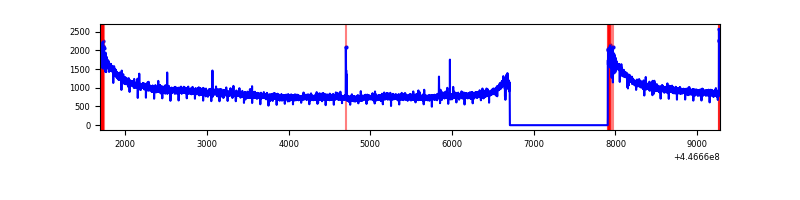 |
| B | 7589 | 6390 | 33 | 33 | 0.43% | 0.52% | 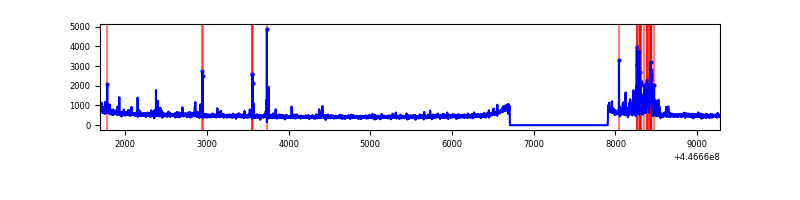 |
| C | 7589 | 6390 | 20 | 20 | 0.26% | 0.31% | 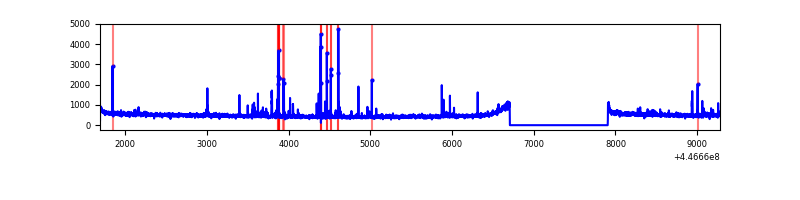 |
| D | 7588 | 6388 | 486 | 486 | 6.40% | 7.61% | 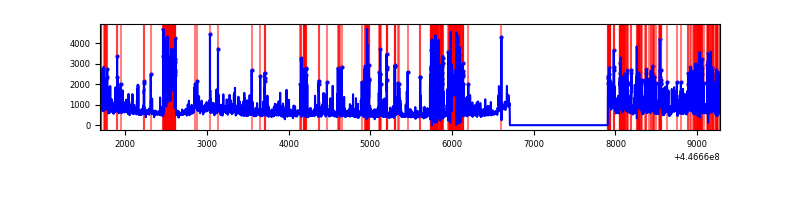 |
Top three noisy pixels from each quadrant. If the there are fewer than three noisy pixels in the level2.evt file, extra rows are filled as -1
| Pixel properties | Quadrant properties | ||||||
|---|---|---|---|---|---|---|---|
| Quadrant | DetID | PixID | Counts | Sigma | Mean | Median | Sigma |
| A | 10 | 83 | 2786401 | 17195.19 | 780 | 764 | 162.0 |
| A | 2 | 79 | 12792 | 74.25 | 780 | 764 | 162.0 |
| A | 13 | 248 | 11726 | 67.67 | 780 | 764 | 162.0 |
| B | 12 | 16 | 201222 | 1293.88 | 787 | 766 | 154.9 |
| B | 0 | 186 | 32373 | 204.01 | 787 | 766 | 154.9 |
| B | 4 | 170 | 25243 | 157.99 | 787 | 766 | 154.9 |
| C | 14 | 254 | 143329 | 778.22 | 782 | 789 | 183.2 |
| C | 3 | 233 | 23259 | 122.68 | 782 | 789 | 183.2 |
| C | 12 | 2 | 21490 | 113.02 | 782 | 789 | 183.2 |
| D | 1 | 52 | 1787490 | 9756.71 | 733 | 711 | 183.1 |
| D | 11 | 241 | 484210 | 2640.15 | 733 | 711 | 183.1 |
| D | 13 | 249 | 437295 | 2383.97 | 733 | 711 | 183.1 |
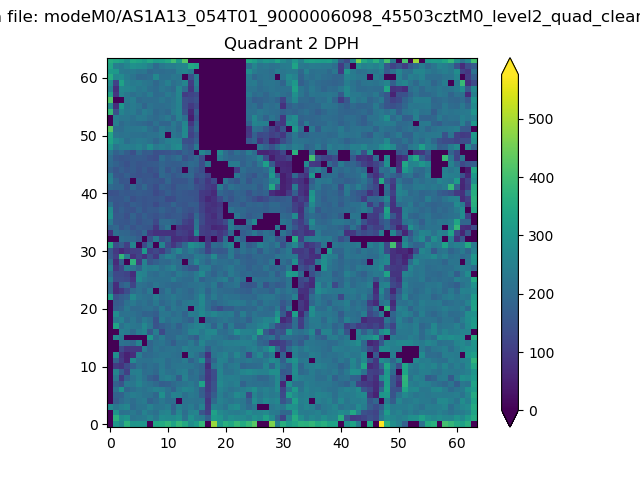
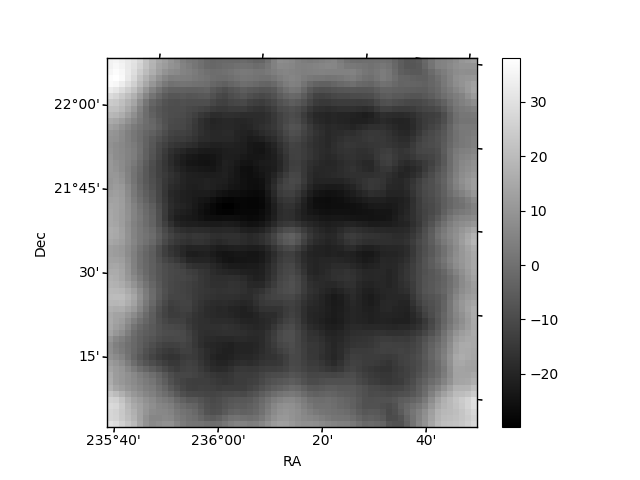
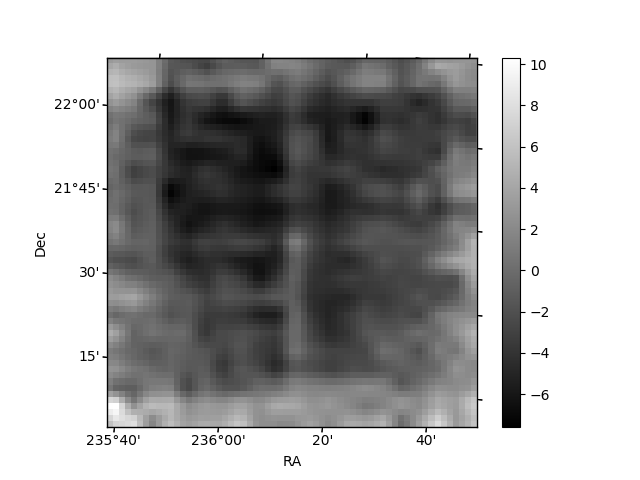
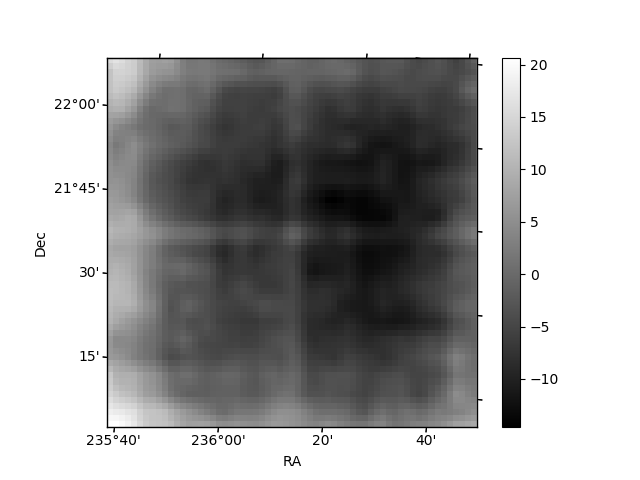
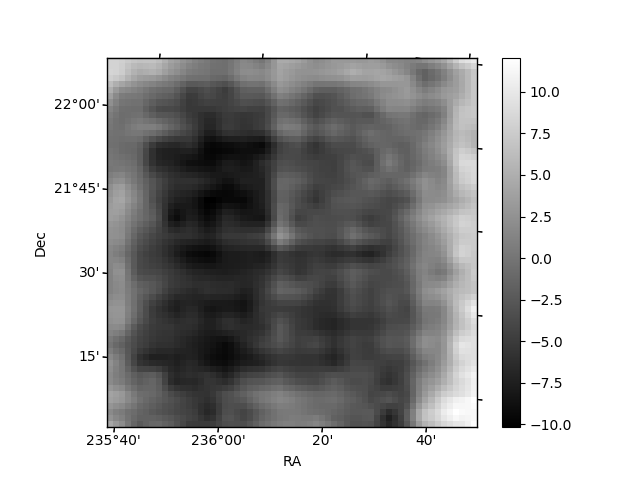
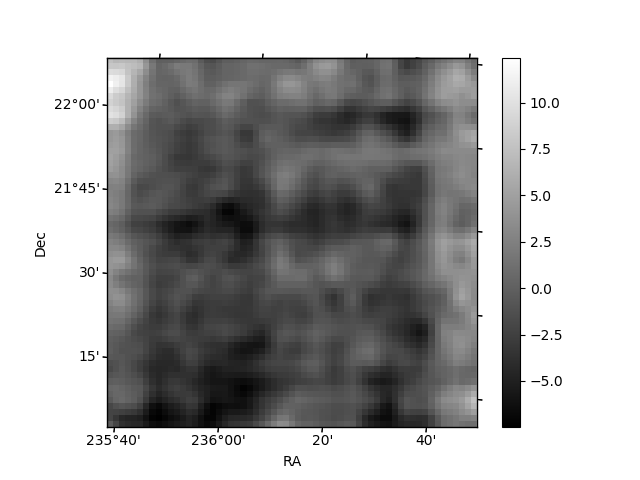
Histogram calculated using DETX and DETY for each event in the final _common_clean file
| Quadrant A | 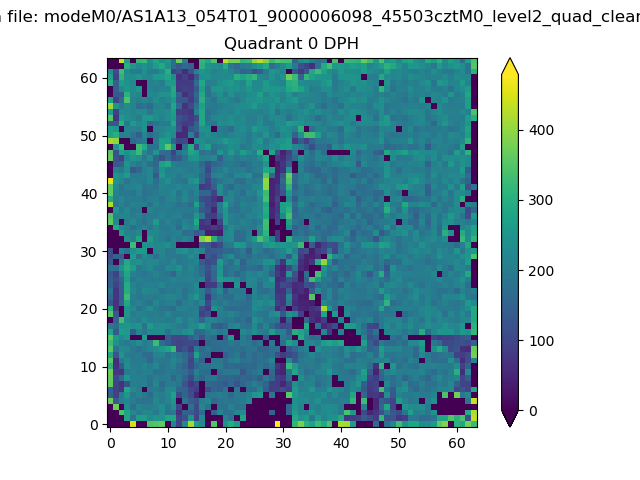 |
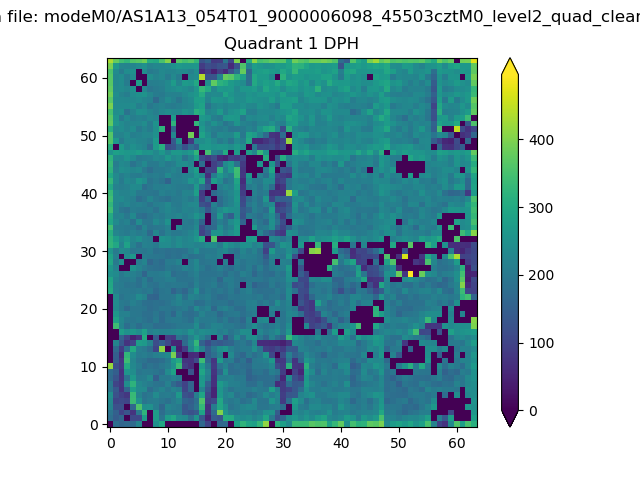 |
Quadrant B |
|---|---|---|---|
| Quadrant D | 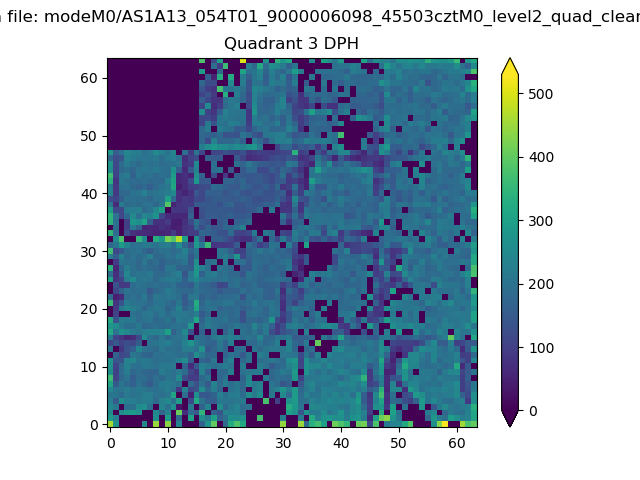 |
 |
Quadrant C |
| Plot type | Count rate plots | Images |
|---|---|---|
| Comparison with Poisson distribution Blue bars denote a histogram of data divided into 1 sec bins. Red curve is a Poisson curve with rate = median count rate of data. |
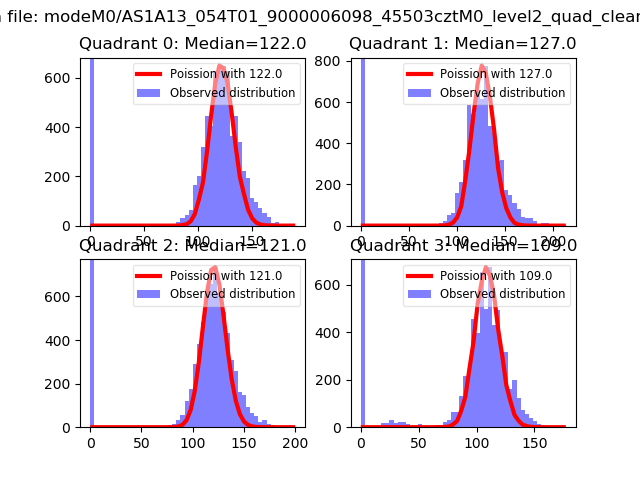 |
 |
| Quadrant-wise count rates Data is divided into 100 sec bins |
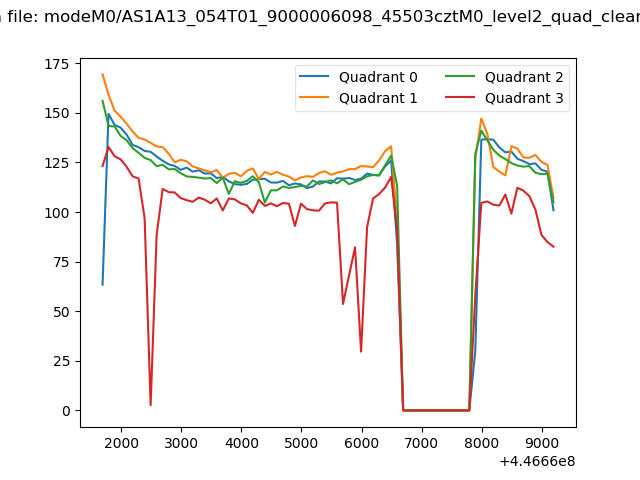 |
|
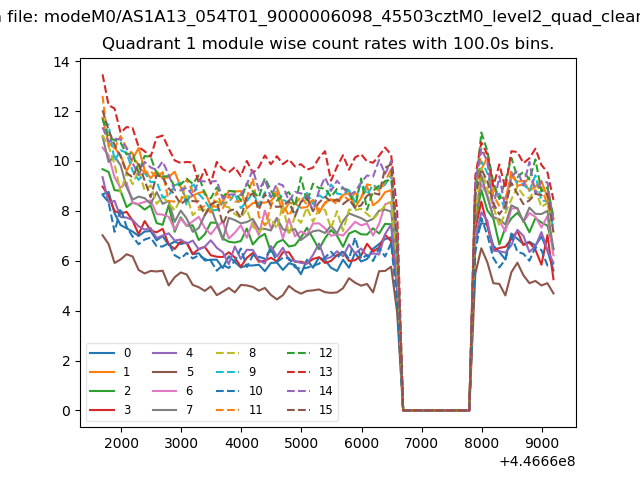
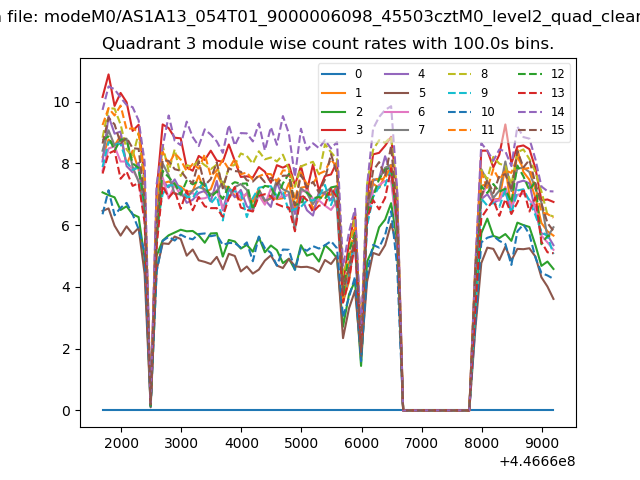
| Module-wise count rates for Quadrant A Data is divided into 100 sec bins |
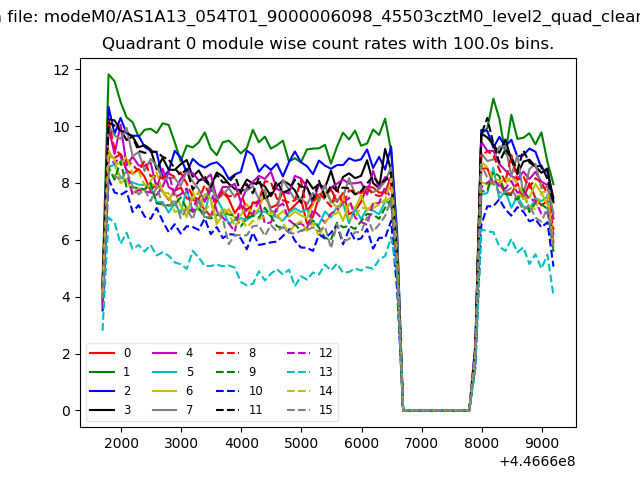 |
 |
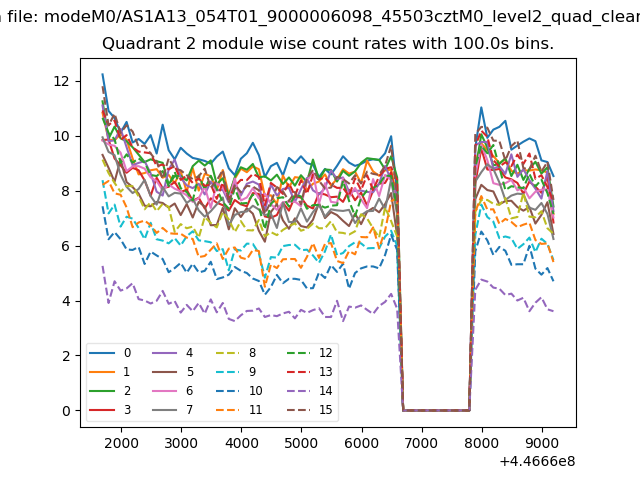
| Module-wise count rates for Quadrant B Data is divided into 100 sec bins |
 |
 |
| Module-wise count rates for Quadrant C Data is divided into 100 sec bins |
 |
 |
| Module-wise count rates for Quadrant D Data is divided into 100 sec bins |
 |
 |
| Parameter | Plot |
|---|---|
| CZT HV Monitor | 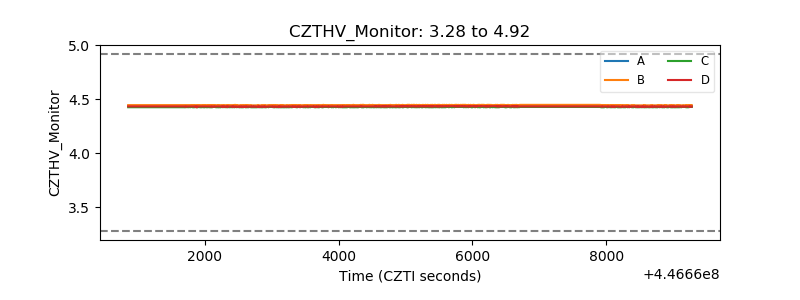 |
| D_VDD | 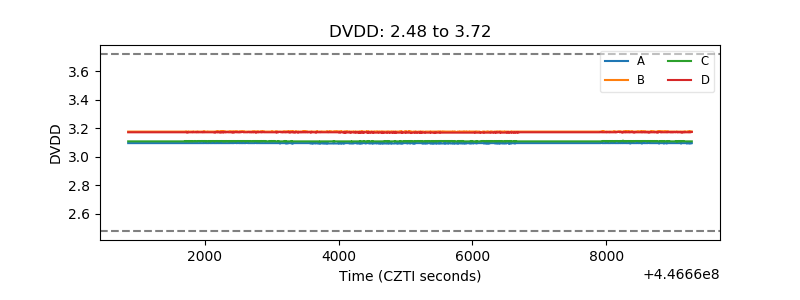 |
| Temperature 1 | 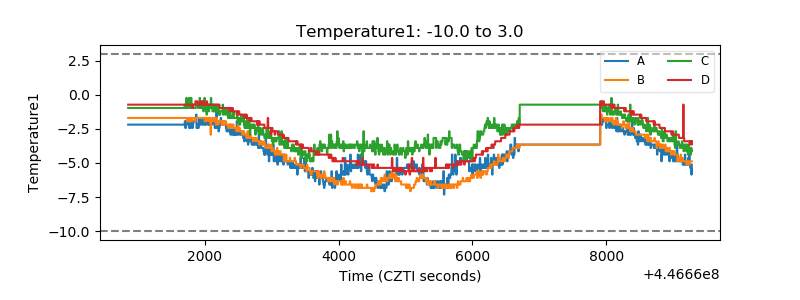 |
| Veto HV Monitor | 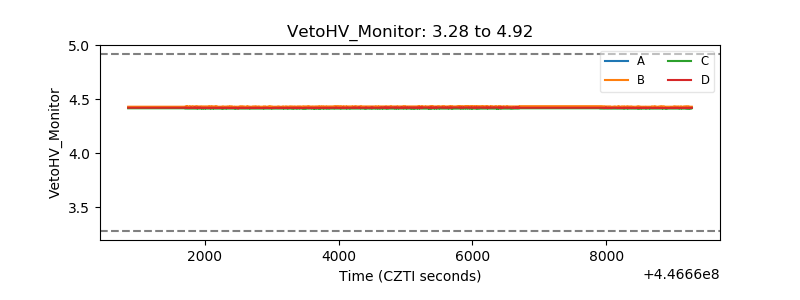 |
| Veto LLD | 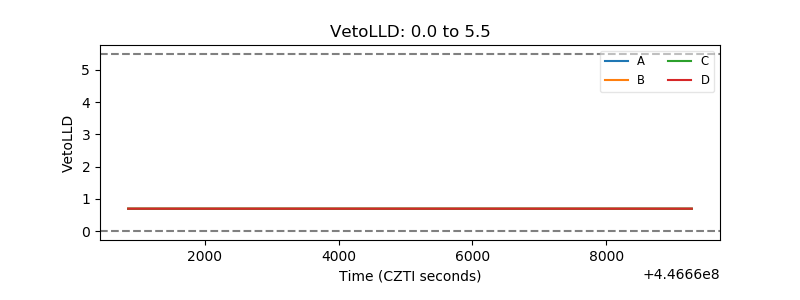 |
| Alpha Counter | 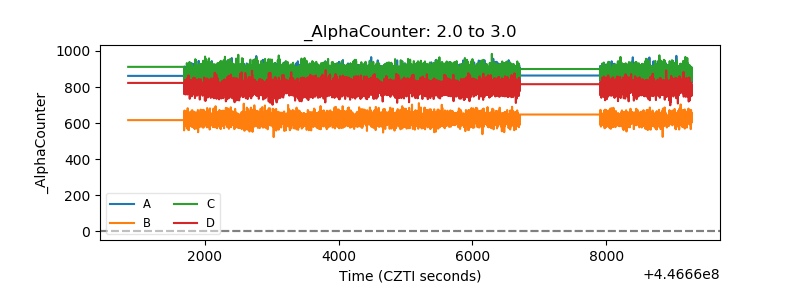 |
| _CPM_Rate | 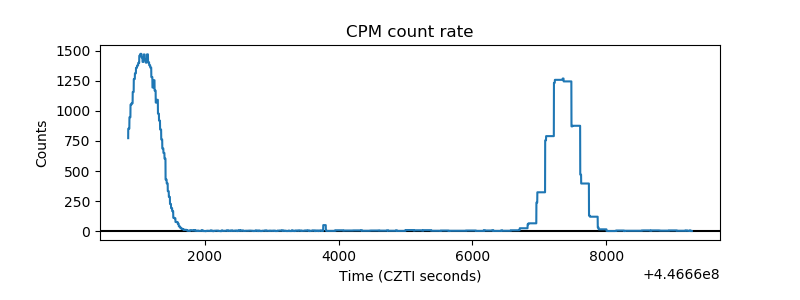 |
| CZT Counter | 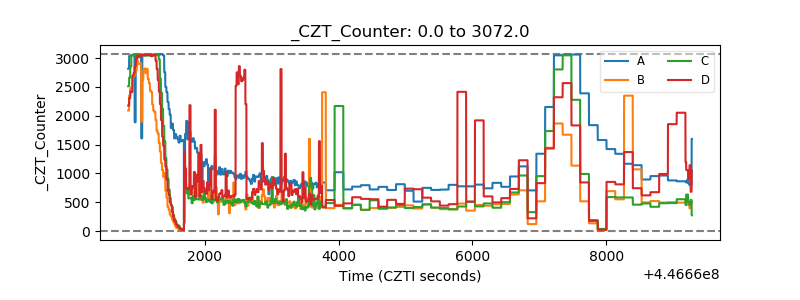 |
| +2.5 Volts monitor | 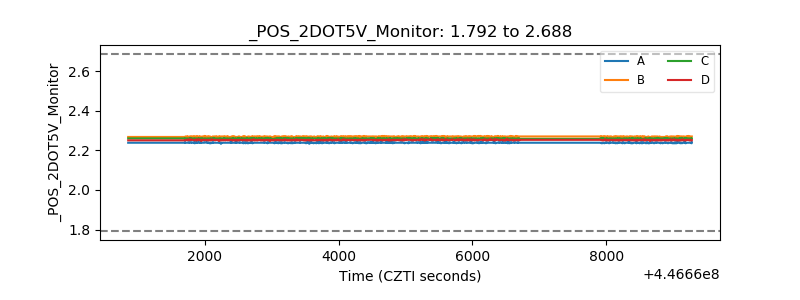 |
| +5 Volts monitor | 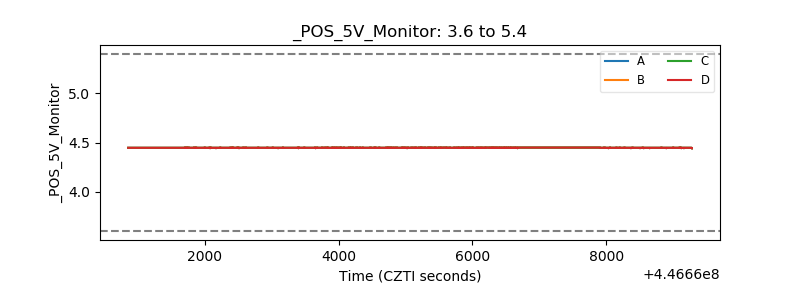 |
| _ROLL_ROT | 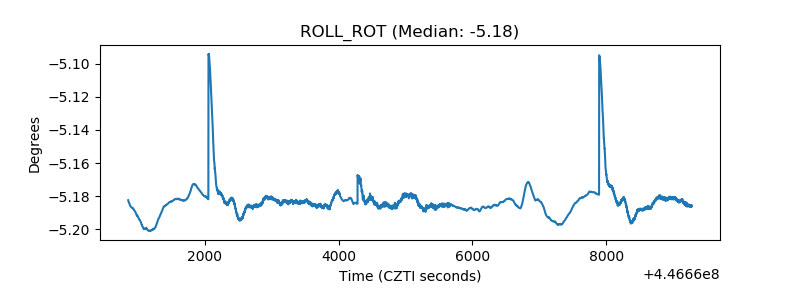 |
| _Roll_DEC | 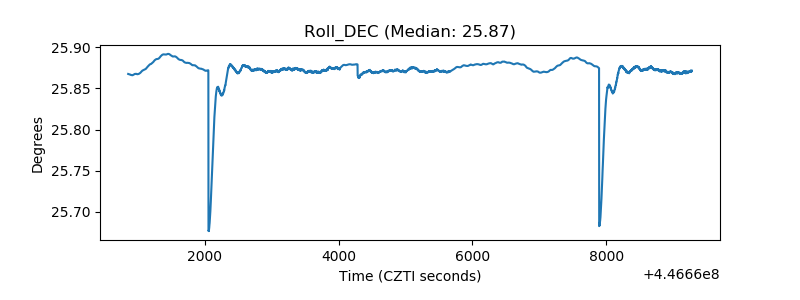 |
| _Roll_RA | 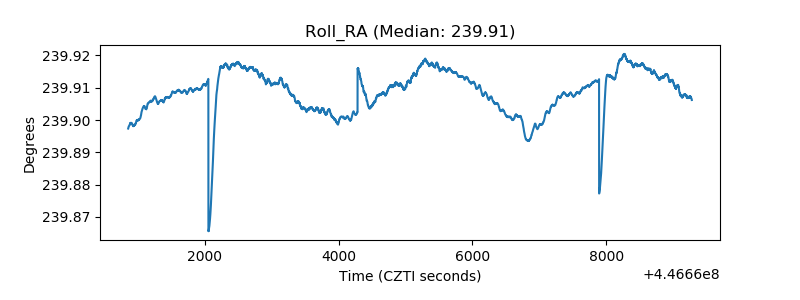 |
| Veto Counter | 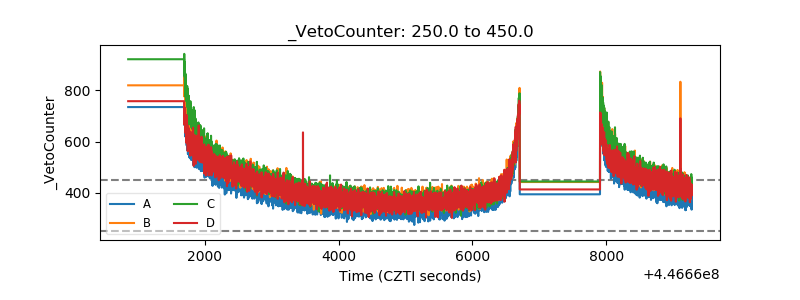 |