| Param | Original file | Final file |
|---|---|---|
| Filename | modeM0/AS1A13_054T01_9000006098_45504cztM0_level2.fits | modeM0/AS1A13_054T01_9000006098_45504cztM0_level2_quad_clean.evt |
| Size (bytes) | 452,920,320 | 104,008,320 |
| Size | 431.9 MB | 99.2 MB |
| Events in quadrant A | 5,127,676 | 694,658 |
| Events in quadrant B | 3,098,809 | 726,284 |
| Events in quadrant C | 3,014,007 | 697,191 |
| Events in quadrant D | 5,058,992 | 612,110 |
| Mode M0 | |||
|---|---|---|---|
| Quadrant | BADHDUFLAG | Total packets | Discarded packets |
| A | 0 | 19628 | 1 |
| B | 0 | 13222 | 1 |
| C | 0 | 13077 | 1 |
| D | 0 | 19176 | 1 |
| Mode SS | |||
|---|---|---|---|
| Quadrant | BADHDUFLAG | Total packets | Discarded packets |
| A | 0 | 122 | 0 |
| B | 0 | 122 | 0 |
| C | 0 | 122 | 0 |
| D | 0 | 122 | 0 |
| Mode M9 | |||
|---|---|---|---|
| Quadrant | BADHDUFLAG | Total packets | Discarded packets |
| A | 0 | 11 | 0 |
| B | 0 | 11 | 0 |
| C | 0 | 11 | 0 |
| D | 0 | 11 | 0 |
| Quadrant | Total seconds | Saturated seconds | Saturation percentage |
|---|---|---|---|
| A | 6003 | 187 | 3.115109% |
| B | 6003 | 140 | 2.332167% |
| C | 6003 | 76 | 1.266034% |
| D | 6003 | 426 | 7.096452% |
Noise dominated data is calculated using 1-second bins in cleaned event files. If a bin has >2000 counts, and if more than 50% of those come from <1% of pixels, then it is considered to be noise-dominated and hence unusable.
| Quadrant | # 1 sec bins | Bins with >0 counts | Bins with >2000 counts | High rate bins dominated by noise | Noise dominated (total time) | Noise dominated (detector-on time) | Marked lightcurve |
|---|---|---|---|---|---|---|---|
| A | 7183 | 6004 | 17 | 17 | 0.24% | 0.28% | 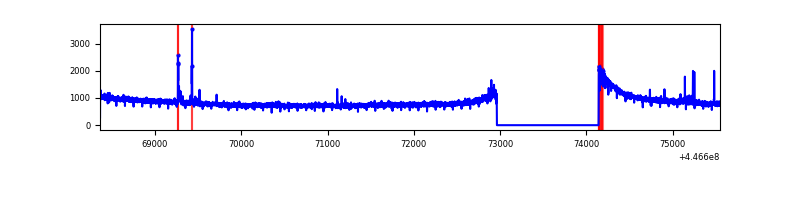 |
| B | 7183 | 6004 | 53 | 53 | 0.74% | 0.88% | 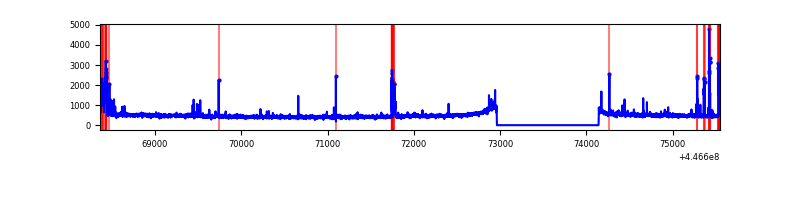 |
| C | 7183 | 6004 | 28 | 28 | 0.39% | 0.47% | 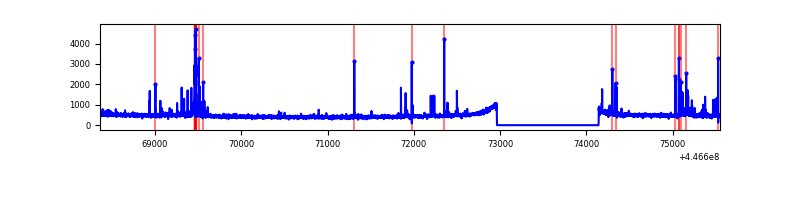 |
| D | 7183 | 6004 | 323 | 323 | 4.50% | 5.38% | 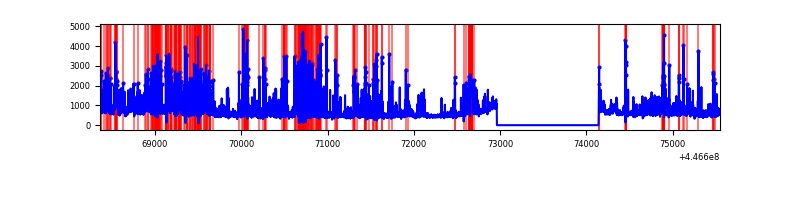 |
Top three noisy pixels from each quadrant. If the there are fewer than three noisy pixels in the level2.evt file, extra rows are filled as -1
| Pixel properties | Quadrant properties | ||||||
|---|---|---|---|---|---|---|---|
| Quadrant | DetID | PixID | Counts | Sigma | Mean | Median | Sigma |
| A | 10 | 83 | 2358567 | 16307.89 | 703 | 688 | 144.6 |
| A | 13 | 248 | 32771 | 221.9 | 703 | 688 | 144.6 |
| A | 15 | 174 | 10130 | 65.3 | 703 | 688 | 144.6 |
| B | 12 | 16 | 97396 | 690.67 | 708 | 687 | 140.0 |
| B | 5 | 171 | 74049 | 523.93 | 708 | 687 | 140.0 |
| B | 4 | 158 | 60198 | 425.01 | 708 | 687 | 140.0 |
| C | 14 | 254 | 219155 | 1318.11 | 702 | 706 | 165.7 |
| C | 12 | 2 | 29926 | 176.31 | 702 | 706 | 165.7 |
| C | 3 | 233 | 13366 | 76.39 | 702 | 706 | 165.7 |
| D | 1 | 52 | 1823097 | 10671.46 | 681 | 662 | 170.8 |
| D | 11 | 241 | 198254 | 1157.02 | 681 | 662 | 170.8 |
| D | 2 | 249 | 149046 | 868.88 | 681 | 662 | 170.8 |
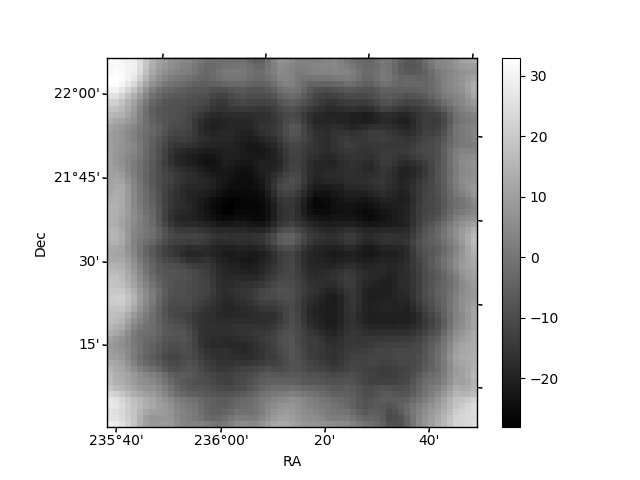
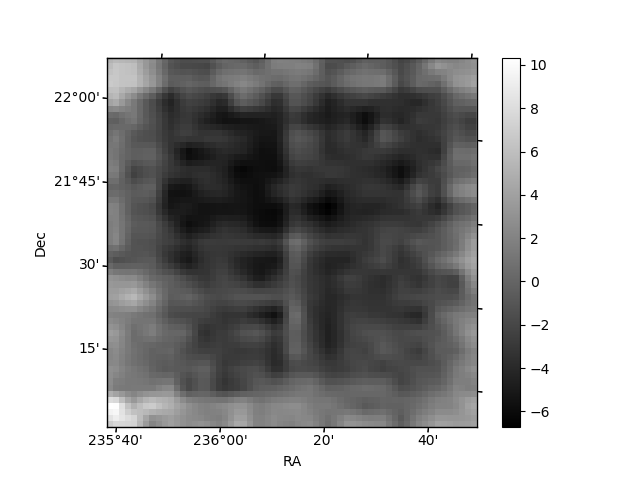
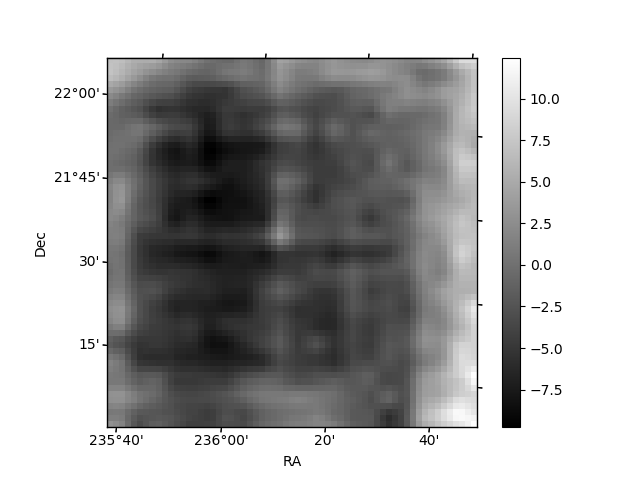
Histogram calculated using DETX and DETY for each event in the final _common_clean file
| Quadrant A | 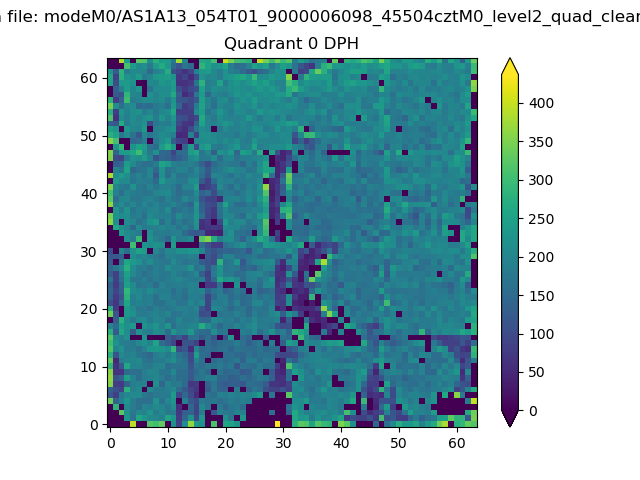 |
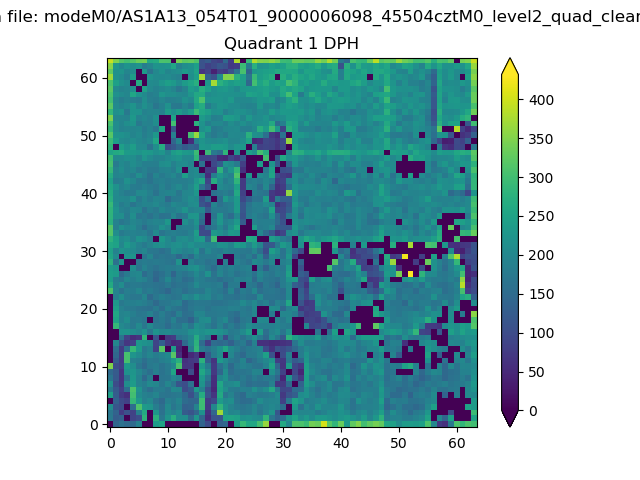 |
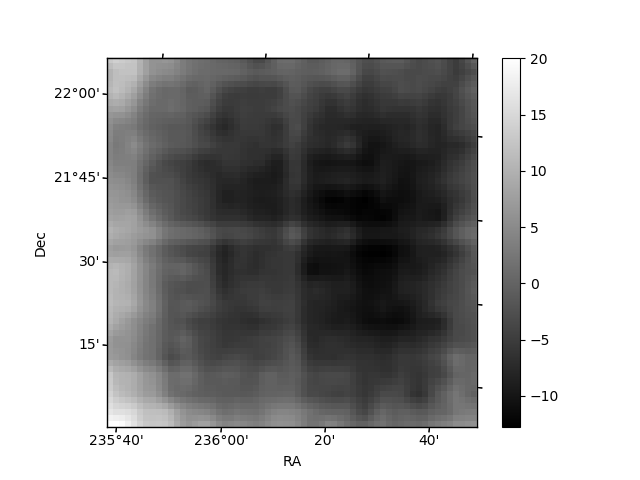
Quadrant B |
|---|---|---|---|
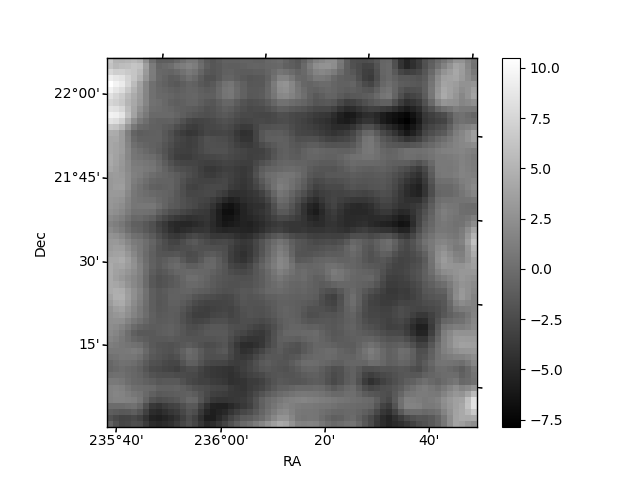
| Quadrant D | 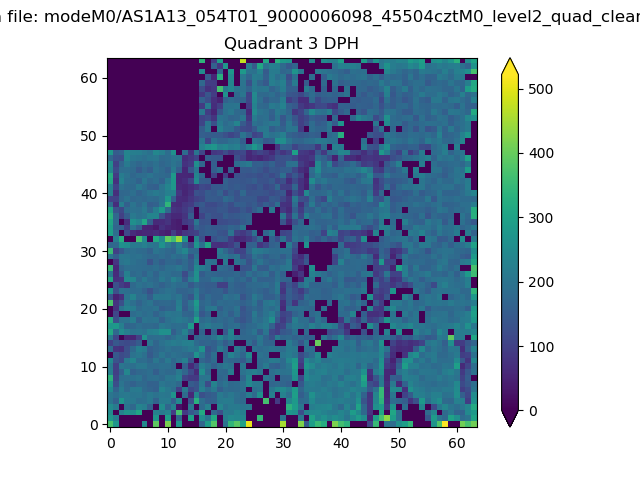 |
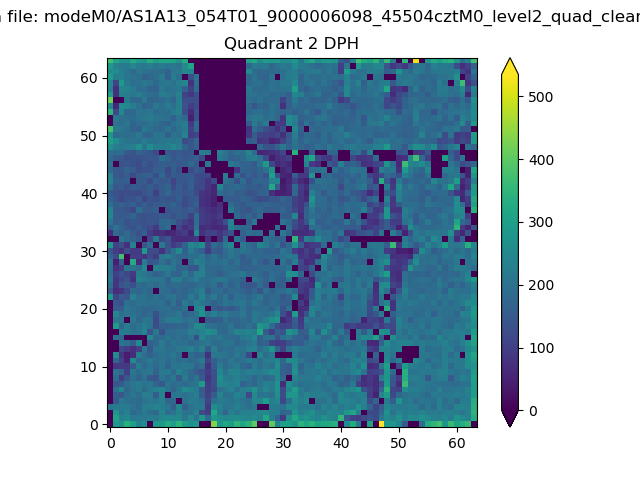 |
Quadrant C |
| Plot type | Count rate plots | Images |
|---|---|---|
| Comparison with Poisson distribution Blue bars denote a histogram of data divided into 1 sec bins. Red curve is a Poisson curve with rate = median count rate of data. |
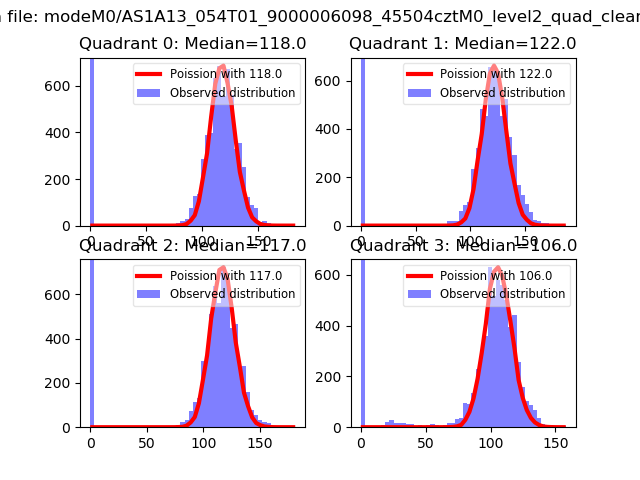 |
 |
| Quadrant-wise count rates Data is divided into 100 sec bins |
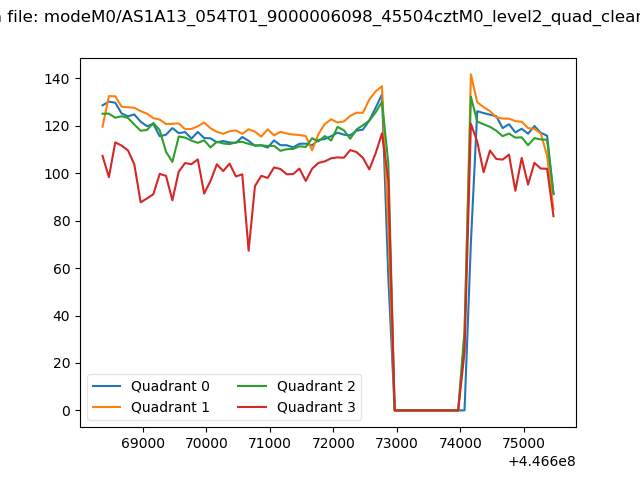 |
|
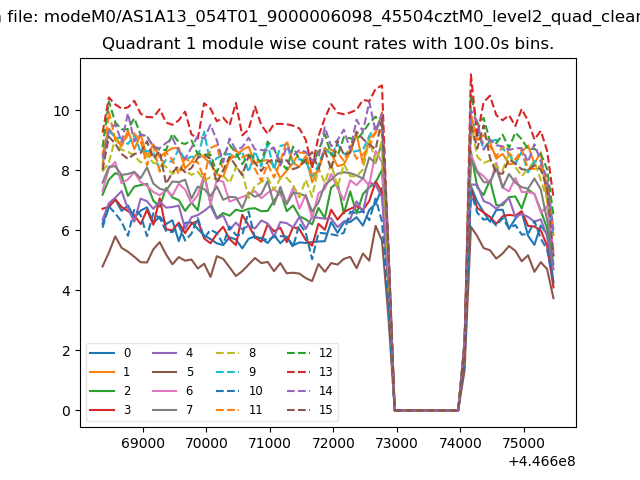
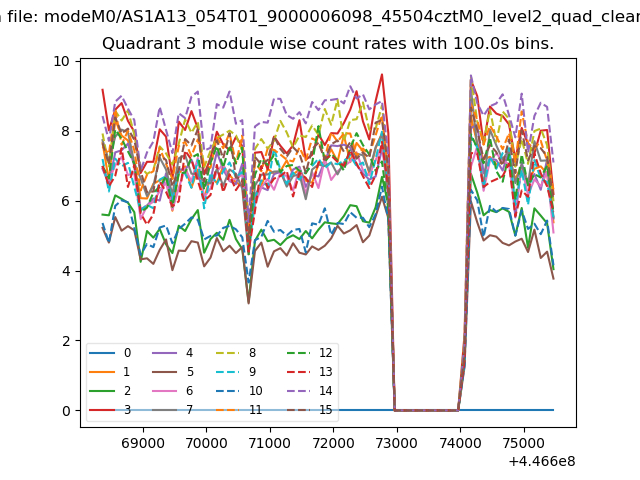
| Module-wise count rates for Quadrant A Data is divided into 100 sec bins |
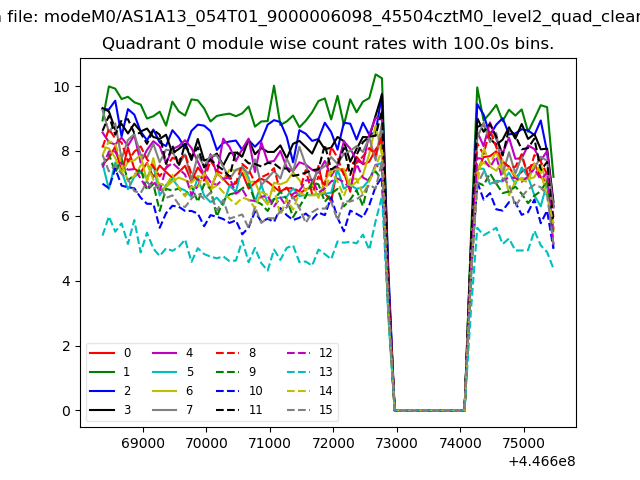 |
 |
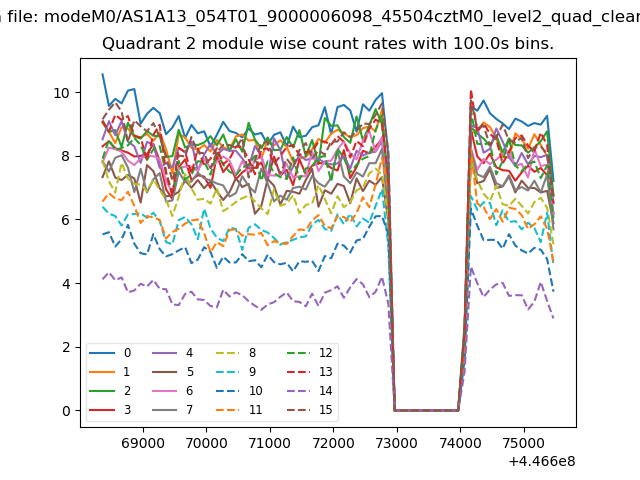
| Module-wise count rates for Quadrant B Data is divided into 100 sec bins |
 |
 |
| Module-wise count rates for Quadrant C Data is divided into 100 sec bins |
 |
 |
| Module-wise count rates for Quadrant D Data is divided into 100 sec bins |
 |
 |
| Parameter | Plot |
|---|---|
| CZT HV Monitor | 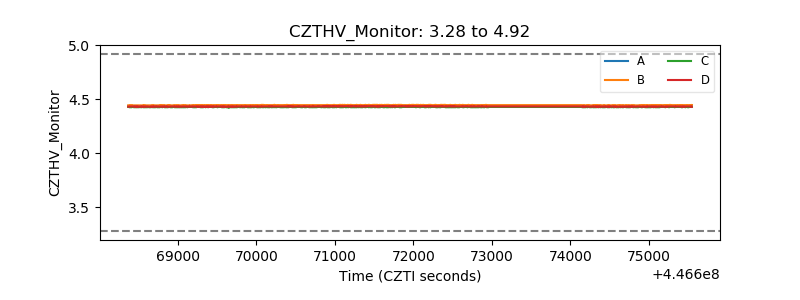 |
| D_VDD | 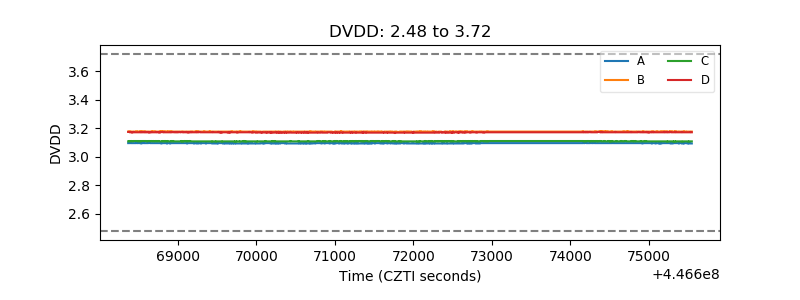 |
| Temperature 1 | 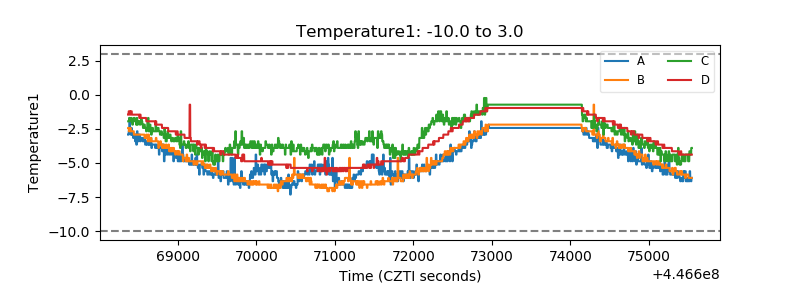 |
| Veto HV Monitor | 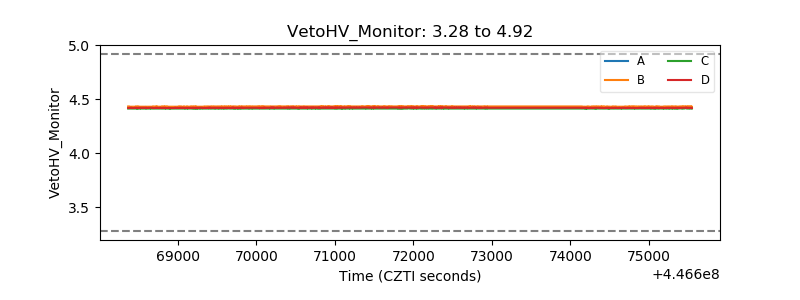 |
| Veto LLD | 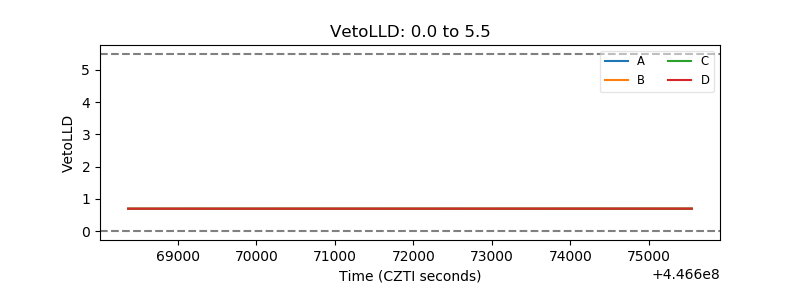 |
| Alpha Counter | 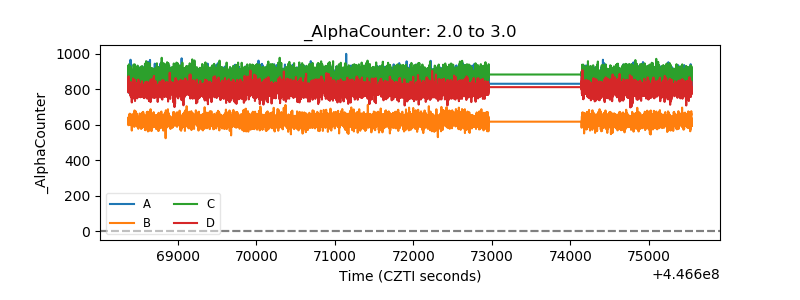 |
| _CPM_Rate | 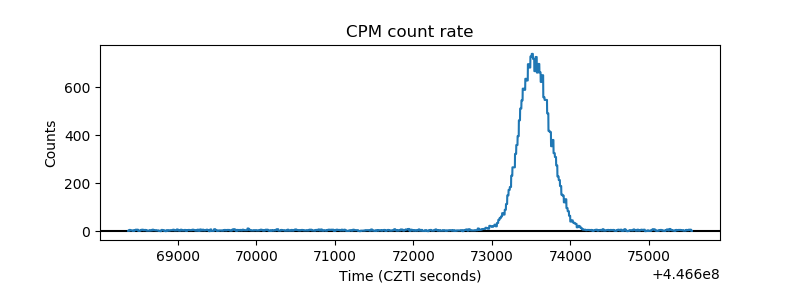 |
| CZT Counter | 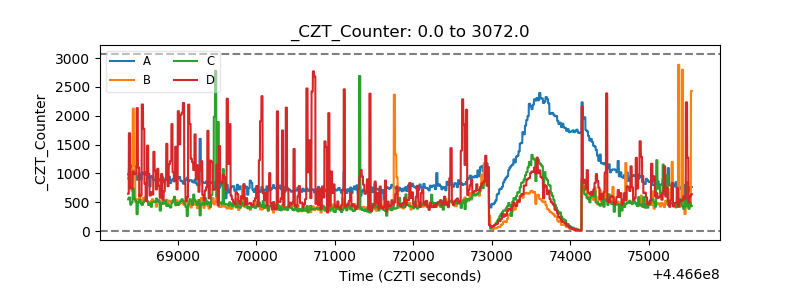 |
| +2.5 Volts monitor | 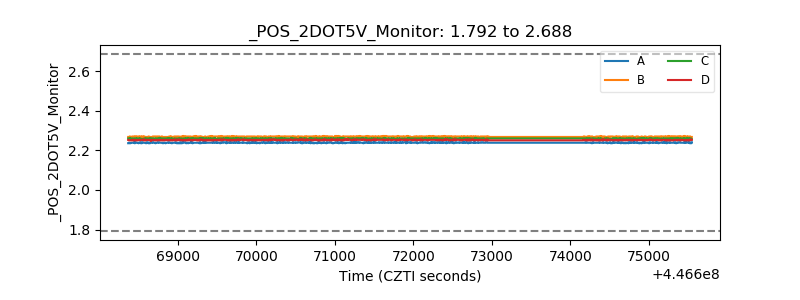 |
| +5 Volts monitor | 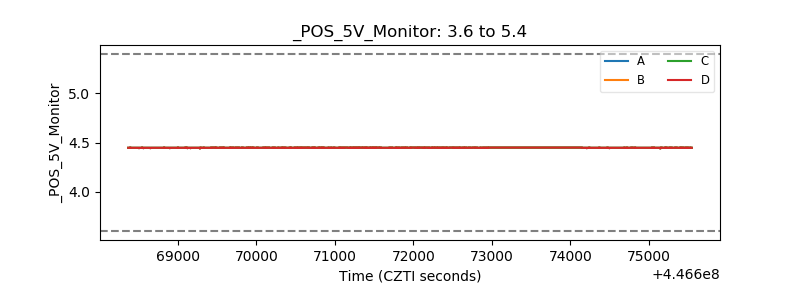 |
| _ROLL_ROT | 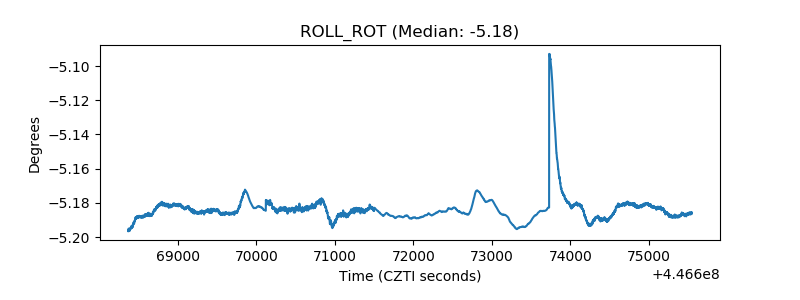 |
| _Roll_DEC | 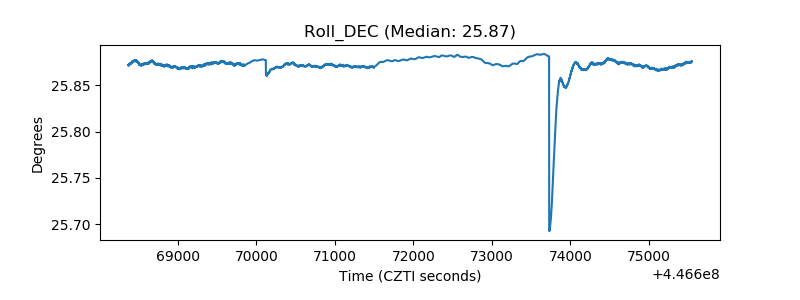 |
| _Roll_RA | 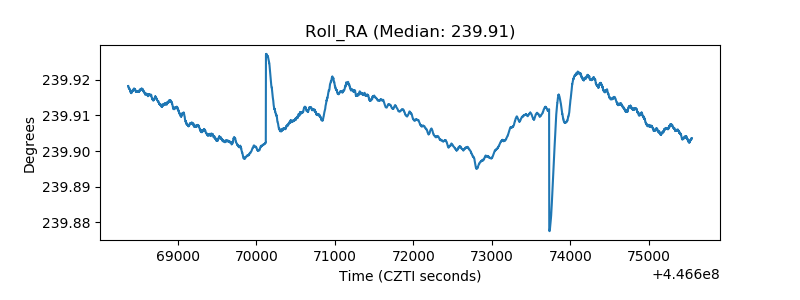 |
| Veto Counter | 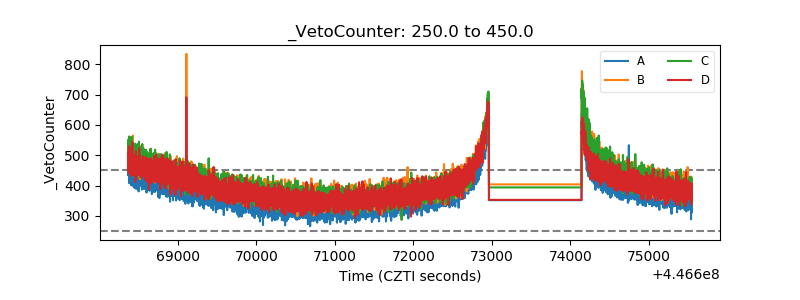 |