| Param | Original file | Final file |
|---|---|---|
| Filename | modeM0/AS1A13_054T01_9000006098_45505cztM0_level2.fits | modeM0/AS1A13_054T01_9000006098_45505cztM0_level2_quad_clean.evt |
| Size (bytes) | 452,416,320 | 110,574,720 |
| Size | 431.5 MB | 105.5 MB |
| Events in quadrant A | 5,570,495 | 733,585 |
| Events in quadrant B | 3,196,459 | 767,627 |
| Events in quadrant C | 3,218,224 | 733,980 |
| Events in quadrant D | 4,254,654 | 657,640 |
| Mode M0 | |||
|---|---|---|---|
| Quadrant | BADHDUFLAG | Total packets | Discarded packets |
| A | 0 | 21402 | 1 |
| B | 0 | 14016 | 1 |
| C | 0 | 14084 | 1 |
| D | 0 | 17086 | 1 |
| Mode SS | |||
|---|---|---|---|
| Quadrant | BADHDUFLAG | Total packets | Discarded packets |
| A | 0 | 132 | 0 |
| B | 0 | 132 | 0 |
| C | 0 | 132 | 0 |
| D | 0 | 132 | 0 |
| Mode M9 | |||
|---|---|---|---|
| Quadrant | BADHDUFLAG | Total packets | Discarded packets |
| A | 0 | 11 | 0 |
| B | 0 | 11 | 0 |
| C | 0 | 11 | 0 |
| D | 0 | 11 | 0 |
| Quadrant | Total seconds | Saturated seconds | Saturation percentage |
|---|---|---|---|
| A | 6532 | 178 | 2.725046% |
| B | 6533 | 100 | 1.530690% |
| C | 6533 | 61 | 0.933721% |
| D | 6533 | 195 | 2.984846% |
Noise dominated data is calculated using 1-second bins in cleaned event files. If a bin has >2000 counts, and if more than 50% of those come from <1% of pixels, then it is considered to be noise-dominated and hence unusable.
| Quadrant | # 1 sec bins | Bins with >0 counts | Bins with >2000 counts | High rate bins dominated by noise | Noise dominated (total time) | Noise dominated (detector-on time) | Marked lightcurve |
|---|---|---|---|---|---|---|---|
| A | 7552 | 6533 | 7 | 7 | 0.09% | 0.11% | 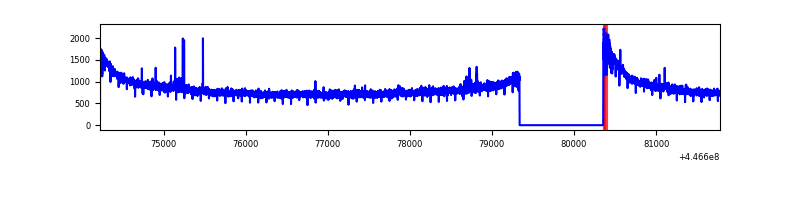 |
| B | 7553 | 6534 | 33 | 33 | 0.44% | 0.51% | 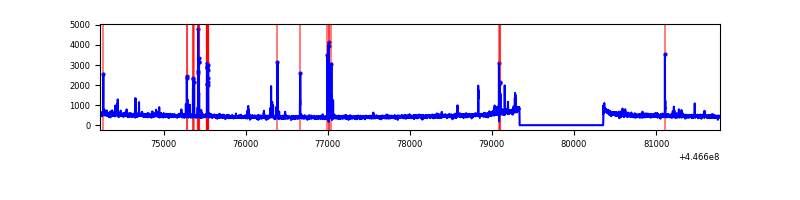 |
| C | 7553 | 6534 | 29 | 29 | 0.38% | 0.44% | 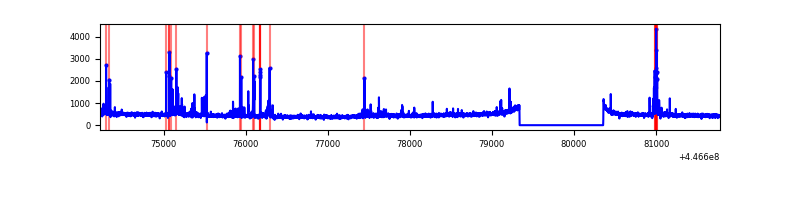 |
| D | 7553 | 6534 | 125 | 125 | 1.65% | 1.91% | 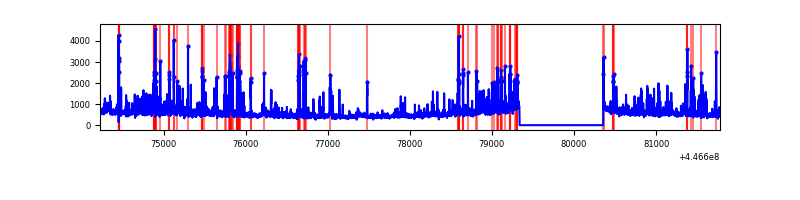 |
Top three noisy pixels from each quadrant. If the there are fewer than three noisy pixels in the level2.evt file, extra rows are filled as -1
| Pixel properties | Quadrant properties | ||||||
|---|---|---|---|---|---|---|---|
| Quadrant | DetID | PixID | Counts | Sigma | Mean | Median | Sigma |
| A | 10 | 83 | 2655901 | 17074.81 | 745 | 729 | 155.5 |
| A | 13 | 248 | 18140 | 111.97 | 745 | 729 | 155.5 |
| A | 2 | 79 | 10509 | 62.89 | 745 | 729 | 155.5 |
| B | 5 | 172 | 72790 | 483.55 | 752 | 728 | 149.0 |
| B | 5 | 171 | 67018 | 444.82 | 752 | 728 | 149.0 |
| B | 0 | 186 | 22040 | 143.01 | 752 | 728 | 149.0 |
| C | 14 | 254 | 230939 | 1316.81 | 745 | 748 | 174.8 |
| C | 3 | 233 | 47397 | 266.86 | 745 | 748 | 174.8 |
| C | 12 | 2 | 11186 | 59.71 | 745 | 748 | 174.8 |
| D | 1 | 52 | 373671 | 2048.22 | 731 | 710 | 182.1 |
| D | 11 | 241 | 315968 | 1731.33 | 731 | 710 | 182.1 |
| D | 2 | 249 | 306765 | 1680.78 | 731 | 710 | 182.1 |
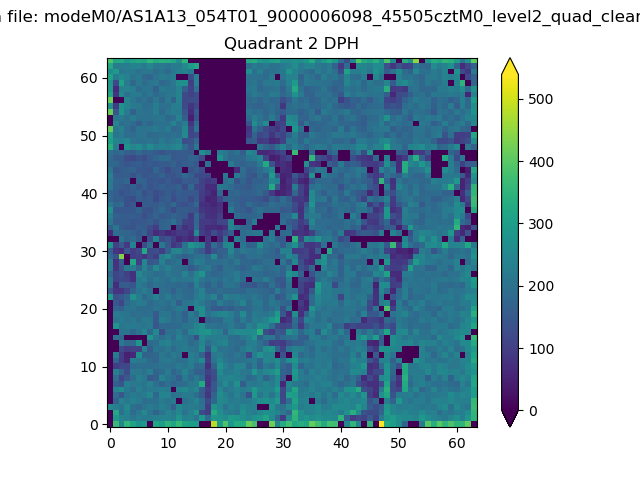
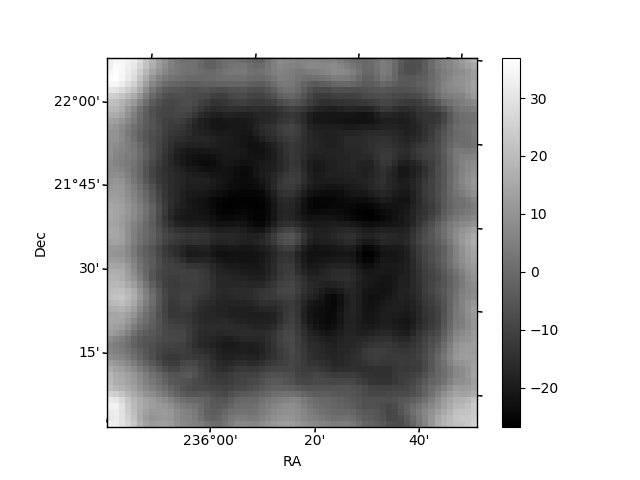
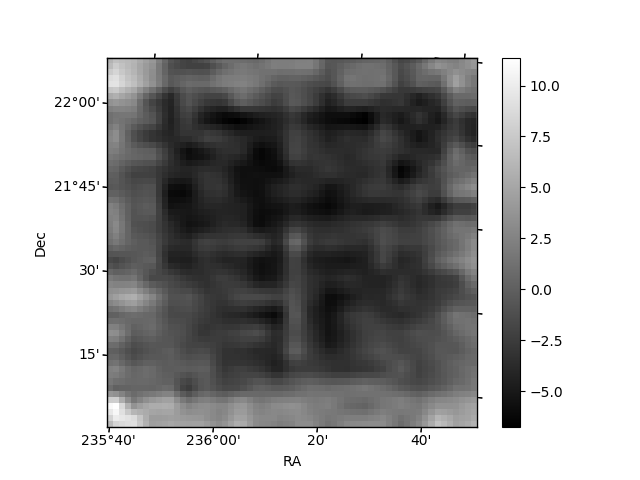
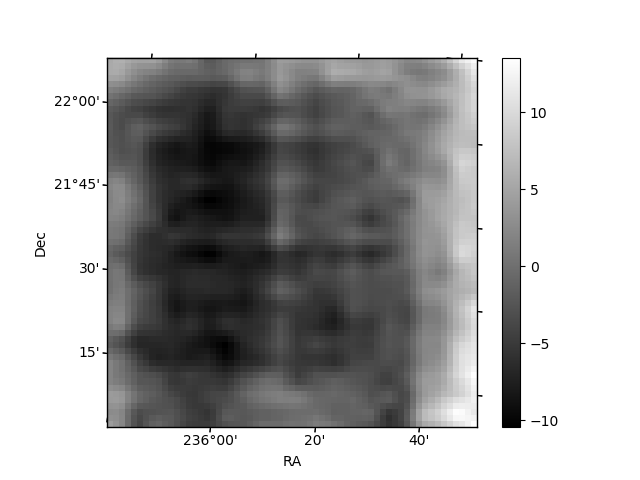
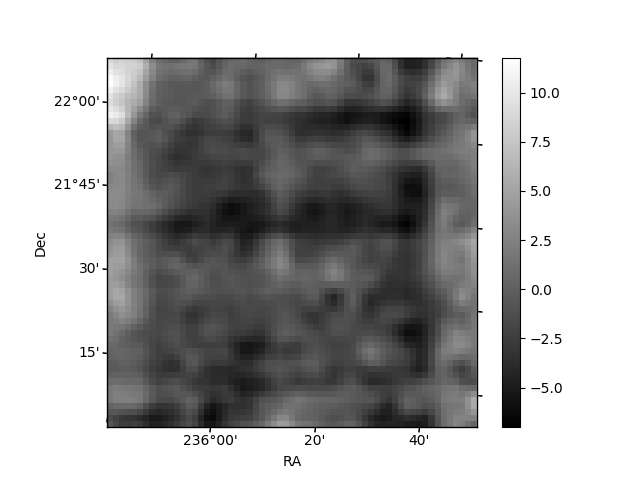
Histogram calculated using DETX and DETY for each event in the final _common_clean file
| Quadrant A | 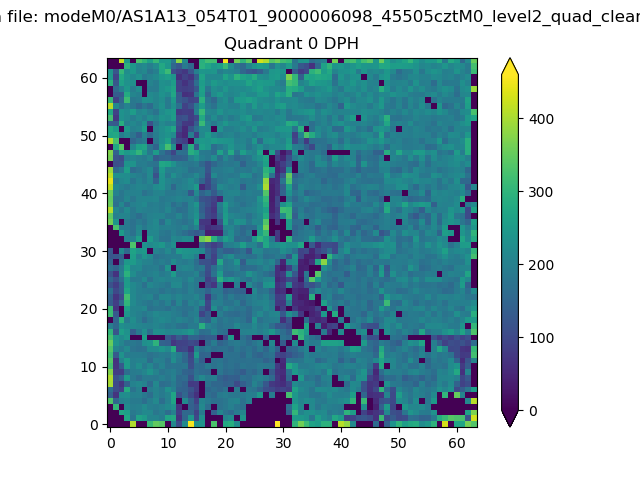 |
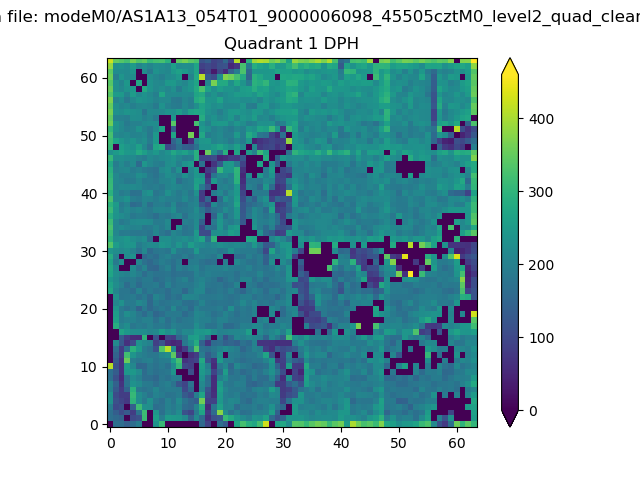 |
Quadrant B |
|---|---|---|---|
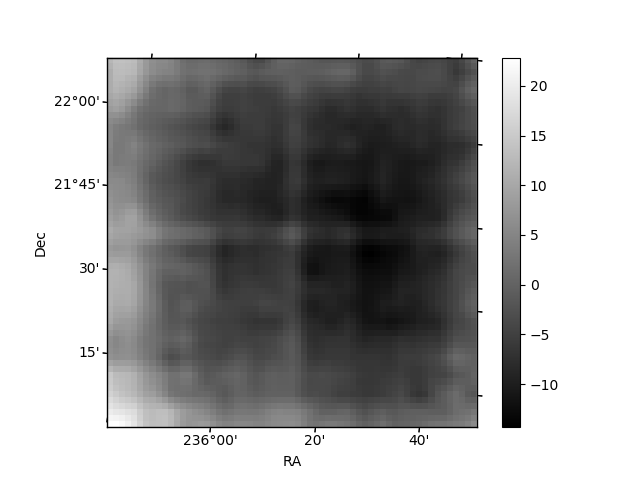
| Quadrant D | 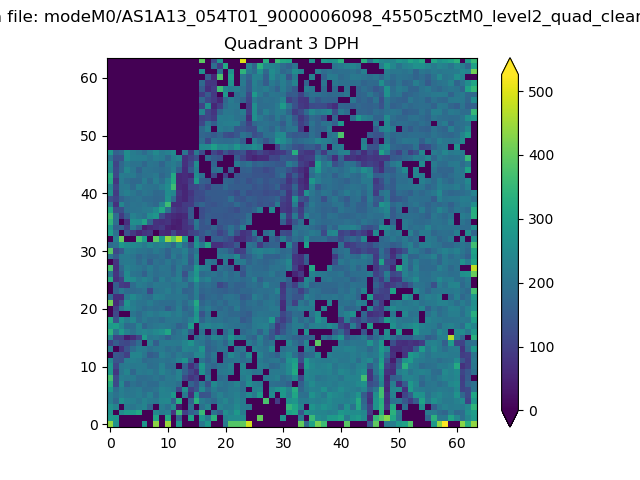 |
 |
Quadrant C |
| Plot type | Count rate plots | Images |
|---|---|---|
| Comparison with Poisson distribution Blue bars denote a histogram of data divided into 1 sec bins. Red curve is a Poisson curve with rate = median count rate of data. |
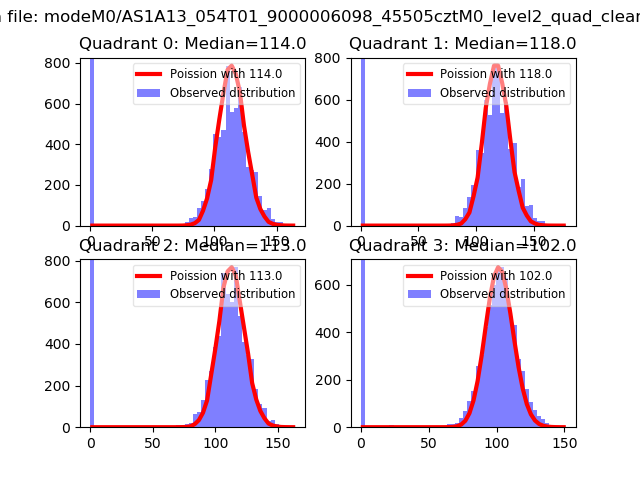 |
 |
| Quadrant-wise count rates Data is divided into 100 sec bins |
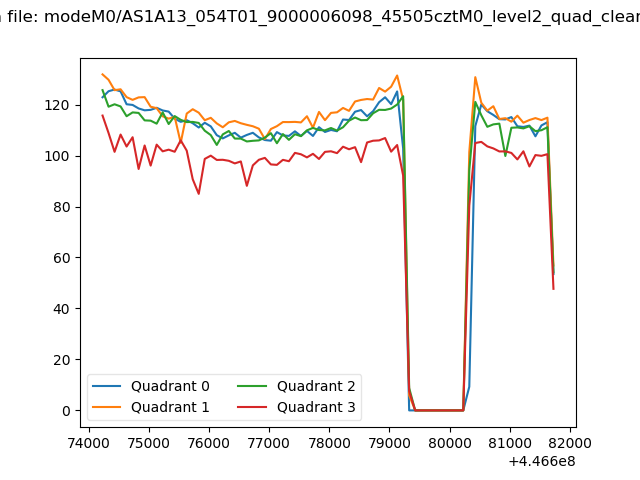 |
|
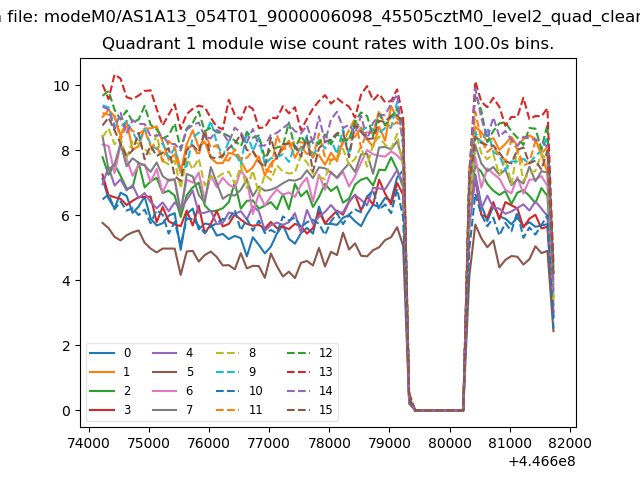
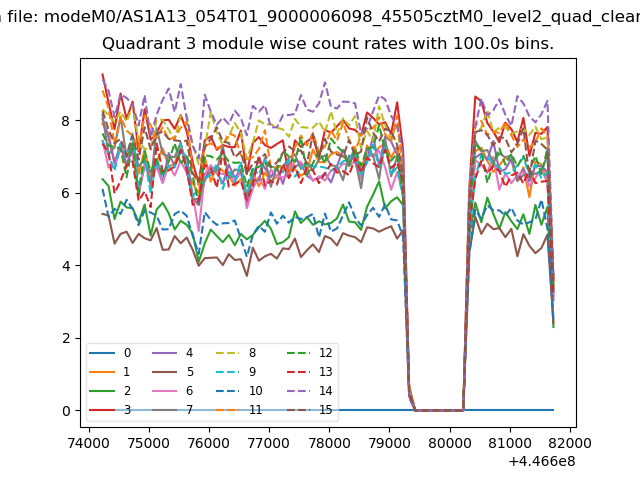
| Module-wise count rates for Quadrant A Data is divided into 100 sec bins |
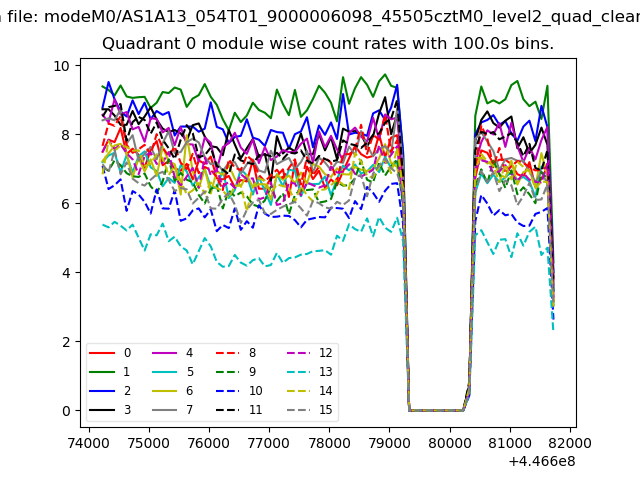 |
 |
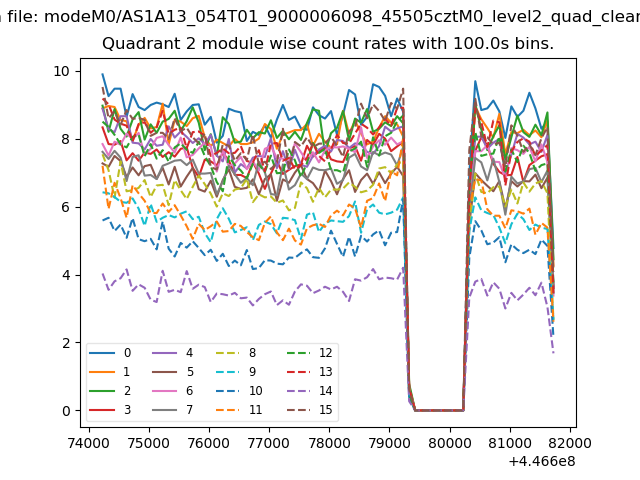
| Module-wise count rates for Quadrant B Data is divided into 100 sec bins |
 |
 |
| Module-wise count rates for Quadrant C Data is divided into 100 sec bins |
 |
 |
| Module-wise count rates for Quadrant D Data is divided into 100 sec bins |
 |
 |
| Parameter | Plot |
|---|---|
| CZT HV Monitor | 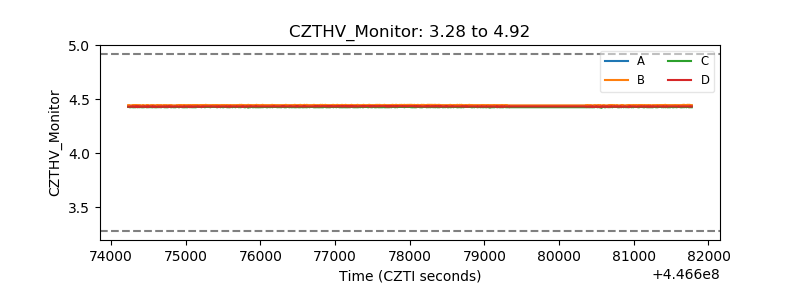 |
| D_VDD | 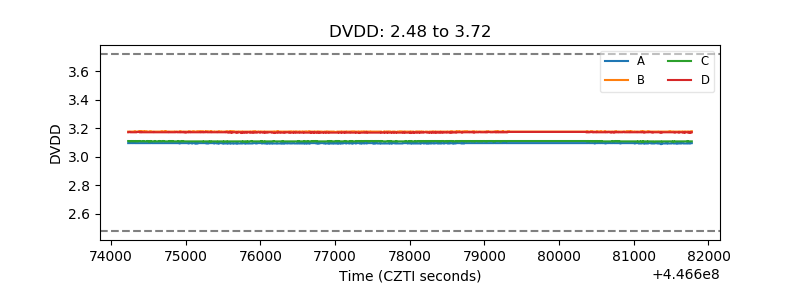 |
| Temperature 1 | 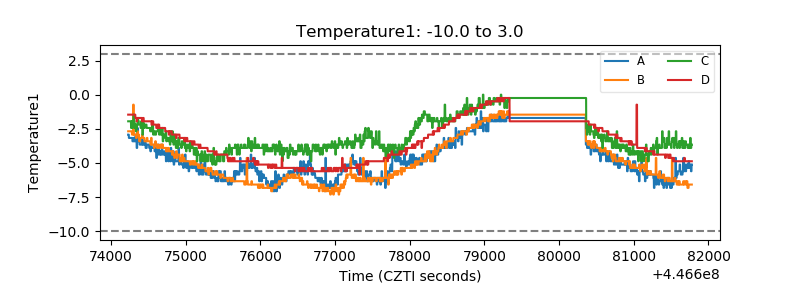 |
| Veto HV Monitor | 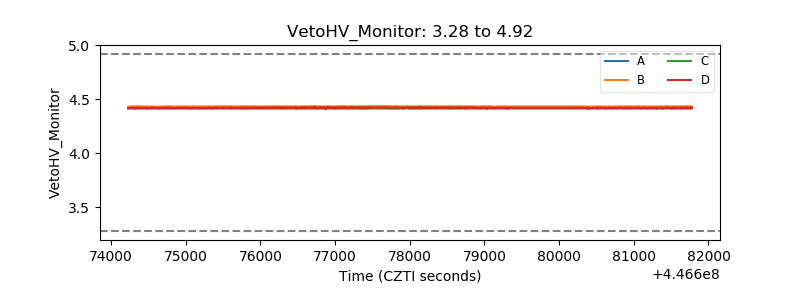 |
| Veto LLD | 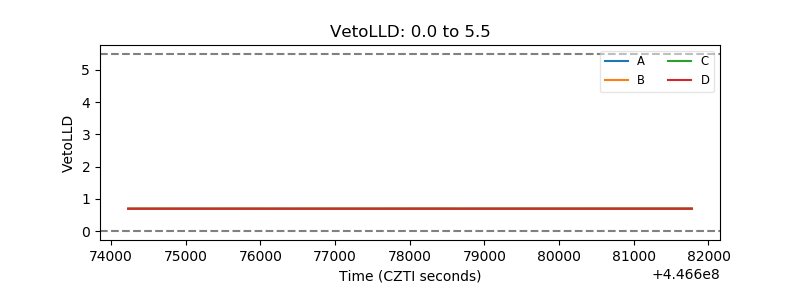 |
| Alpha Counter | 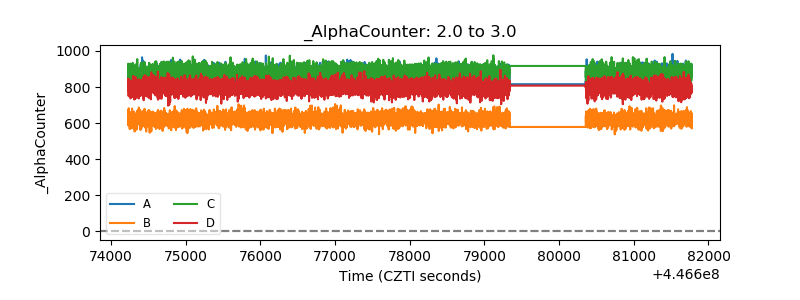 |
| _CPM_Rate | 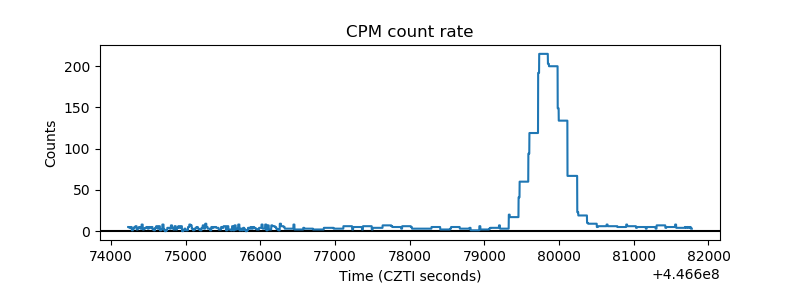 |
| CZT Counter | 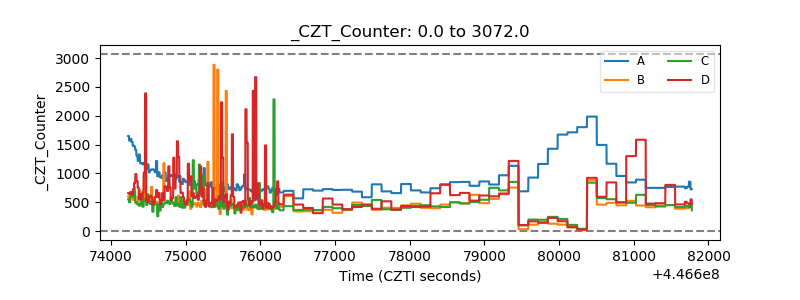 |
| +2.5 Volts monitor | 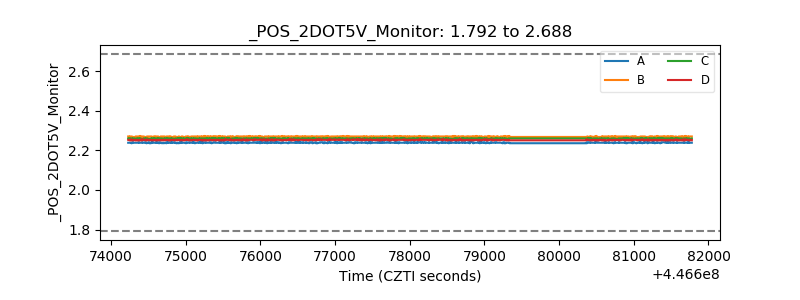 |
| +5 Volts monitor | 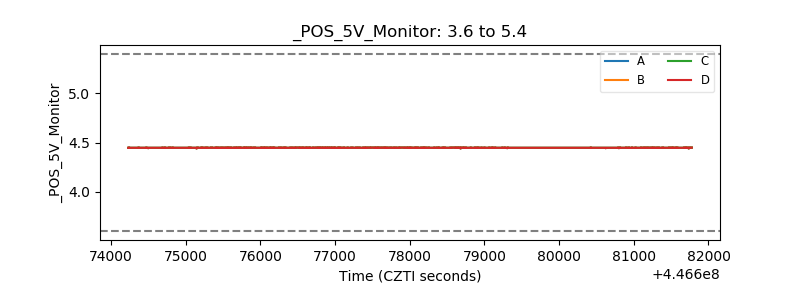 |
| _ROLL_ROT | 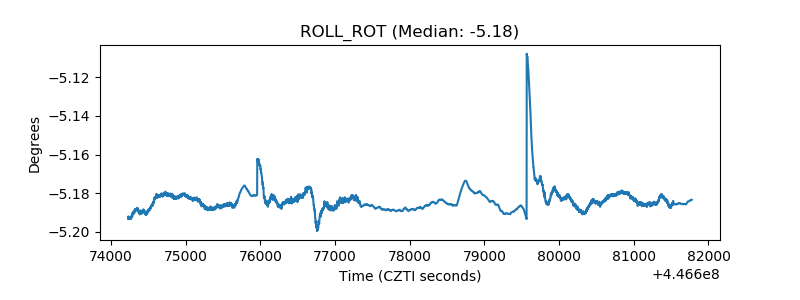 |
| _Roll_DEC | 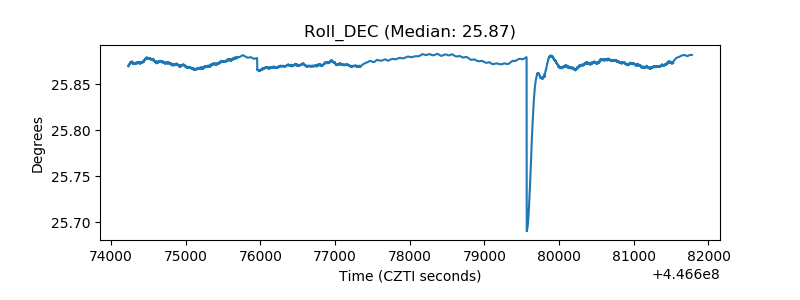 |
| _Roll_RA | 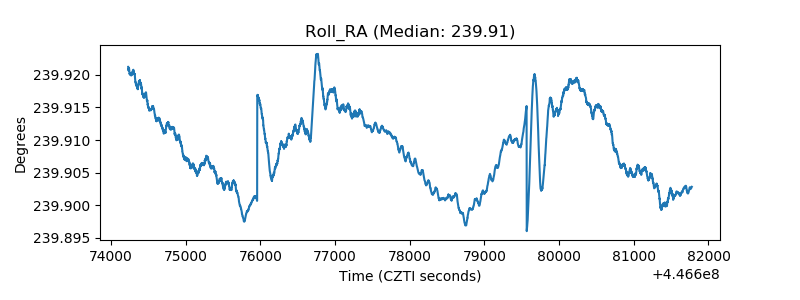 |
| Veto Counter | 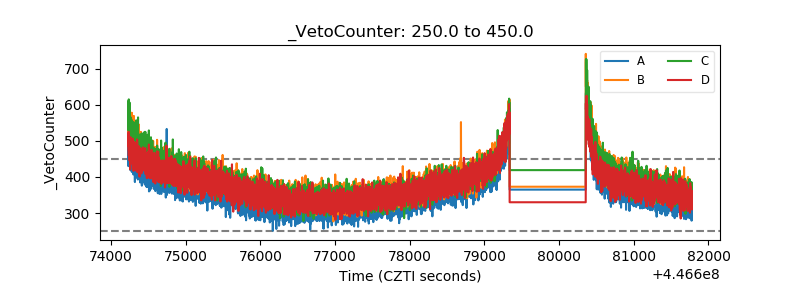 |