| Param | Original file | Final file |
|---|---|---|
| Filename | modeM0/AS1A13_054T01_9000006098_45506cztM0_level2.fits | modeM0/AS1A13_054T01_9000006098_45506cztM0_level2_quad_clean.evt |
| Size (bytes) | 483,563,520 | 115,292,160 |
| Size | 461.2 MB | 110.0 MB |
| Events in quadrant A | 5,900,600 | 753,388 |
| Events in quadrant B | 3,428,159 | 801,197 |
| Events in quadrant C | 3,587,406 | 757,372 |
| Events in quadrant D | 4,439,388 | 690,768 |
| Mode M0 | |||
|---|---|---|---|
| Quadrant | BADHDUFLAG | Total packets | Discarded packets |
| A | 0 | 22770 | 2 |
| B | 0 | 15122 | 2 |
| C | 0 | 15785 | 2 |
| D | 0 | 18120 | 2 |
| Mode SS | |||
|---|---|---|---|
| Quadrant | BADHDUFLAG | Total packets | Discarded packets |
| A | 0 | 142 | 0 |
| B | 0 | 142 | 0 |
| C | 0 | 142 | 0 |
| D | 0 | 142 | 0 |
| Mode M9 | |||
|---|---|---|---|
| Quadrant | BADHDUFLAG | Total packets | Discarded packets |
| A | 0 | 9 | 0 |
| B | 0 | 10 | 0 |
| C | 0 | 10 | 0 |
| D | 0 | 10 | 0 |
| Quadrant | Total seconds | Saturated seconds | Saturation percentage |
|---|---|---|---|
| A | 7011 | 260 | 3.708458% |
| B | 7011 | 112 | 1.597490% |
| C | 7011 | 169 | 2.410498% |
| D | 7011 | 155 | 2.210812% |
Noise dominated data is calculated using 1-second bins in cleaned event files. If a bin has >2000 counts, and if more than 50% of those come from <1% of pixels, then it is considered to be noise-dominated and hence unusable.
| Quadrant | # 1 sec bins | Bins with >0 counts | Bins with >2000 counts | High rate bins dominated by noise | Noise dominated (total time) | Noise dominated (detector-on time) | Marked lightcurve |
|---|---|---|---|---|---|---|---|
| A | 7651 | 7013 | 14 | 14 | 0.18% | 0.20% | 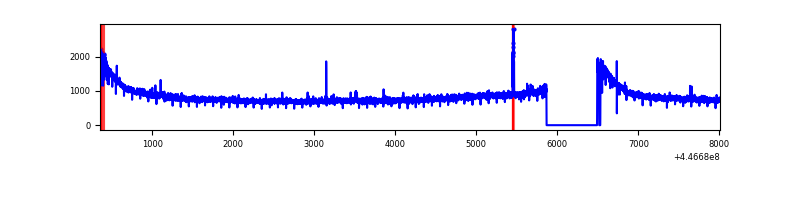 |
| B | 7651 | 7013 | 11 | 11 | 0.14% | 0.16% | 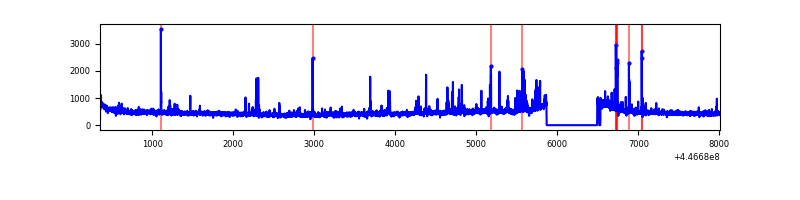 |
| C | 7651 | 7012 | 100 | 100 | 1.31% | 1.43% | 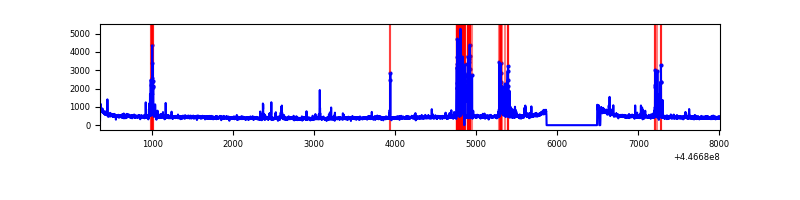 |
| D | 7651 | 7013 | 87 | 87 | 1.14% | 1.24% | 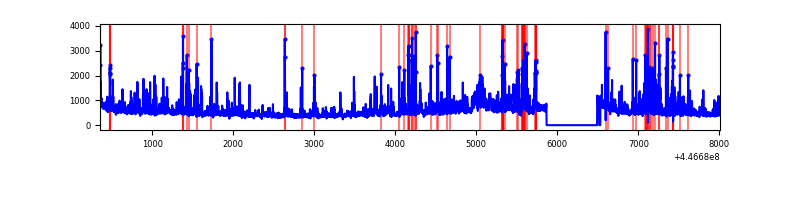 |
Top three noisy pixels from each quadrant. If the there are fewer than three noisy pixels in the level2.evt file, extra rows are filled as -1
| Pixel properties | Quadrant properties | ||||||
|---|---|---|---|---|---|---|---|
| Quadrant | DetID | PixID | Counts | Sigma | Mean | Median | Sigma |
| A | 10 | 83 | 2800022 | 16964.26 | 789 | 773 | 165.0 |
| A | 13 | 248 | 23736 | 139.16 | 789 | 773 | 165.0 |
| A | 2 | 79 | 14890 | 85.55 | 789 | 773 | 165.0 |
| B | 5 | 172 | 124218 | 776.48 | 802 | 778 | 159.0 |
| B | 3 | 112 | 56775 | 352.24 | 802 | 778 | 159.0 |
| B | 4 | 170 | 24562 | 149.61 | 802 | 778 | 159.0 |
| C | 14 | 254 | 476806 | 2573.32 | 785 | 788 | 185.0 |
| C | 12 | 2 | 15402 | 79.0 | 785 | 788 | 185.0 |
| C | 10 | 20 | 13206 | 67.13 | 785 | 788 | 185.0 |
| D | 2 | 249 | 382220 | 1949.5 | 777 | 757 | 195.7 |
| D | 11 | 241 | 375181 | 1913.53 | 777 | 757 | 195.7 |
| D | 1 | 52 | 356062 | 1815.82 | 777 | 757 | 195.7 |
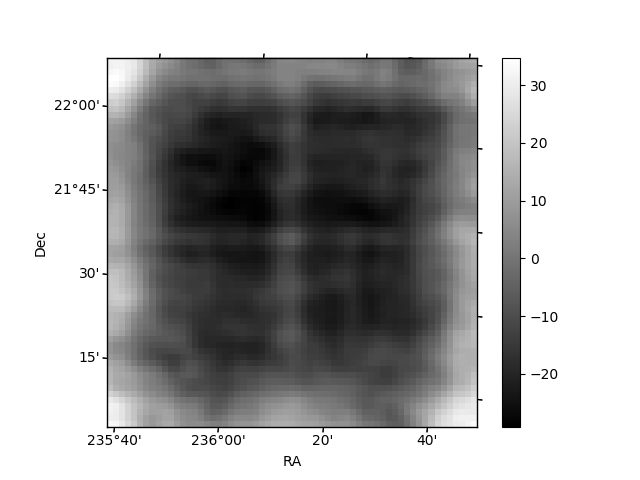
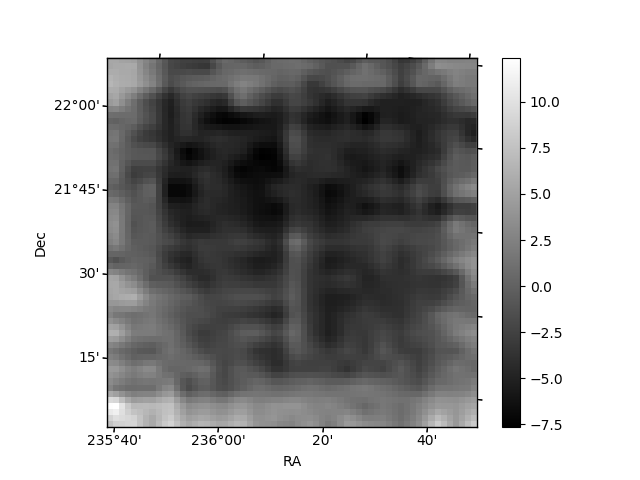
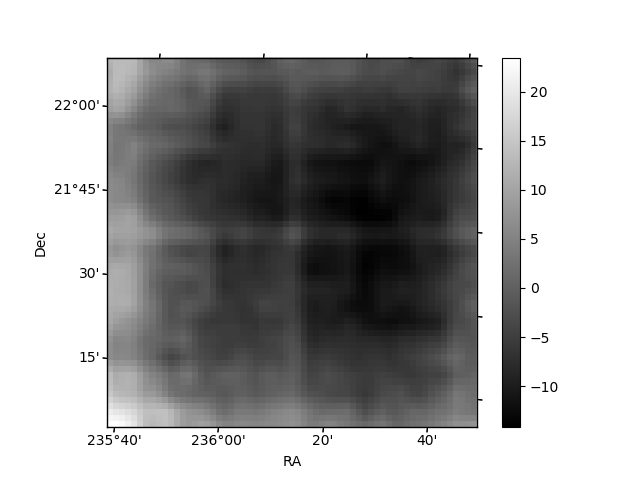
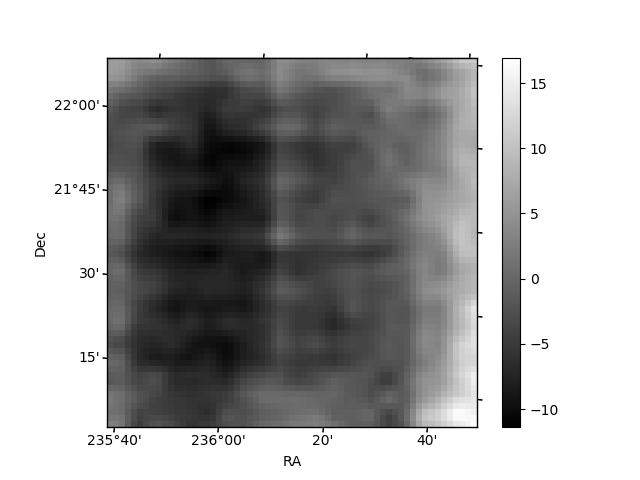
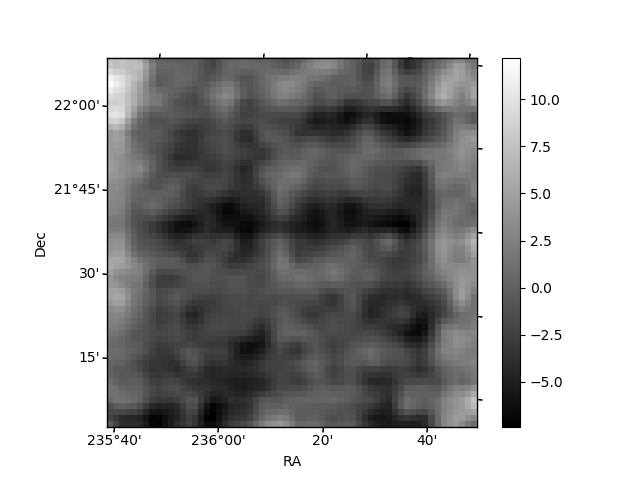
Histogram calculated using DETX and DETY for each event in the final _common_clean file
| Quadrant A | 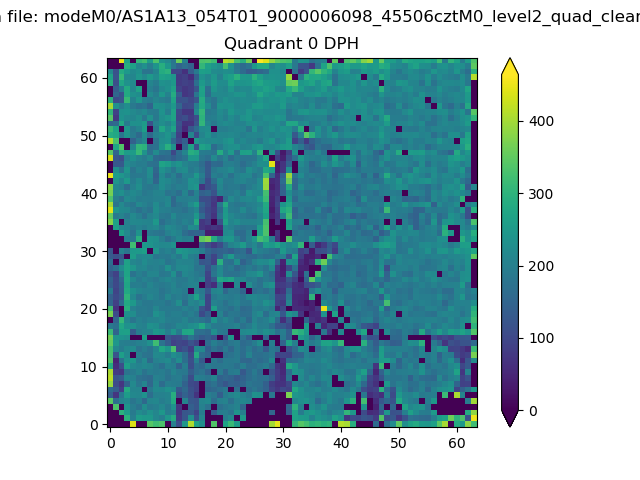 |
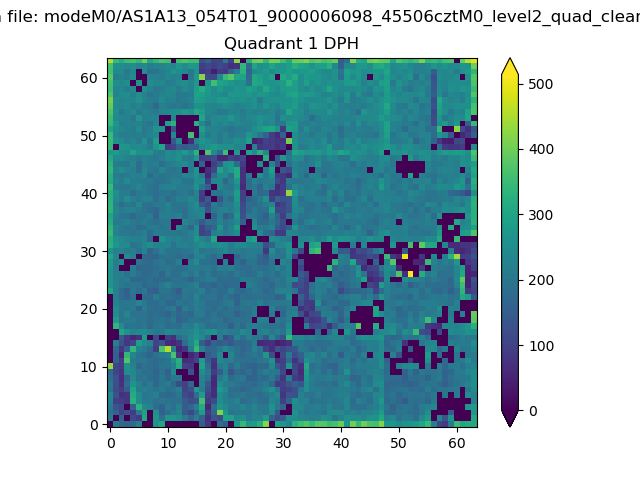 |
Quadrant B |
|---|---|---|---|
| Quadrant D | 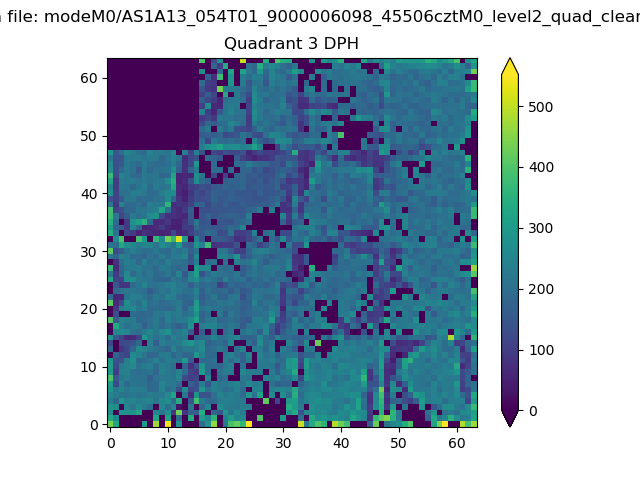 |
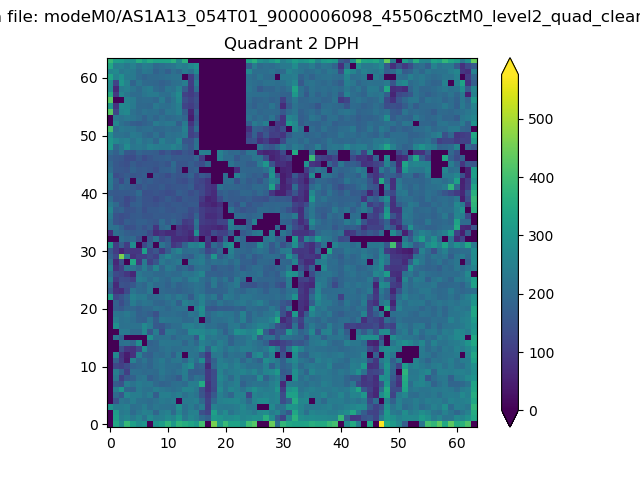 |
Quadrant C |
| Plot type | Count rate plots | Images |
|---|---|---|
| Comparison with Poisson distribution Blue bars denote a histogram of data divided into 1 sec bins. Red curve is a Poisson curve with rate = median count rate of data. |
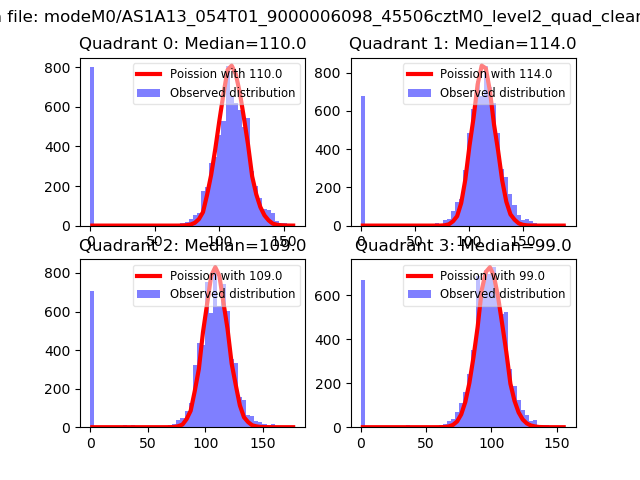 |
 |
| Quadrant-wise count rates Data is divided into 100 sec bins |
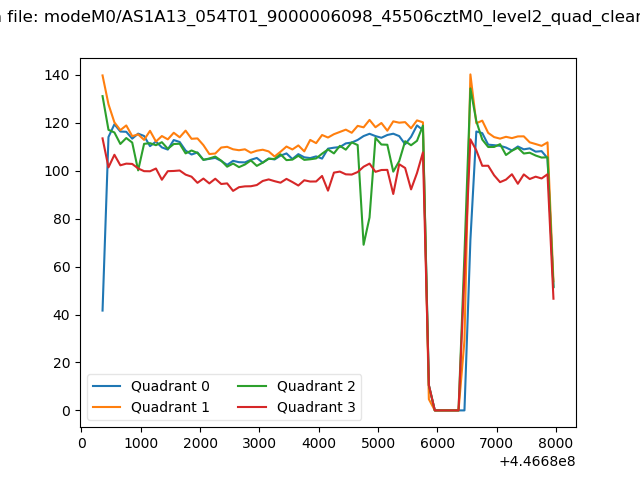 |
|
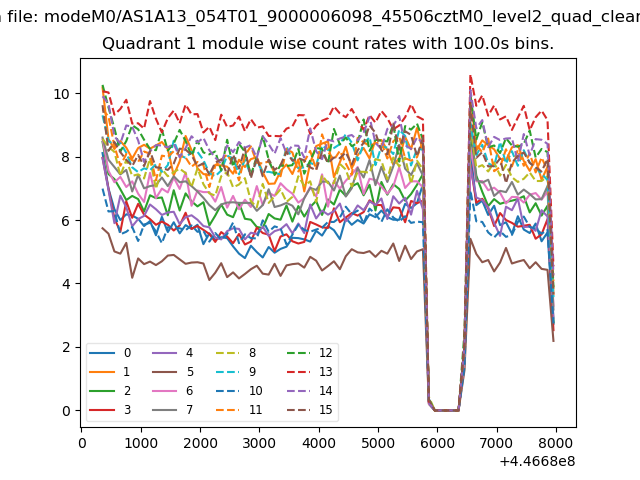
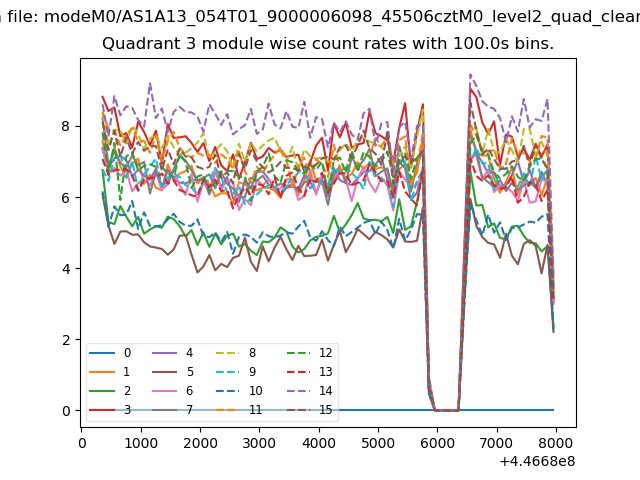
| Module-wise count rates for Quadrant A Data is divided into 100 sec bins |
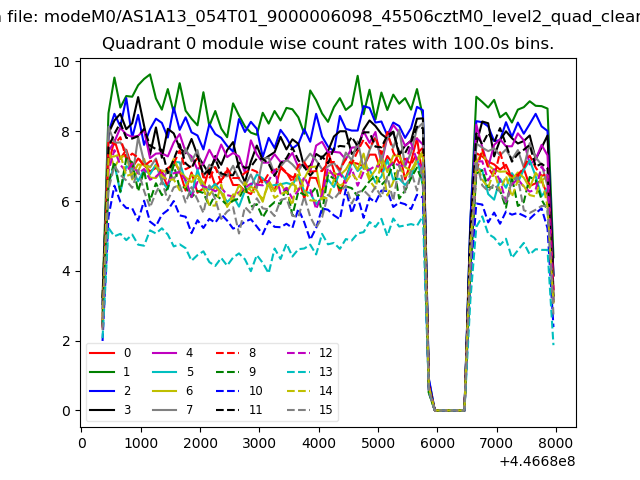 |
 |
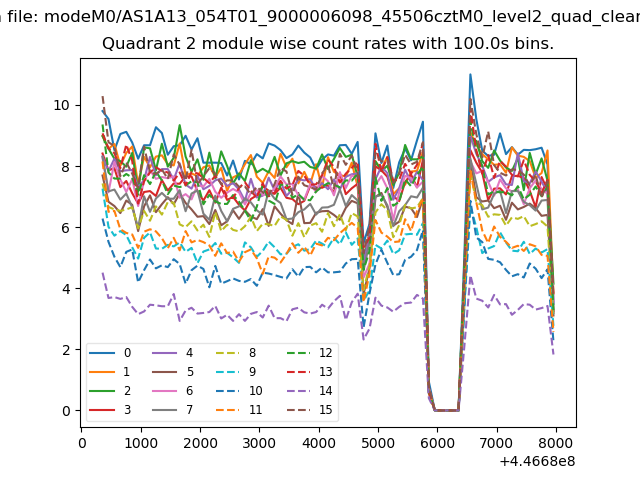
| Module-wise count rates for Quadrant B Data is divided into 100 sec bins |
 |
 |
| Module-wise count rates for Quadrant C Data is divided into 100 sec bins |
 |
 |
| Module-wise count rates for Quadrant D Data is divided into 100 sec bins |
 |
 |
| Parameter | Plot |
|---|---|
| CZT HV Monitor | 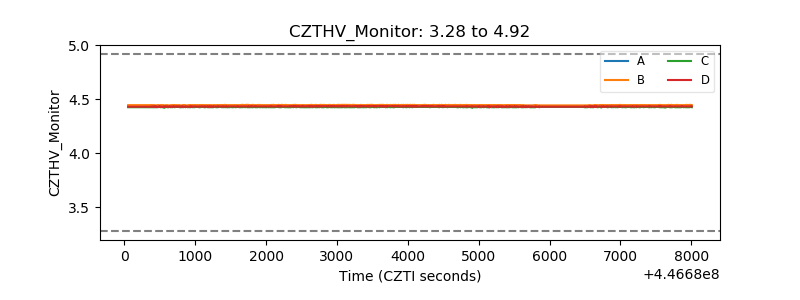 |
| D_VDD | 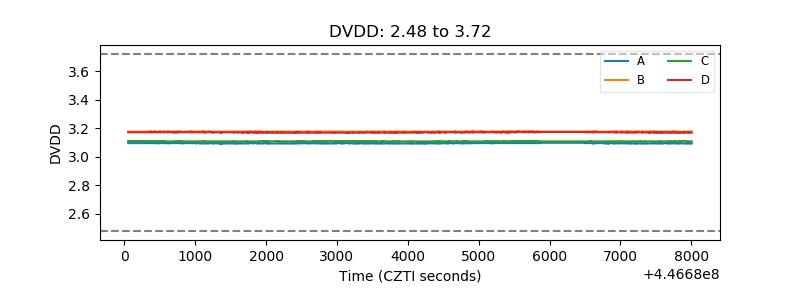 |
| Temperature 1 | 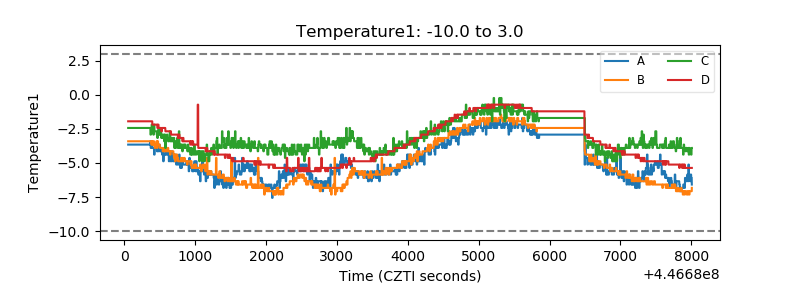 |
| Veto HV Monitor | 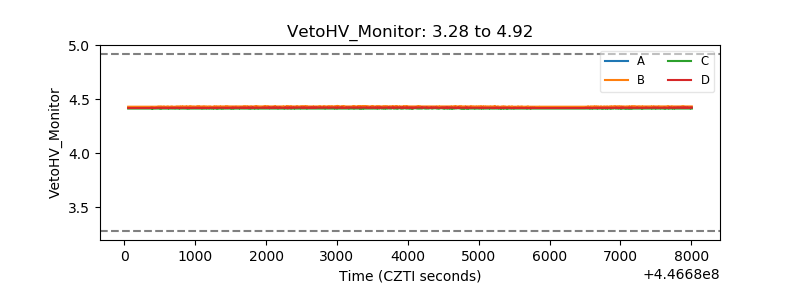 |
| Veto LLD | 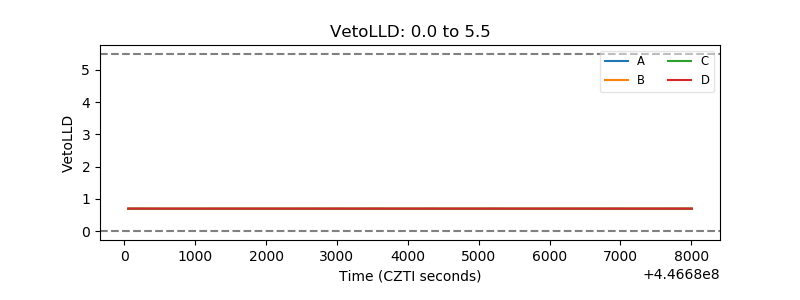 |
| Alpha Counter | 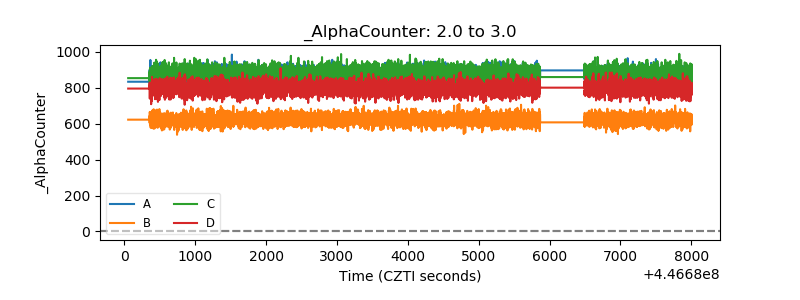 |
| _CPM_Rate | 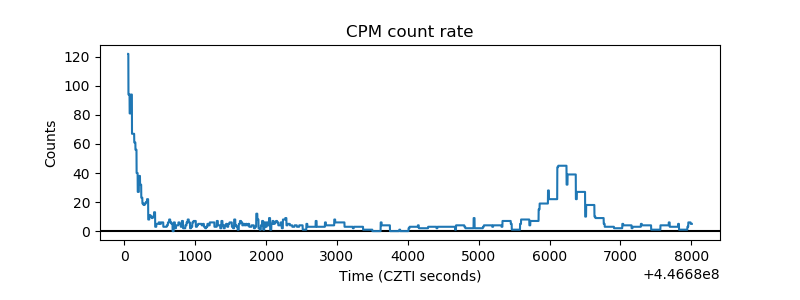 |
| CZT Counter | 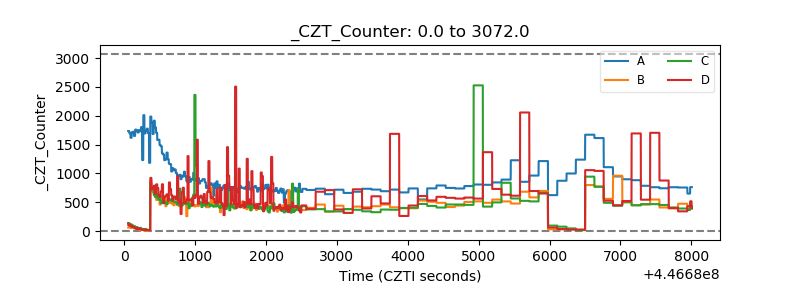 |
| +2.5 Volts monitor | 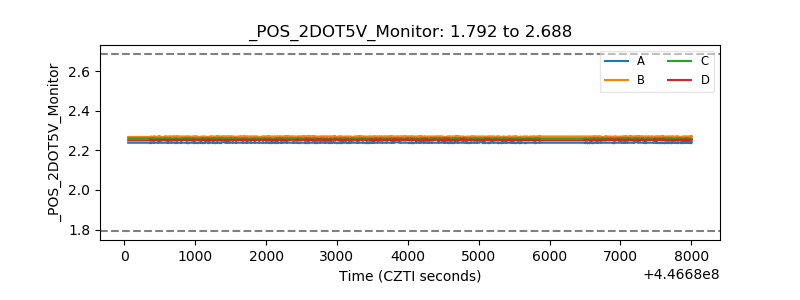 |
| +5 Volts monitor | 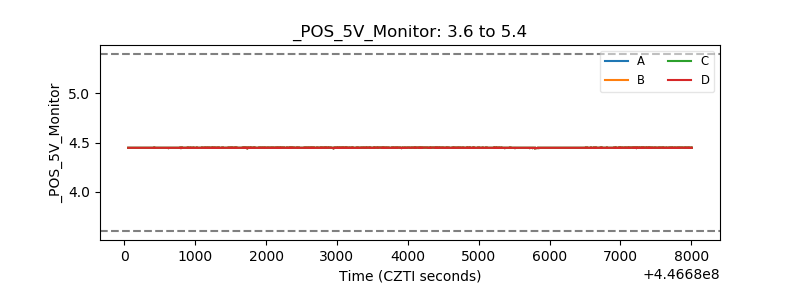 |
| _ROLL_ROT | 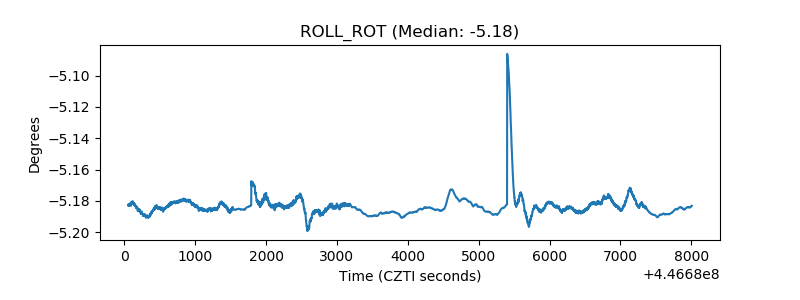 |
| _Roll_DEC | 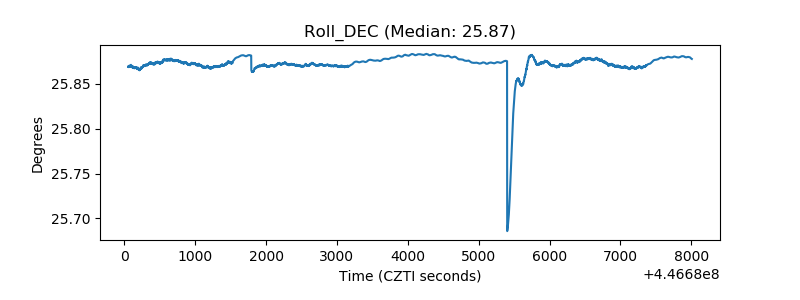 |
| _Roll_RA | 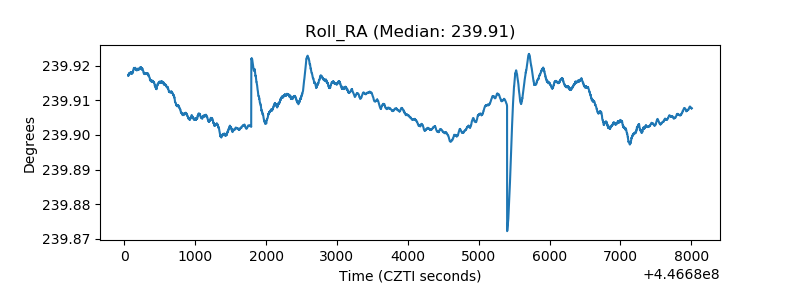 |
| Veto Counter | 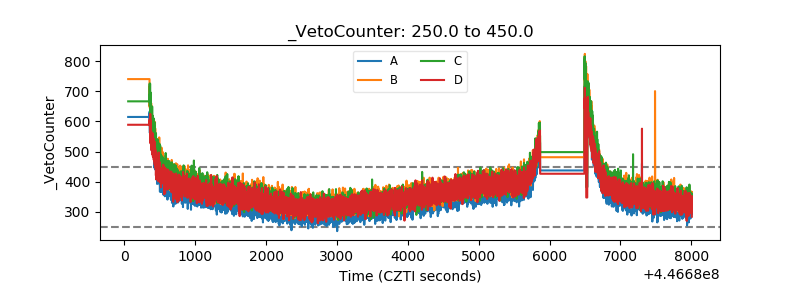 |