| Param | Original file | Final file |
|---|---|---|
| Filename | modeM0/AS1A13_054T01_9000006098_45508cztM0_level2.fits | modeM0/AS1A13_054T01_9000006098_45508cztM0_level2_quad_clean.evt |
| Size (bytes) | 611,340,480 | 136,051,200 |
| Size | 583.0 MB | 129.7 MB |
| Events in quadrant A | 6,771,831 | 911,670 |
| Events in quadrant B | 4,782,451 | 931,731 |
| Events in quadrant C | 4,062,850 | 909,091 |
| Events in quadrant D | 6,357,035 | 779,986 |
| Mode M0 | |||
|---|---|---|---|
| Quadrant | BADHDUFLAG | Total packets | Discarded packets |
| A | 0 | 26397 | 30 |
| B | 0 | 20269 | 21 |
| C | 0 | 18506 | 25 |
| D | 0 | 24853 | 53 |
| Mode SS | |||
|---|---|---|---|
| Quadrant | BADHDUFLAG | Total packets | Discarded packets |
| A | 0 | 167 | 1 |
| B | 0 | 168 | 0 |
| C | 0 | 168 | 0 |
| D | 0 | 168 | 0 |
| Quadrant | Total seconds | Saturated seconds | Saturation percentage |
|---|---|---|---|
| A | 8454 | 188 | 2.223799% |
| B | 8457 | 407 | 4.812581% |
| C | 8451 | 80 | 0.946634% |
| D | 8453 | 640 | 7.571276% |
Noise dominated data is calculated using 1-second bins in cleaned event files. If a bin has >2000 counts, and if more than 50% of those come from <1% of pixels, then it is considered to be noise-dominated and hence unusable.
| Quadrant | # 1 sec bins | Bins with >0 counts | Bins with >2000 counts | High rate bins dominated by noise | Noise dominated (total time) | Noise dominated (detector-on time) | Marked lightcurve |
|---|---|---|---|---|---|---|---|
| A | 8469 | 8469 | 2 | 2 | 0.02% | 0.02% | 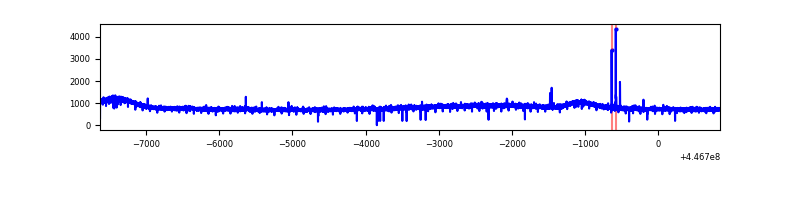 |
| B | 8470 | 8465 | 125 | 125 | 1.48% | 1.48% | 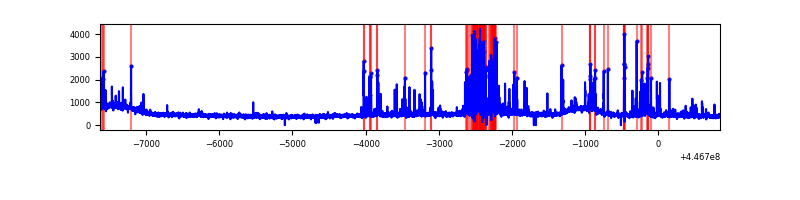 |
| C | 8470 | 8465 | 33 | 33 | 0.39% | 0.39% | 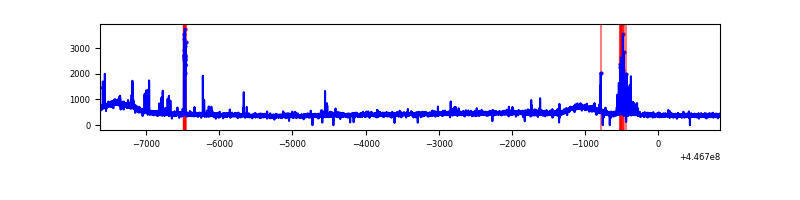 |
| D | 8470 | 8462 | 301 | 301 | 3.55% | 3.56% | 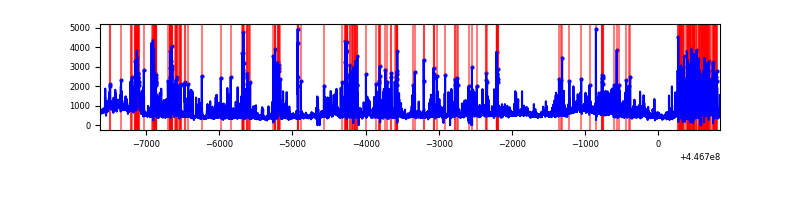 |
Top three noisy pixels from each quadrant. If the there are fewer than three noisy pixels in the level2.evt file, extra rows are filled as -1
| Pixel properties | Quadrant properties | ||||||
|---|---|---|---|---|---|---|---|
| Quadrant | DetID | PixID | Counts | Sigma | Mean | Median | Sigma |
| A | 10 | 83 | 2936505 | 14166.38 | 984 | 960 | 207.2 |
| A | 2 | 79 | 13060 | 58.39 | 984 | 960 | 207.2 |
| A | 3 | 137 | 11861 | 52.61 | 984 | 960 | 207.2 |
| B | 12 | 16 | 441153 | 2205.15 | 985 | 955 | 199.6 |
| B | 5 | 172 | 333446 | 1665.6 | 985 | 955 | 199.6 |
| B | 0 | 183 | 40304 | 197.12 | 985 | 955 | 199.6 |
| C | 14 | 254 | 253817 | 1084.36 | 974 | 980 | 233.2 |
| C | 12 | 250 | 8792 | 33.5 | 974 | 980 | 233.2 |
| C | 13 | 61 | 6491 | 23.64 | 974 | 980 | 233.2 |
| D | 1 | 52 | 1740288 | 7402.13 | 932 | 906 | 235.0 |
| D | 2 | 249 | 478041 | 2030.5 | 932 | 906 | 235.0 |
| D | 13 | 249 | 209681 | 888.47 | 932 | 906 | 235.0 |
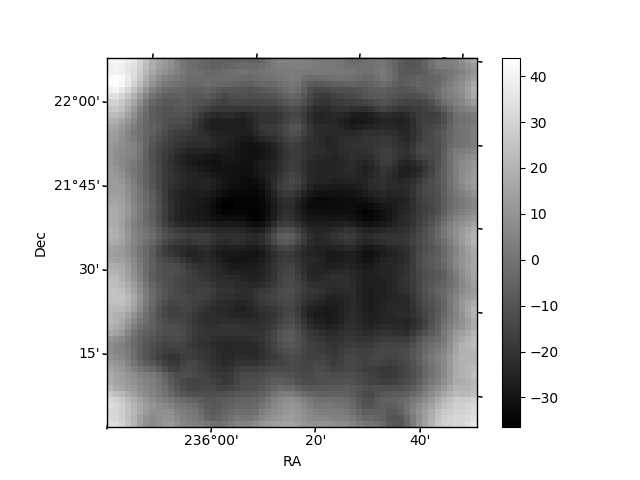
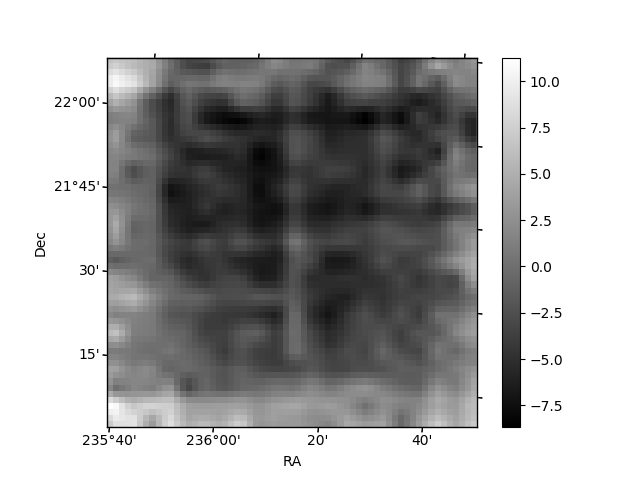
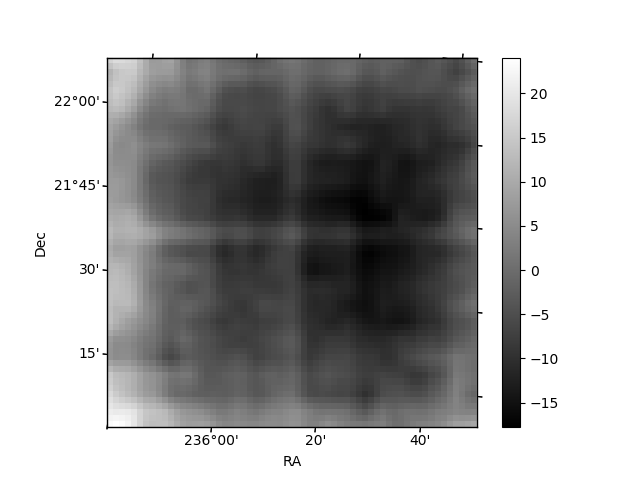
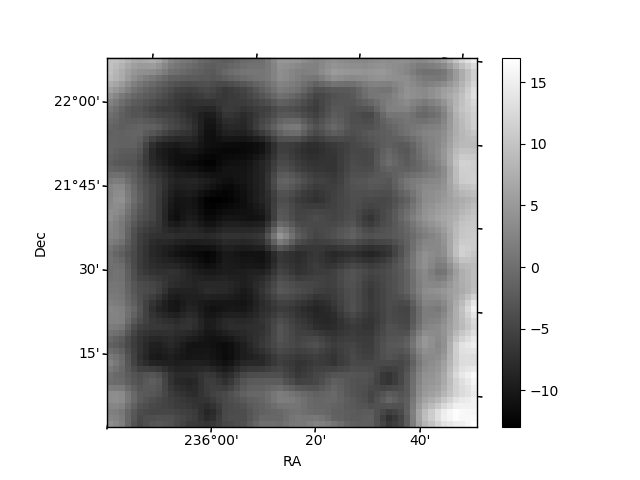
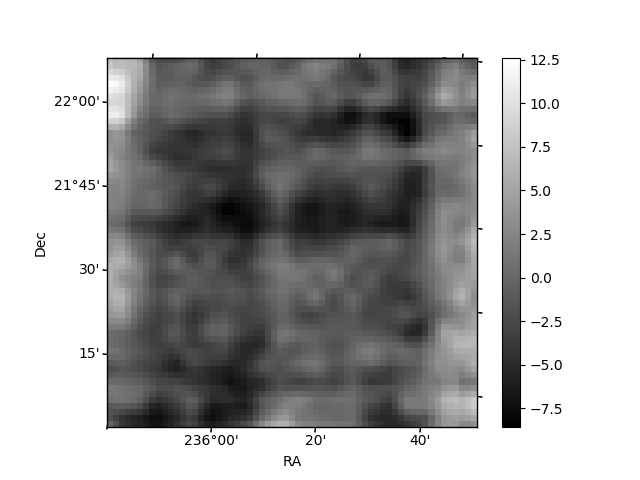
Histogram calculated using DETX and DETY for each event in the final _common_clean file
| Quadrant A | 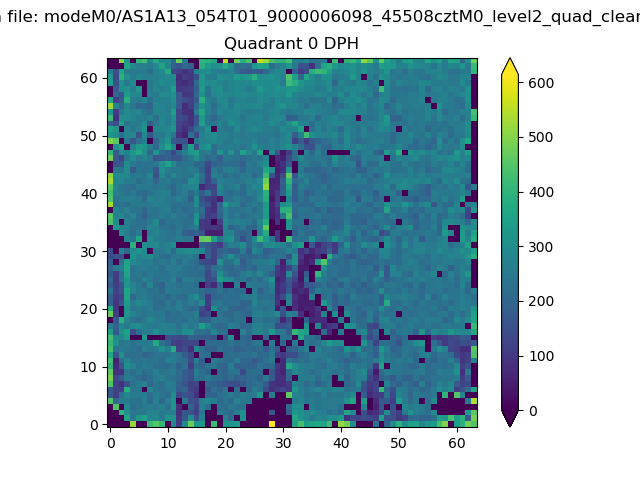 |
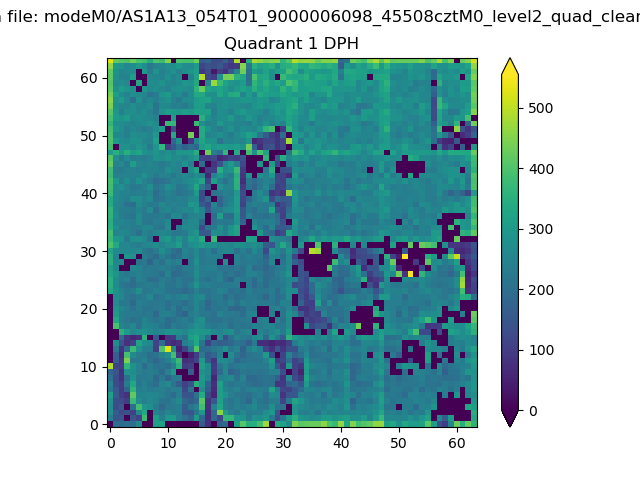 |
Quadrant B |
|---|---|---|---|
| Quadrant D | 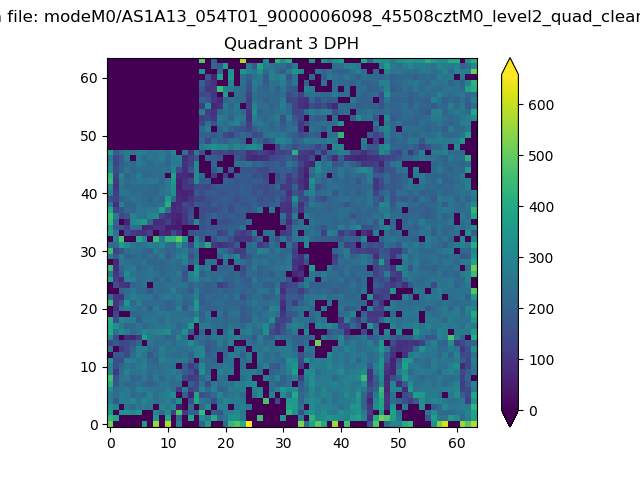 |
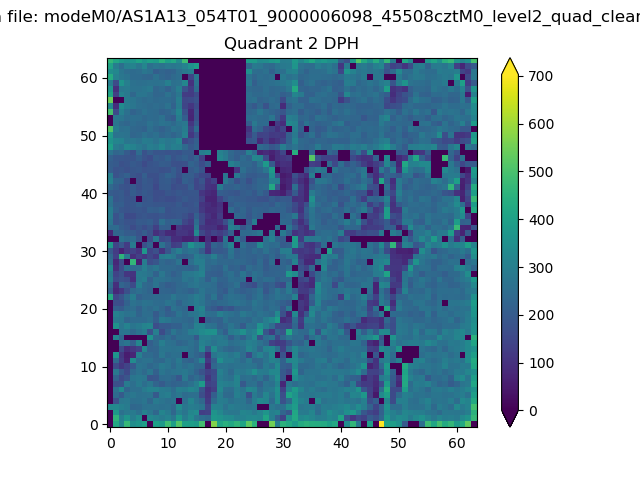 |
Quadrant C |
| Plot type | Count rate plots | Images |
|---|---|---|
| Comparison with Poisson distribution Blue bars denote a histogram of data divided into 1 sec bins. Red curve is a Poisson curve with rate = median count rate of data. |
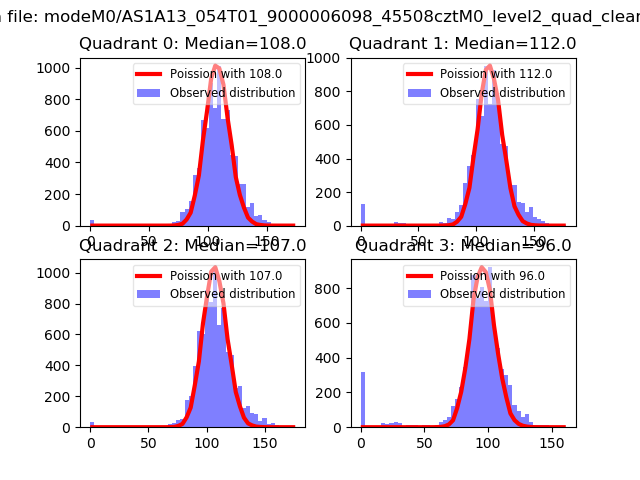 |
 |
| Quadrant-wise count rates Data is divided into 100 sec bins |
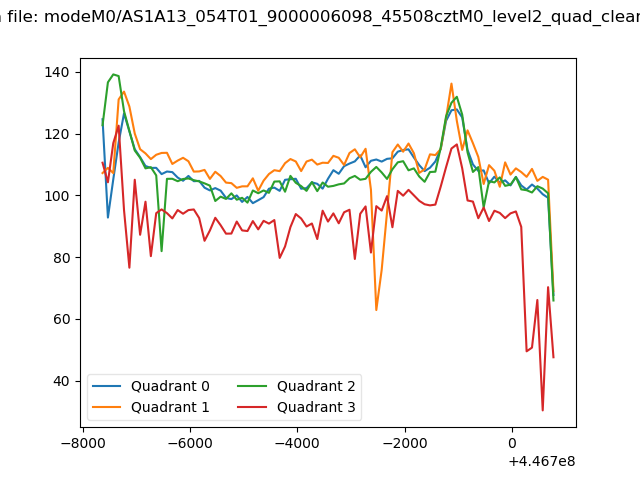 |
|
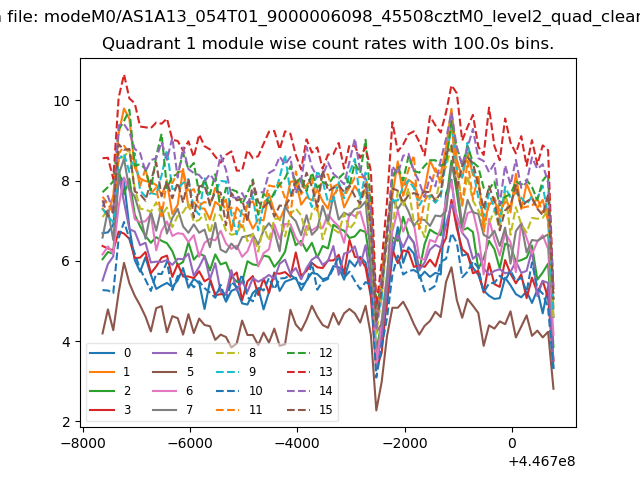
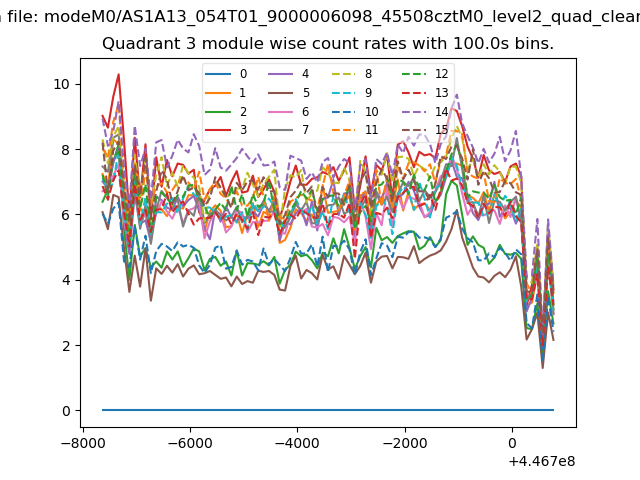
| Module-wise count rates for Quadrant A Data is divided into 100 sec bins |
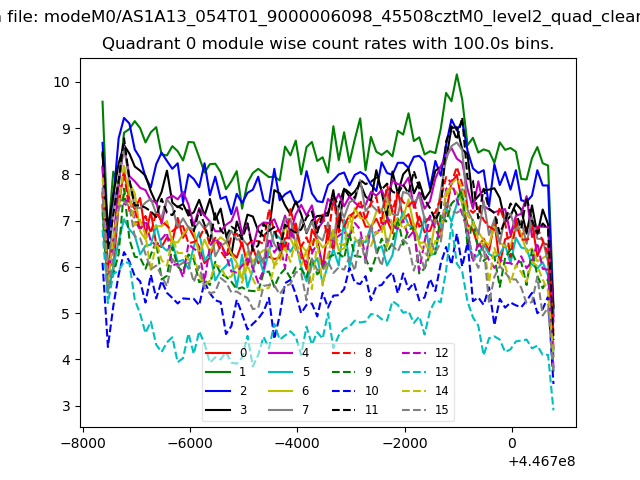 |
 |
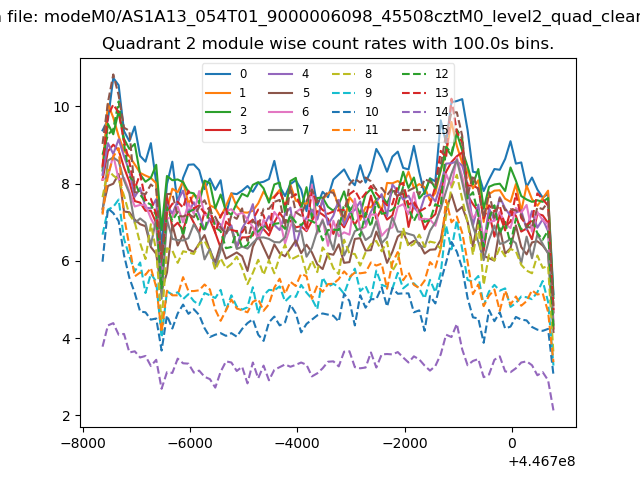
| Module-wise count rates for Quadrant B Data is divided into 100 sec bins |
 |
 |
| Module-wise count rates for Quadrant C Data is divided into 100 sec bins |
 |
 |
| Module-wise count rates for Quadrant D Data is divided into 100 sec bins |
 |
 |
| Parameter | Plot |
|---|---|
| CZT HV Monitor | 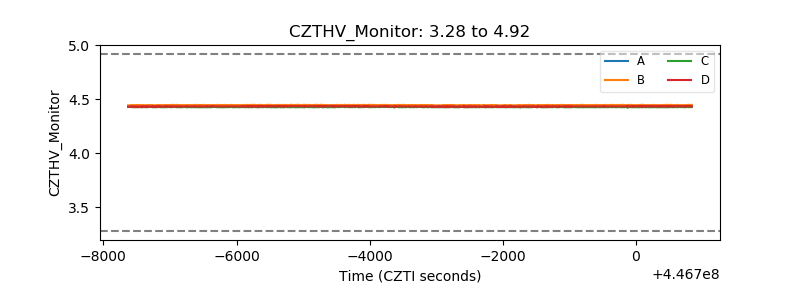 |
| D_VDD | 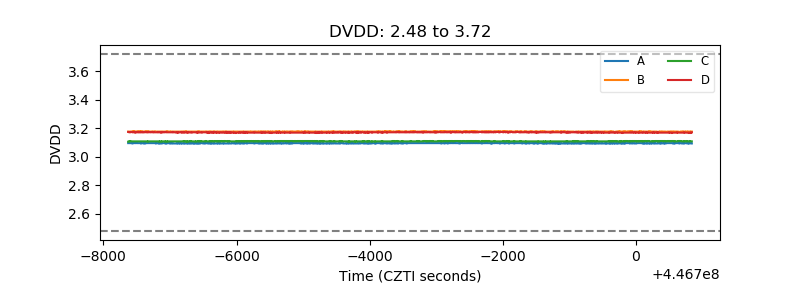 |
| Temperature 1 | 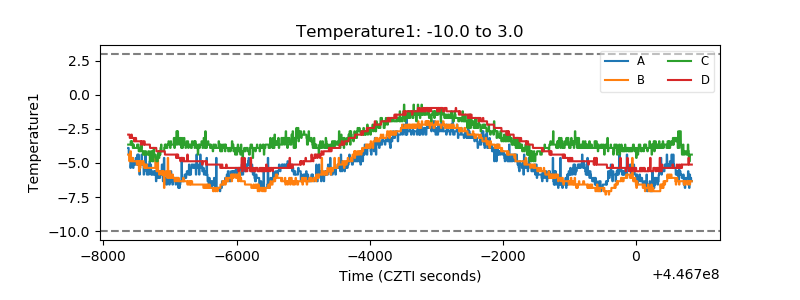 |
| Veto HV Monitor | 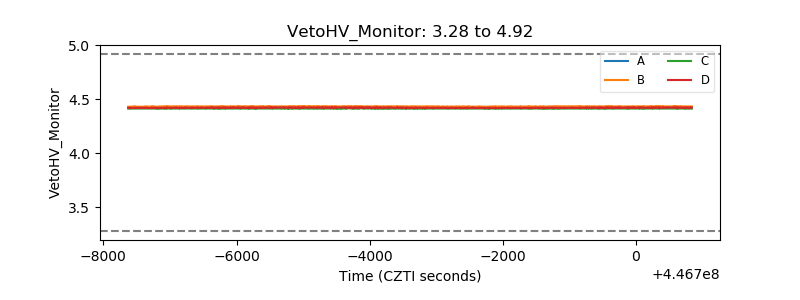 |
| Veto LLD | 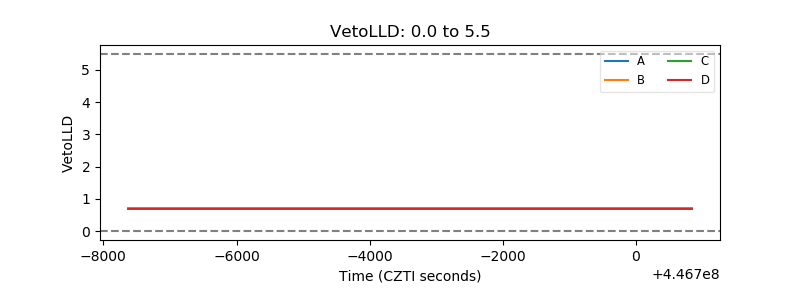 |
| Alpha Counter |  |
| _CPM_Rate | 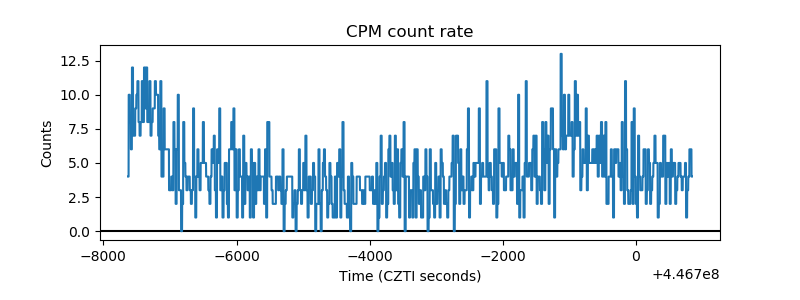 |
| CZT Counter | 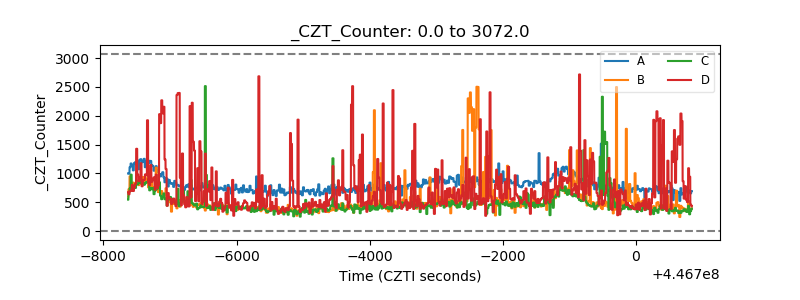 |
| +2.5 Volts monitor | 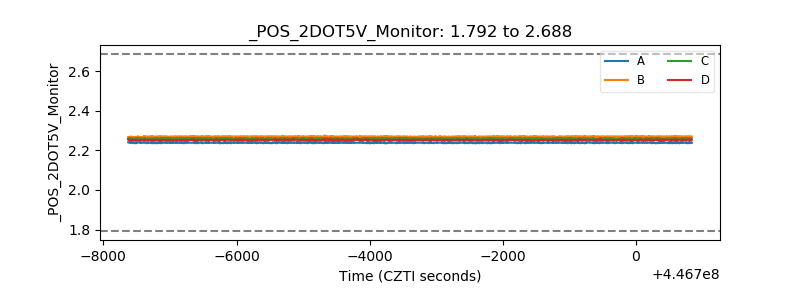 |
| +5 Volts monitor | 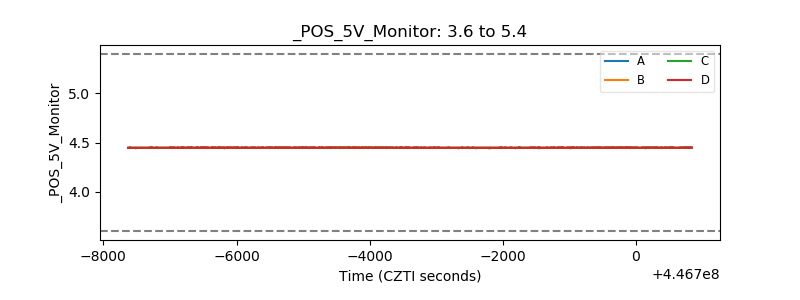 |
| _ROLL_ROT | 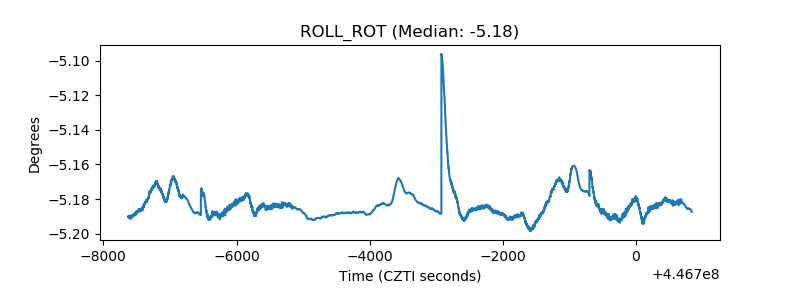 |
| _Roll_DEC | 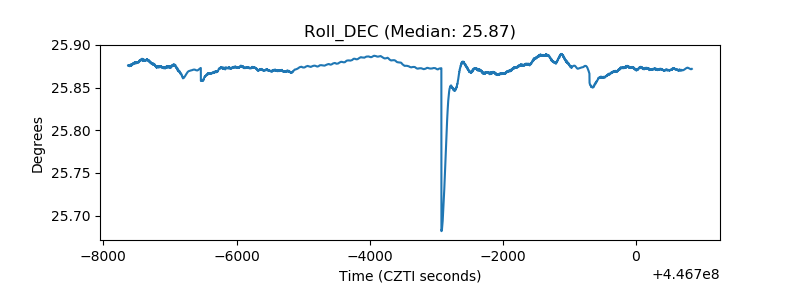 |
| _Roll_RA | 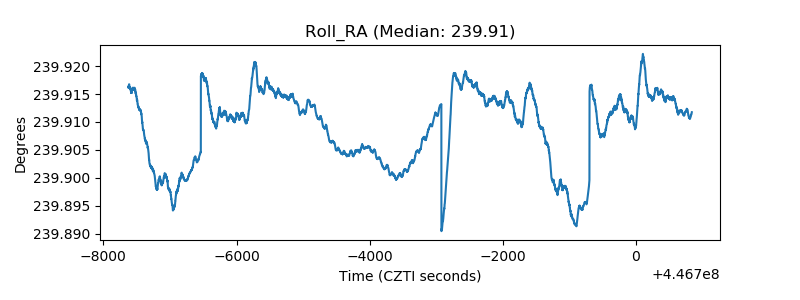 |
| Veto Counter | 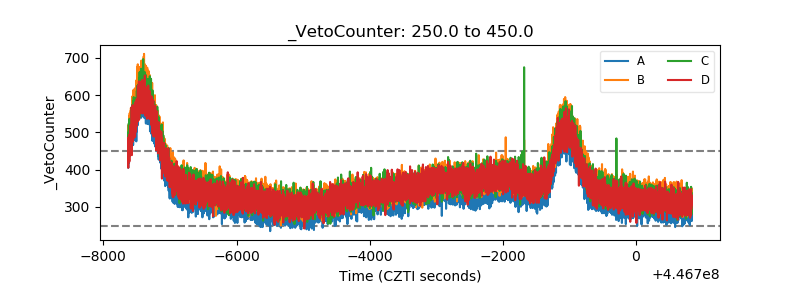 |