| Param | Original file | Final file |
|---|---|---|
| Filename | modeM0/AS1A13_031T01_9000006102_45518cztM0_level2.fits | modeM0/AS1A13_031T01_9000006102_45518cztM0_level2_quad_clean.evt |
| Size (bytes) | 269,565,120 | 56,036,160 |
| Size | 257.1 MB | 53.4 MB |
| Events in quadrant A | 3,009,332 | 375,612 |
| Events in quadrant B | 1,687,028 | 400,302 |
| Events in quadrant C | 1,576,309 | 386,797 |
| Events in quadrant D | 3,450,800 | 302,752 |
| Mode M0 | |||
|---|---|---|---|
| Quadrant | BADHDUFLAG | Total packets | Discarded packets |
| A | 0 | 11326 | 1 |
| B | 0 | 7140 | 1 |
| C | 0 | 6905 | 1 |
| D | 0 | 12555 | 1 |
| Mode M9 | |||
|---|---|---|---|
| Quadrant | BADHDUFLAG | Total packets | Discarded packets |
| A | 0 | 12 | 0 |
| B | 0 | 12 | 0 |
| C | 0 | 12 | 0 |
| D | 0 | 12 | 0 |
| Mode SS | |||
|---|---|---|---|
| Quadrant | BADHDUFLAG | Total packets | Discarded packets |
| A | 0 | 66 | 0 |
| B | 0 | 66 | 0 |
| C | 0 | 66 | 0 |
| D | 0 | 66 | 0 |
| Quadrant | Total seconds | Saturated seconds | Saturation percentage |
|---|---|---|---|
| A | 3262 | 200 | 6.131208% |
| B | 3262 | 89 | 2.728387% |
| C | 3262 | 54 | 1.655426% |
| D | 3262 | 594 | 18.209687% |
Noise dominated data is calculated using 1-second bins in cleaned event files. If a bin has >2000 counts, and if more than 50% of those come from <1% of pixels, then it is considered to be noise-dominated and hence unusable.
| Quadrant | # 1 sec bins | Bins with >0 counts | Bins with >2000 counts | High rate bins dominated by noise | Noise dominated (total time) | Noise dominated (detector-on time) | Marked lightcurve |
|---|---|---|---|---|---|---|---|
| A | 4457 | 3263 | 20 | 20 | 0.45% | 0.61% | 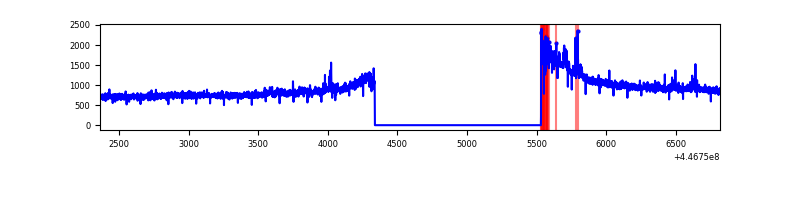 |
| B | 4457 | 3263 | 6 | 6 | 0.13% | 0.18% | 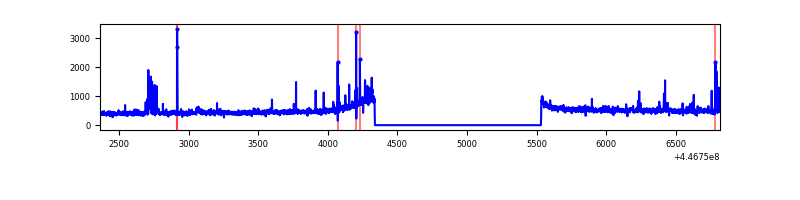 |
| C | 4457 | 3263 | 1 | 1 | 0.02% | 0.03% | 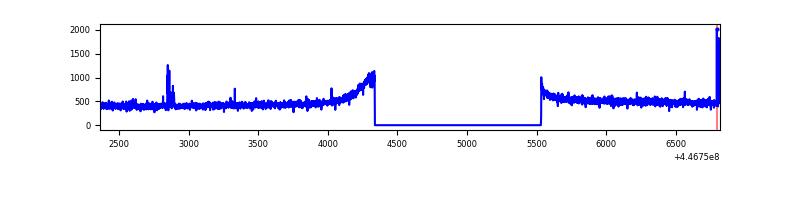 |
| D | 4457 | 3263 | 409 | 409 | 9.18% | 12.53% | 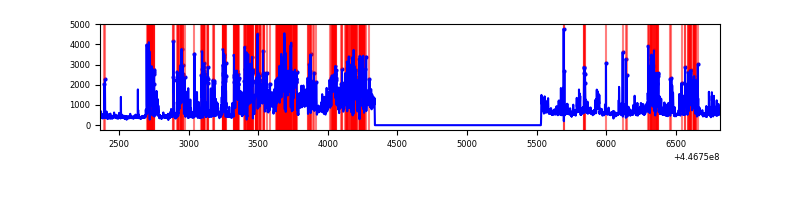 |
Top three noisy pixels from each quadrant. If the there are fewer than three noisy pixels in the level2.evt file, extra rows are filled as -1
| Pixel properties | Quadrant properties | ||||||
|---|---|---|---|---|---|---|---|
| Quadrant | DetID | PixID | Counts | Sigma | Mean | Median | Sigma |
| A | 10 | 83 | 1384011 | 16432.79 | 397 | 389 | 84.2 |
| A | 7 | 3 | 72636 | 858.05 | 397 | 389 | 84.2 |
| A | 13 | 248 | 11648 | 133.72 | 397 | 389 | 84.2 |
| B | 5 | 172 | 78870 | 981.02 | 399 | 386 | 80.0 |
| B | 0 | 186 | 14849 | 180.78 | 399 | 386 | 80.0 |
| B | 5 | 171 | 11095 | 133.86 | 399 | 386 | 80.0 |
| C | 14 | 254 | 19429 | 200.23 | 398 | 401 | 95.0 |
| C | 3 | 233 | 2874 | 26.02 | 398 | 401 | 95.0 |
| C | 13 | 61 | 2715 | 24.35 | 398 | 401 | 95.0 |
| D | 13 | 249 | 1346065 | 14633.08 | 368 | 356 | 92.0 |
| D | 1 | 52 | 386666 | 4200.69 | 368 | 356 | 92.0 |
| D | 2 | 249 | 201545 | 2187.7 | 368 | 356 | 92.0 |
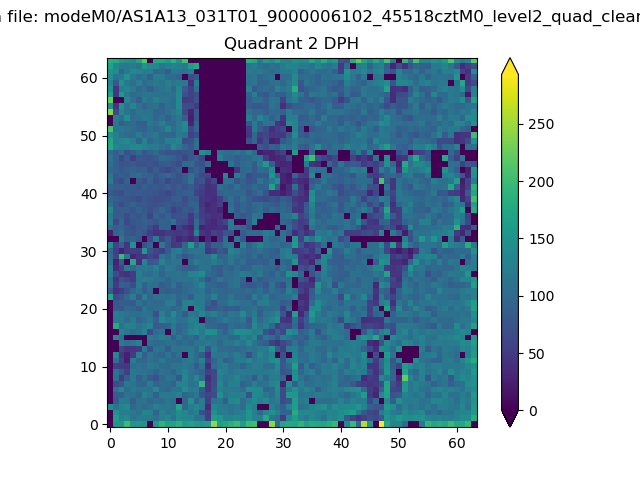
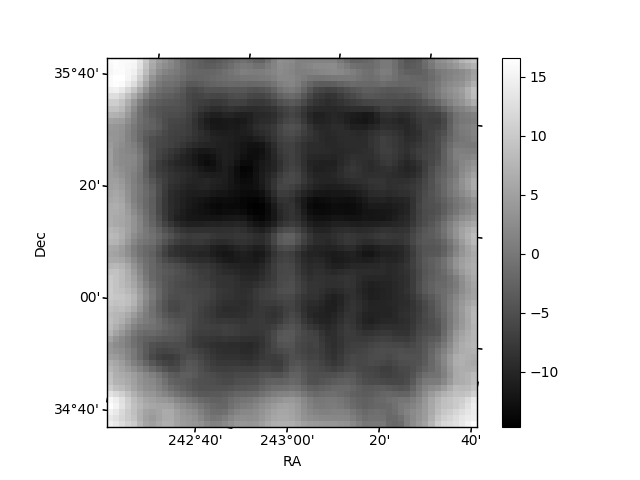
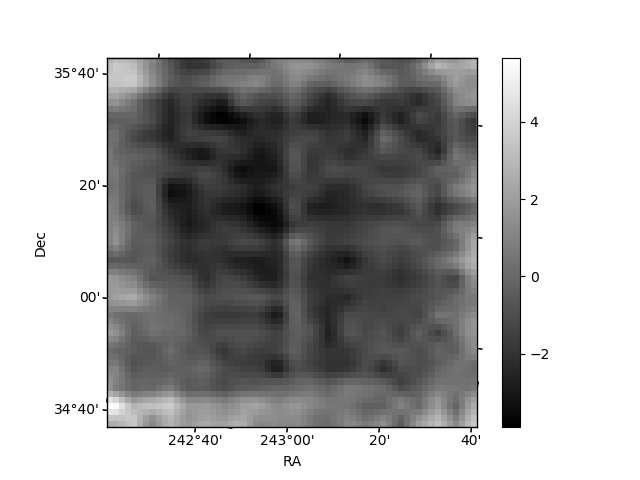
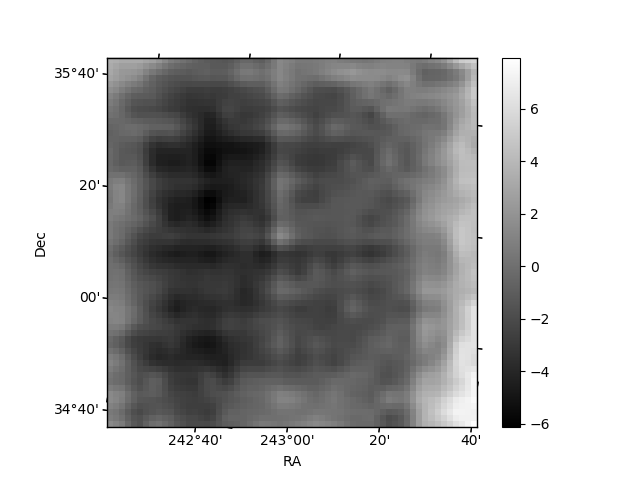
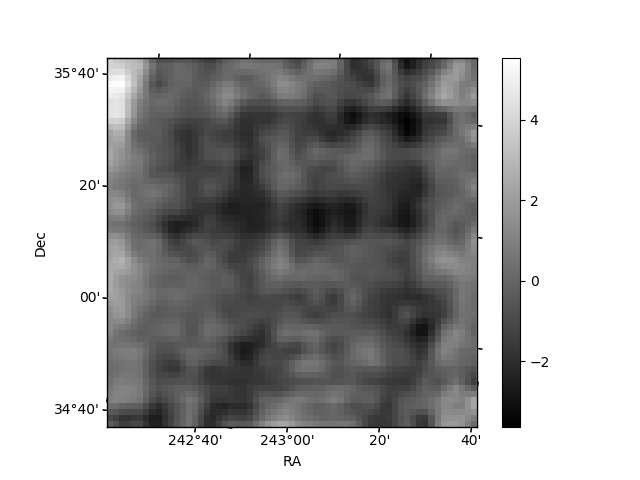
Histogram calculated using DETX and DETY for each event in the final _common_clean file
| Quadrant A | 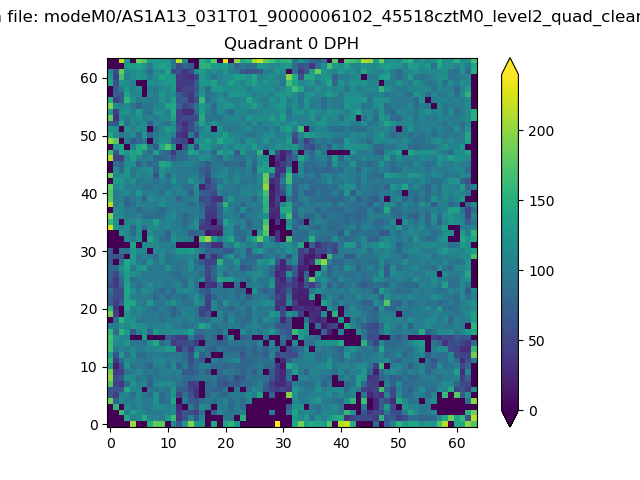 |
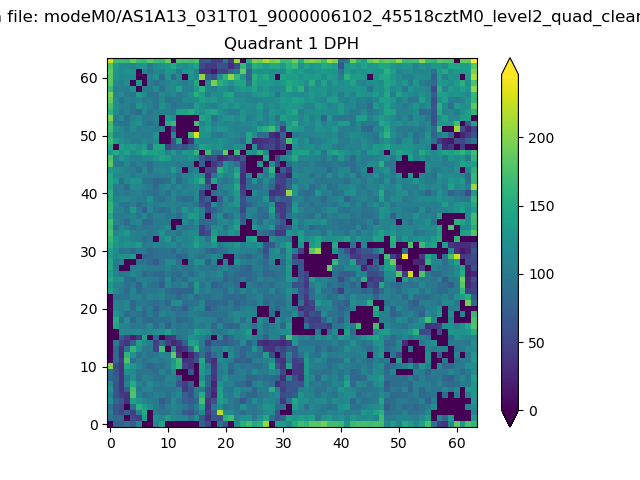 |
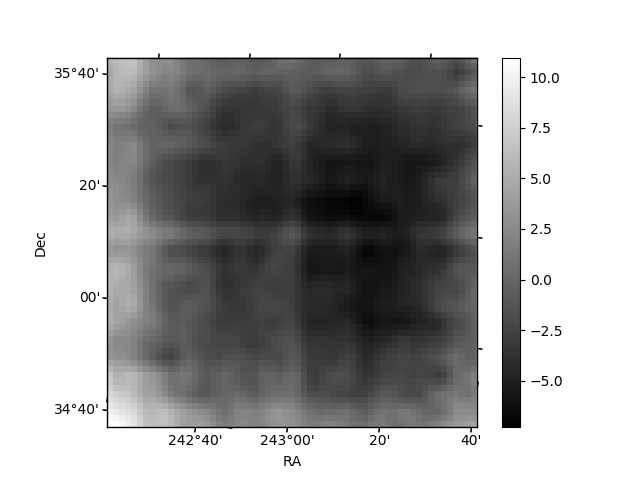
Quadrant B |
|---|---|---|---|
| Quadrant D | 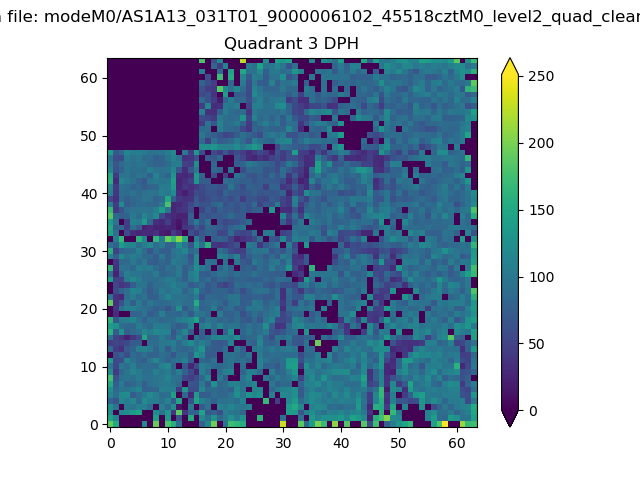 |
 |
Quadrant C |
| Plot type | Count rate plots | Images |
|---|---|---|
| Comparison with Poisson distribution Blue bars denote a histogram of data divided into 1 sec bins. Red curve is a Poisson curve with rate = median count rate of data. |
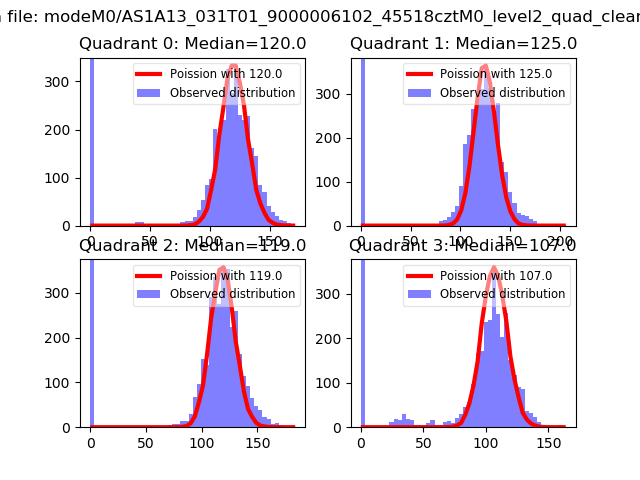 |
 |
| Quadrant-wise count rates Data is divided into 100 sec bins |
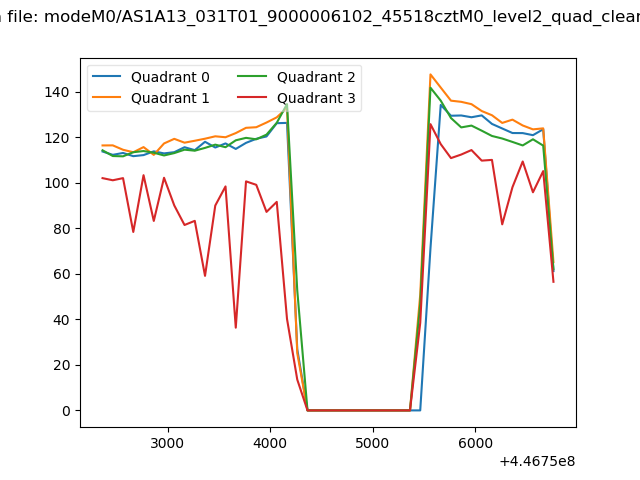 |
|
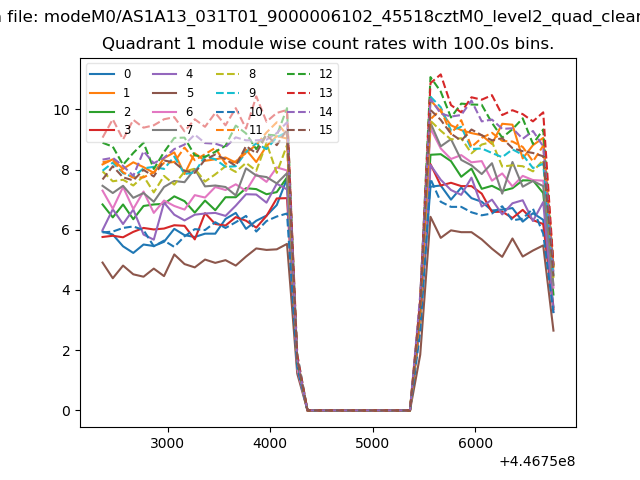
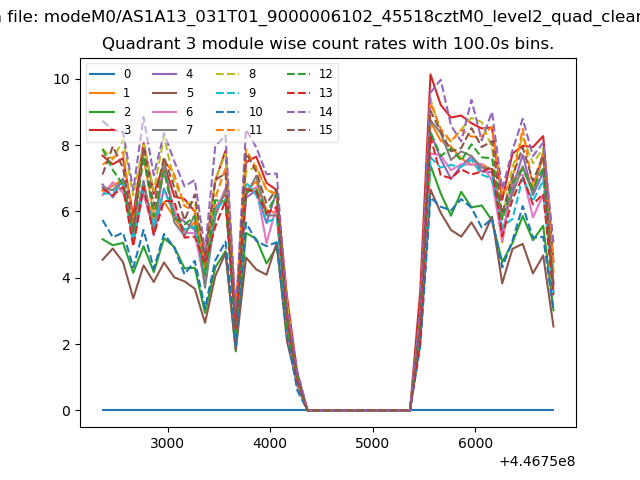
| Module-wise count rates for Quadrant A Data is divided into 100 sec bins |
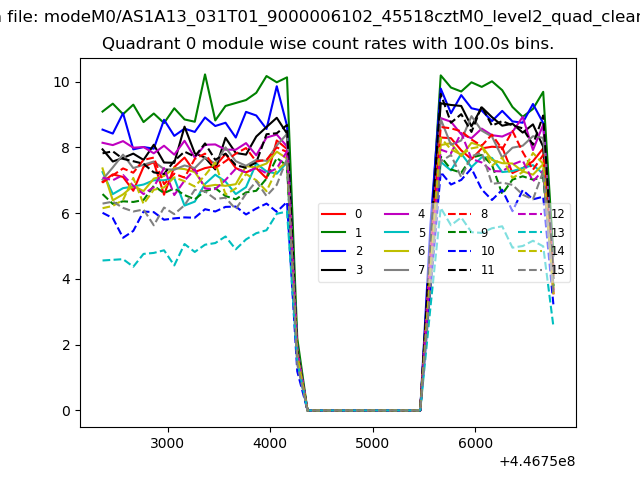 |
 |
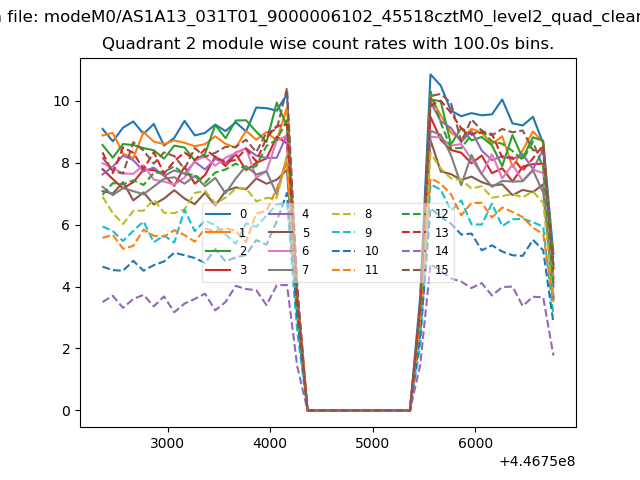
| Module-wise count rates for Quadrant B Data is divided into 100 sec bins |
 |
 |
| Module-wise count rates for Quadrant C Data is divided into 100 sec bins |
 |
 |
| Module-wise count rates for Quadrant D Data is divided into 100 sec bins |
 |
 |
| Parameter | Plot |
|---|---|
| CZT HV Monitor | 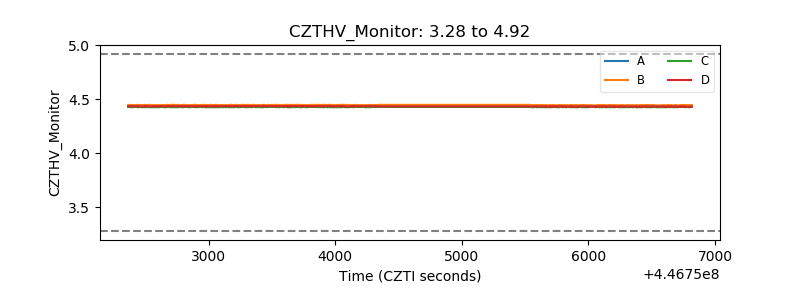 |
| D_VDD | 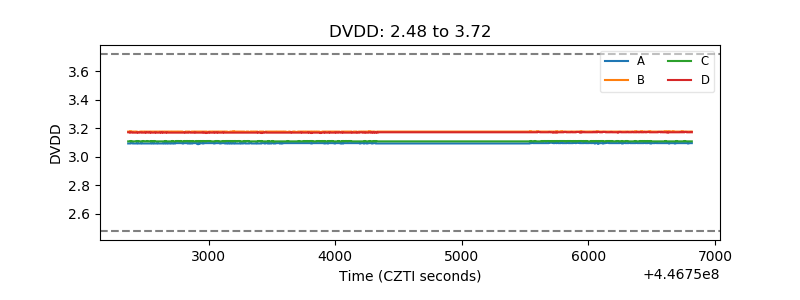 |
| Temperature 1 | 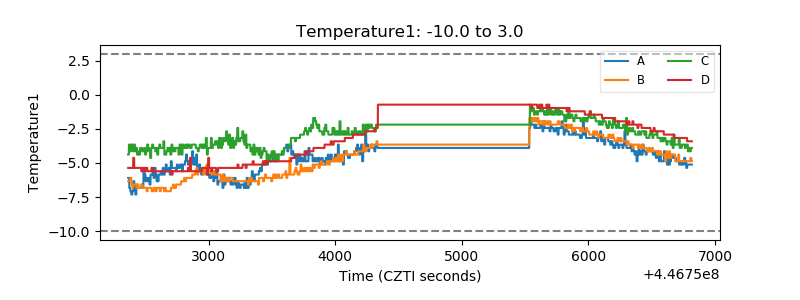 |
| Veto HV Monitor | 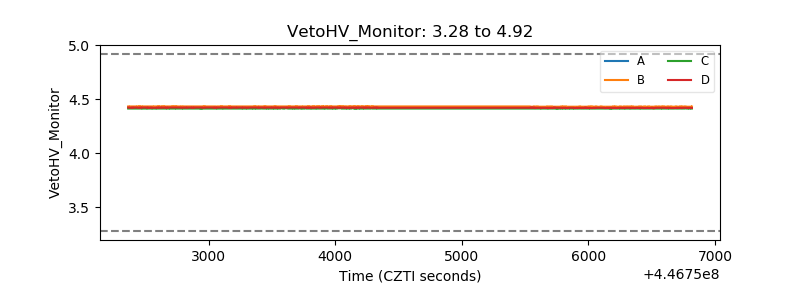 |
| Veto LLD | 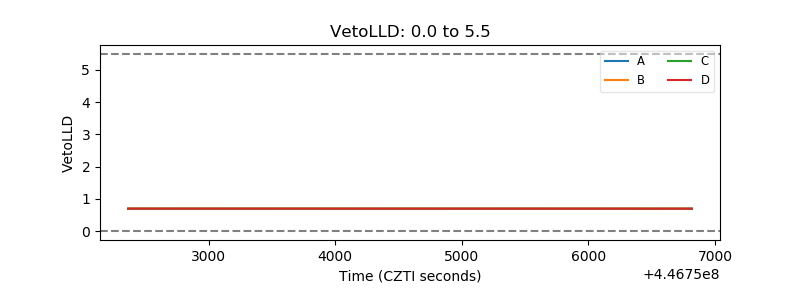 |
| Alpha Counter | 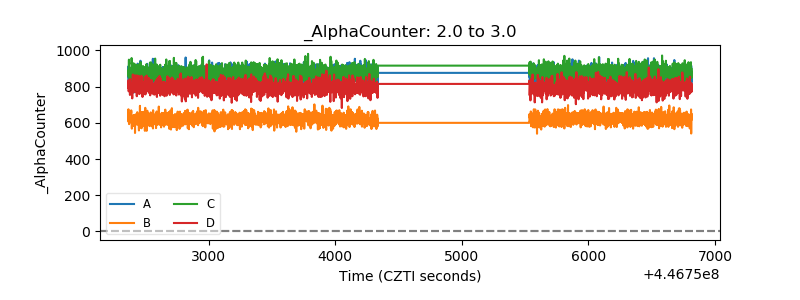 |
| _CPM_Rate | 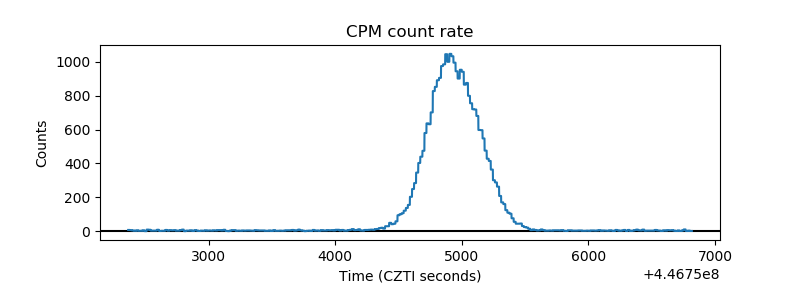 |
| CZT Counter |  |
| +2.5 Volts monitor | 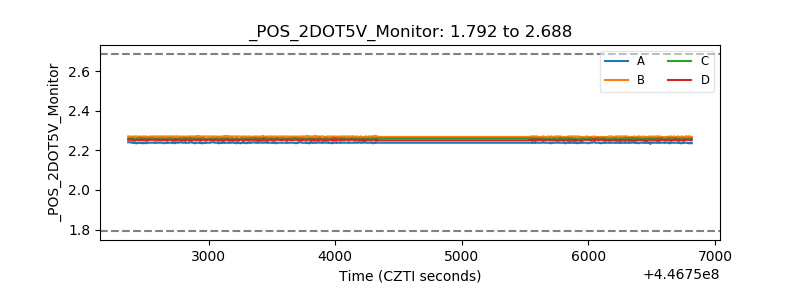 |
| +5 Volts monitor | 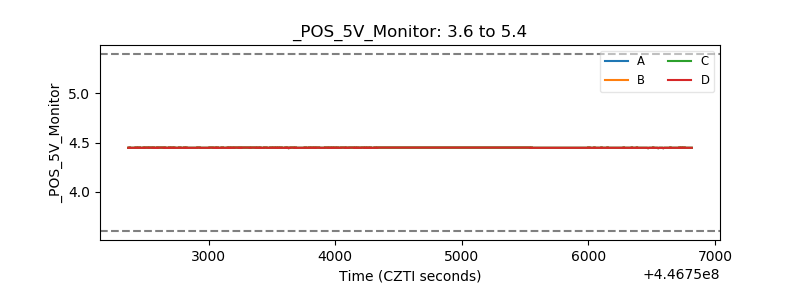 |
| _ROLL_ROT | 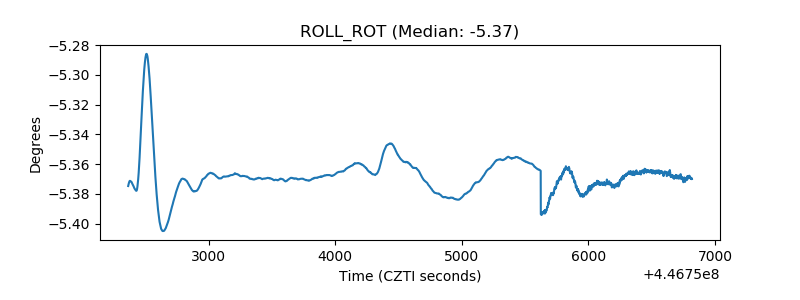 |
| _Roll_DEC | 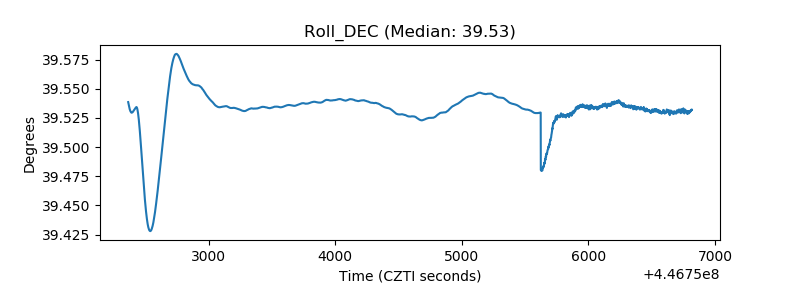 |
| _Roll_RA | 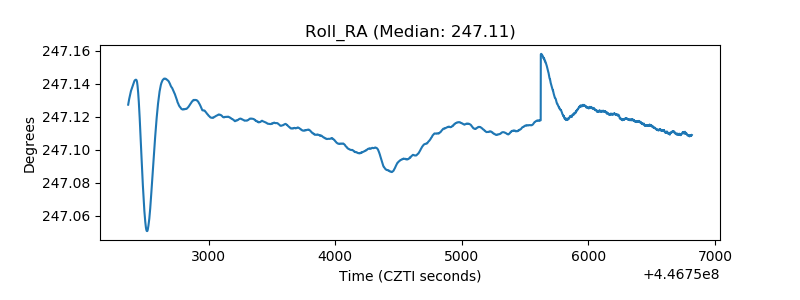 |
| Veto Counter | 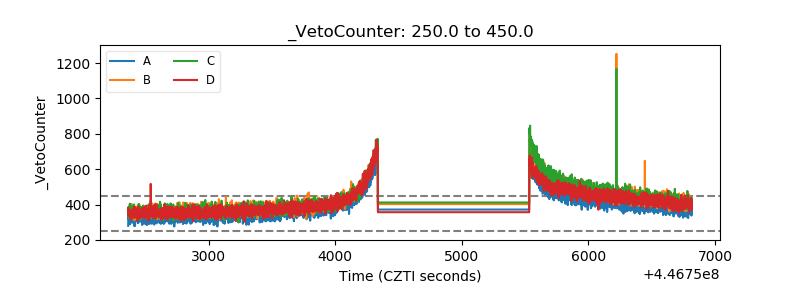 |