| Param | Original file | Final file |
|---|---|---|
| Filename | modeM0/AS1A13_031T01_9000006102_45519cztM0_level2.fits | modeM0/AS1A13_031T01_9000006102_45519cztM0_level2_quad_clean.evt |
| Size (bytes) | 485,052,480 | 108,673,920 |
| Size | 462.6 MB | 103.6 MB |
| Events in quadrant A | 5,509,202 | 729,267 |
| Events in quadrant B | 3,254,382 | 762,802 |
| Events in quadrant C | 3,034,226 | 731,851 |
| Events in quadrant D | 5,663,888 | 623,173 |
| Mode M0 | |||
|---|---|---|---|
| Quadrant | BADHDUFLAG | Total packets | Discarded packets |
| A | 0 | 21114 | 3 |
| B | 0 | 13754 | 1 |
| C | 0 | 13439 | 1 |
| D | 0 | 21107 | 1 |
| Mode M9 | |||
|---|---|---|---|
| Quadrant | BADHDUFLAG | Total packets | Discarded packets |
| A | 0 | 12 | 0 |
| B | 0 | 12 | 0 |
| C | 0 | 12 | 0 |
| D | 0 | 12 | 0 |
| Mode SS | |||
|---|---|---|---|
| Quadrant | BADHDUFLAG | Total packets | Discarded packets |
| A | 0 | 128 | 0 |
| B | 0 | 128 | 0 |
| C | 0 | 128 | 0 |
| D | 0 | 128 | 0 |
| Quadrant | Total seconds | Saturated seconds | Saturation percentage |
|---|---|---|---|
| A | 6360 | 167 | 2.625786% |
| B | 6361 | 66 | 1.037573% |
| C | 6361 | 44 | 0.691715% |
| D | 6361 | 636 | 9.998428% |
Noise dominated data is calculated using 1-second bins in cleaned event files. If a bin has >2000 counts, and if more than 50% of those come from <1% of pixels, then it is considered to be noise-dominated and hence unusable.
| Quadrant | # 1 sec bins | Bins with >0 counts | Bins with >2000 counts | High rate bins dominated by noise | Noise dominated (total time) | Noise dominated (detector-on time) | Marked lightcurve |
|---|---|---|---|---|---|---|---|
| A | 7505 | 6361 | 18 | 18 | 0.24% | 0.28% | 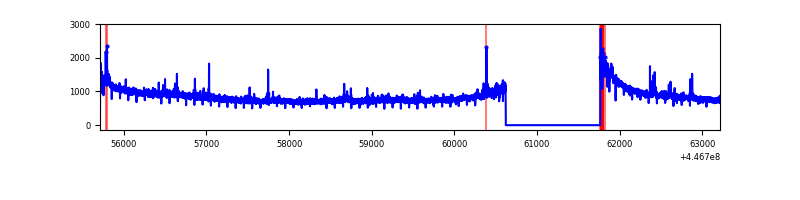 |
| B | 7506 | 6362 | 20 | 20 | 0.27% | 0.31% | 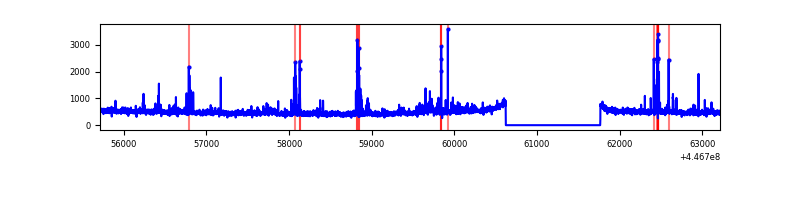 |
| C | 7506 | 6362 | 20 | 20 | 0.27% | 0.31% | 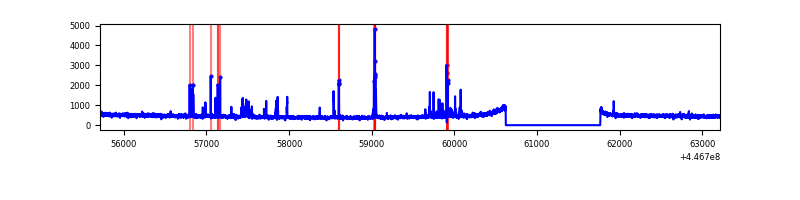 |
| D | 7506 | 6362 | 521 | 521 | 6.94% | 8.19% | 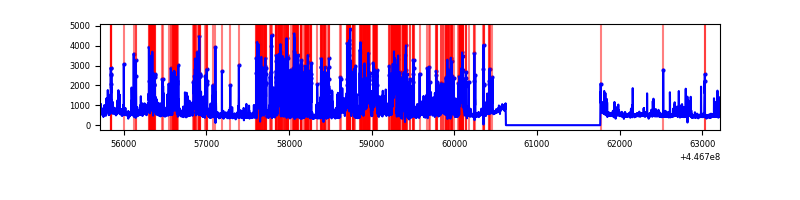 |
Top three noisy pixels from each quadrant. If the there are fewer than three noisy pixels in the level2.evt file, extra rows are filled as -1
| Pixel properties | Quadrant properties | ||||||
|---|---|---|---|---|---|---|---|
| Quadrant | DetID | PixID | Counts | Sigma | Mean | Median | Sigma |
| A | 10 | 83 | 2530712 | 16671.63 | 731 | 716 | 151.8 |
| A | 7 | 3 | 118698 | 777.45 | 731 | 716 | 151.8 |
| A | 13 | 248 | 22580 | 144.07 | 731 | 716 | 151.8 |
| B | 12 | 18 | 122287 | 841.54 | 737 | 714 | 144.5 |
| B | 5 | 172 | 117927 | 811.36 | 737 | 714 | 144.5 |
| B | 4 | 158 | 31815 | 215.29 | 737 | 714 | 144.5 |
| C | 14 | 254 | 132696 | 772.59 | 732 | 737 | 170.8 |
| C | 1 | 3 | 40163 | 230.83 | 732 | 737 | 170.8 |
| C | 13 | 61 | 4984 | 24.87 | 732 | 737 | 170.8 |
| D | 13 | 249 | 1010242 | 5716.95 | 703 | 682 | 176.6 |
| D | 2 | 249 | 910242 | 5150.67 | 703 | 682 | 176.6 |
| D | 1 | 52 | 787883 | 4457.77 | 703 | 682 | 176.6 |
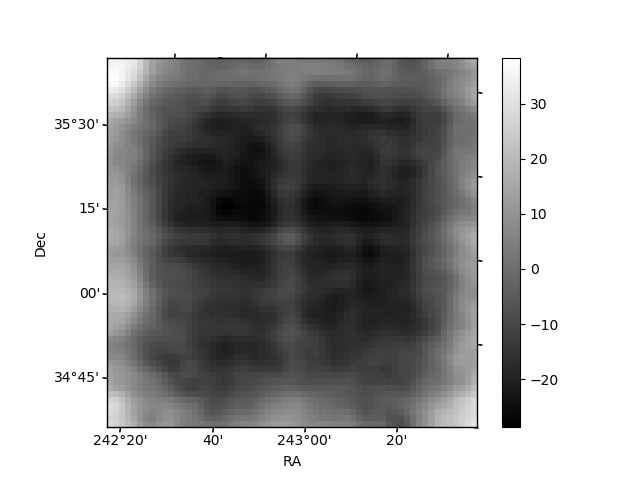
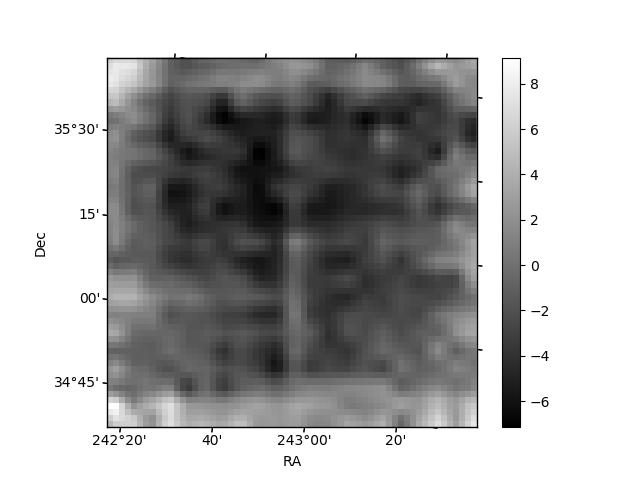
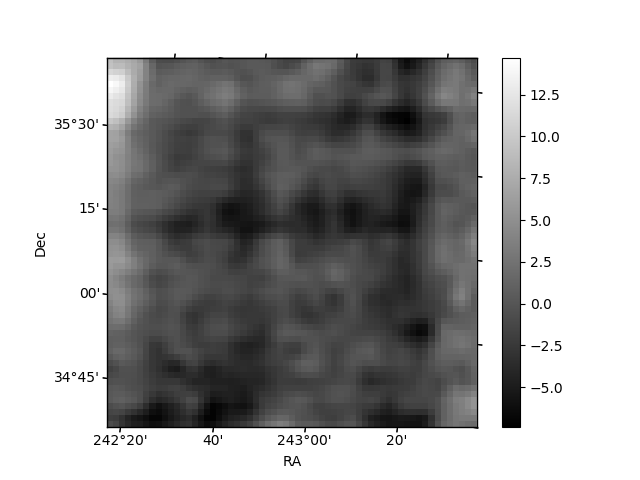
Histogram calculated using DETX and DETY for each event in the final _common_clean file
| Quadrant A | 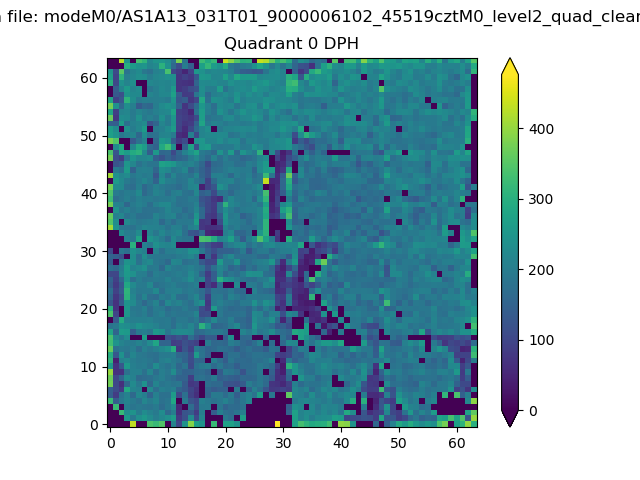 |
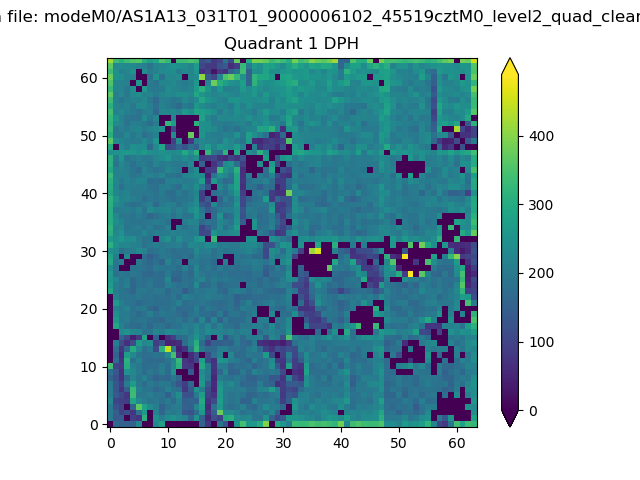 |
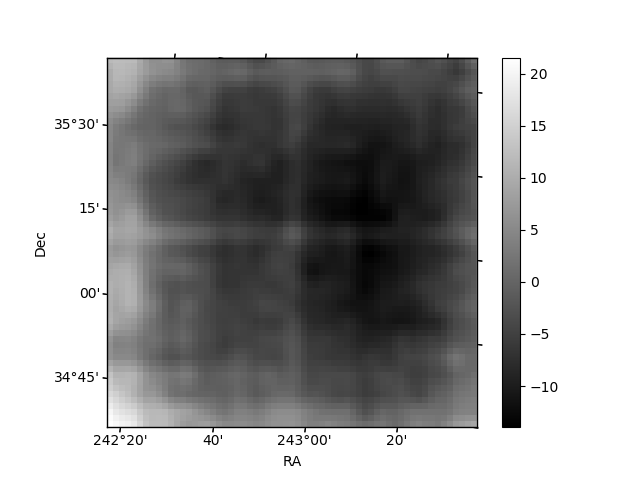
Quadrant B |
|---|---|---|---|
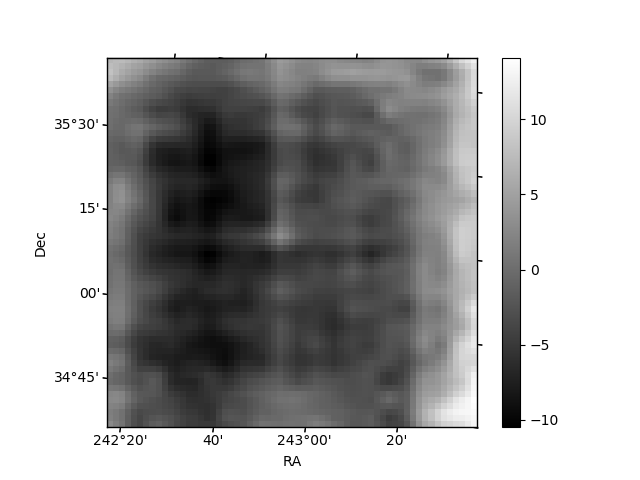
| Quadrant D | 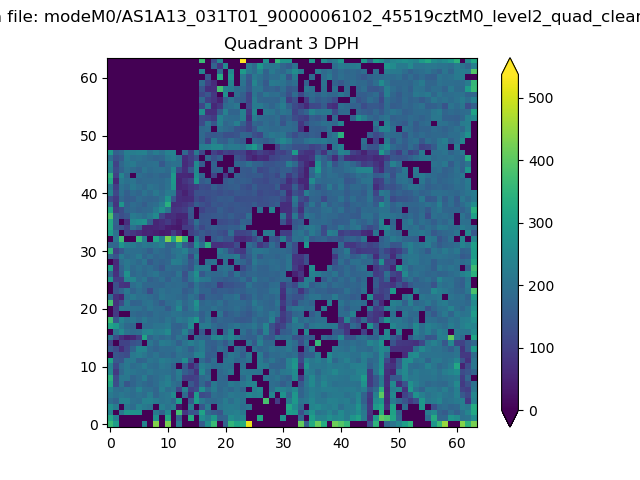 |
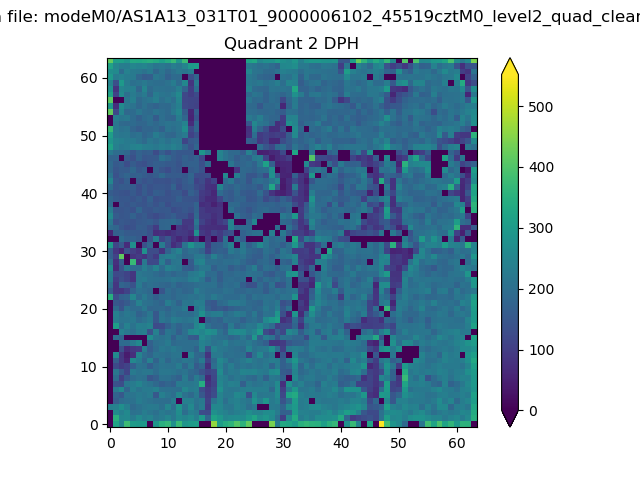 |
Quadrant C |
| Plot type | Count rate plots | Images |
|---|---|---|
| Comparison with Poisson distribution Blue bars denote a histogram of data divided into 1 sec bins. Red curve is a Poisson curve with rate = median count rate of data. |
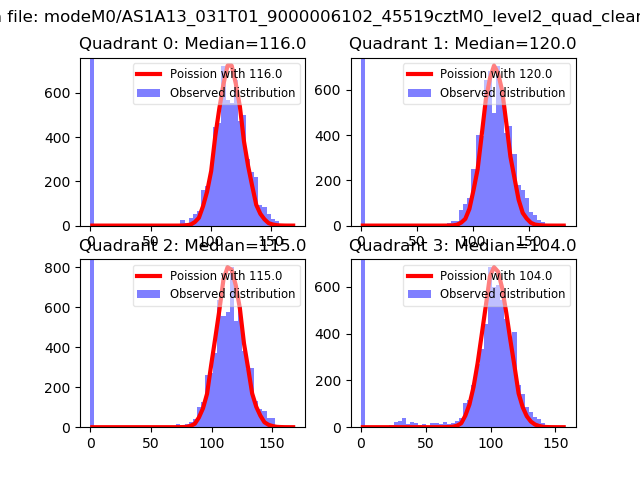 |
 |
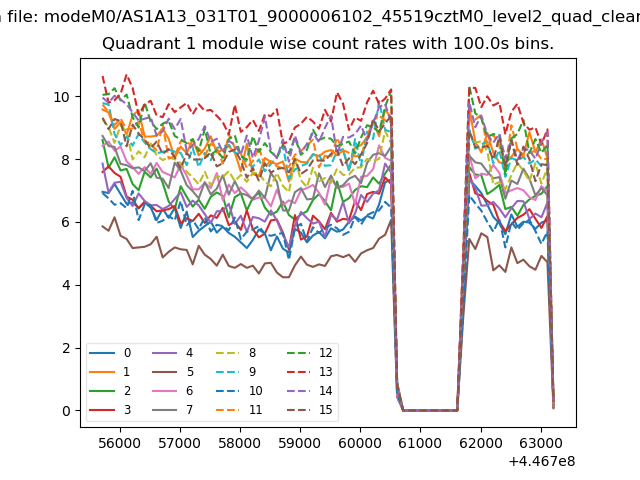
| Quadrant-wise count rates Data is divided into 100 sec bins |
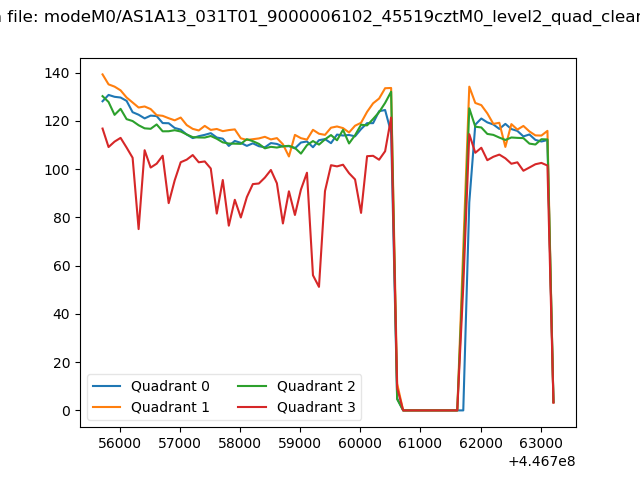 |
|
| Module-wise count rates for Quadrant A Data is divided into 100 sec bins |
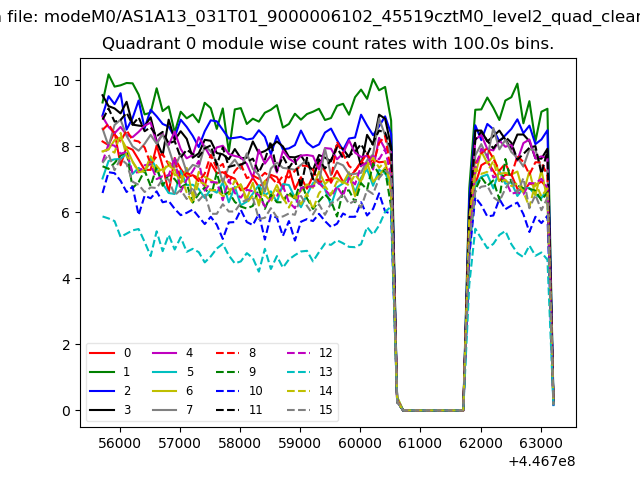 |
 |
| Module-wise count rates for Quadrant B Data is divided into 100 sec bins |
 |
 |
| Module-wise count rates for Quadrant C Data is divided into 100 sec bins |
 |
 |
| Module-wise count rates for Quadrant D Data is divided into 100 sec bins |
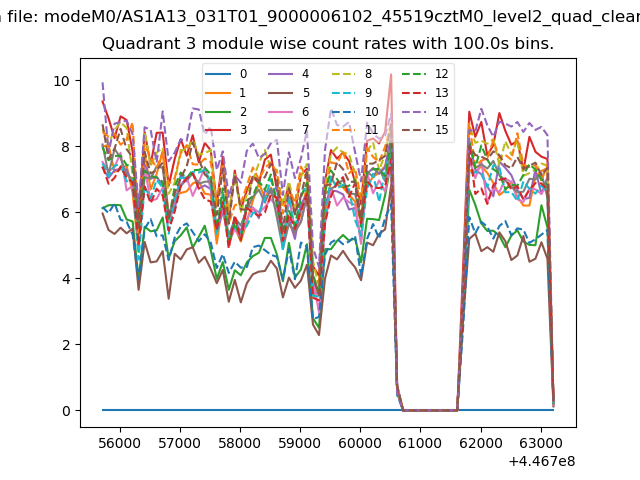 |
 |
| Parameter | Plot |
|---|---|
| CZT HV Monitor | 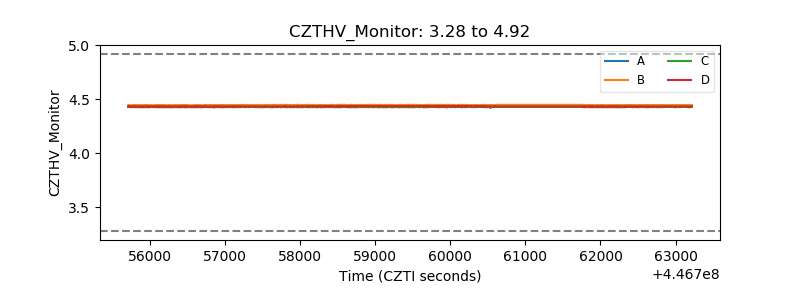 |
| D_VDD | 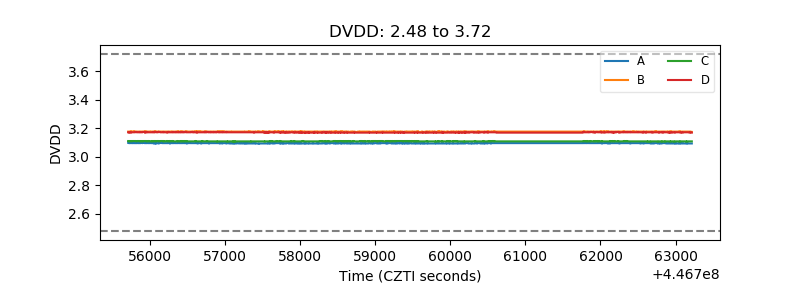 |
| Temperature 1 | 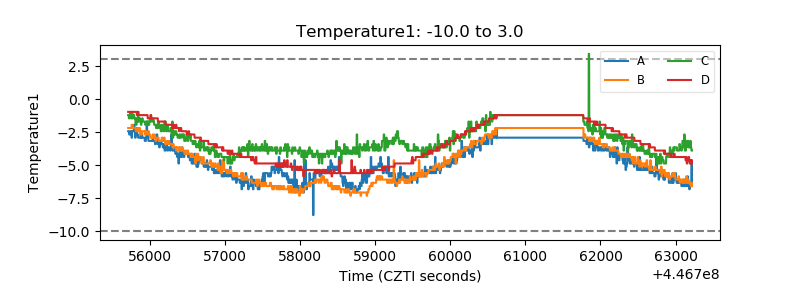 |
| Veto HV Monitor |  |
| Veto LLD | 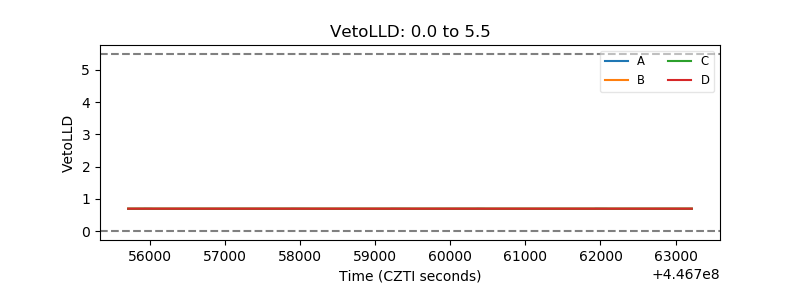 |
| Alpha Counter | 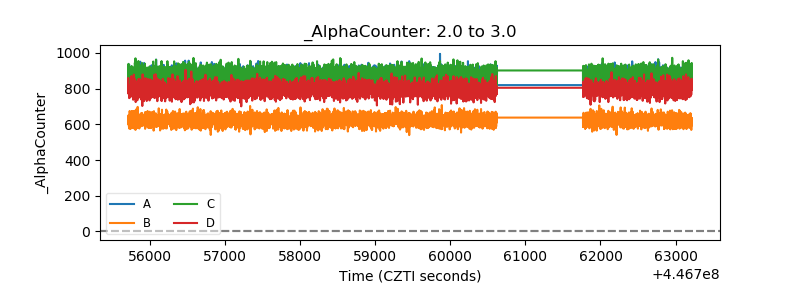 |
| _CPM_Rate | 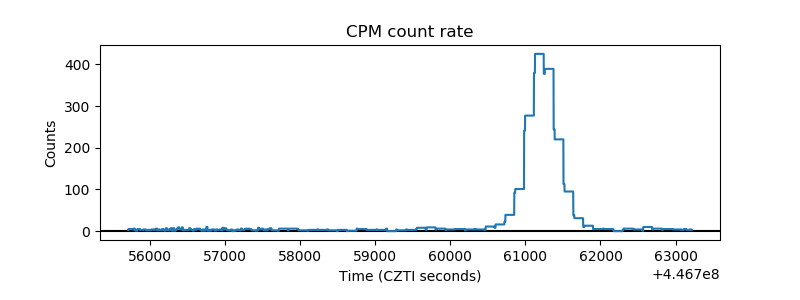 |
| CZT Counter | 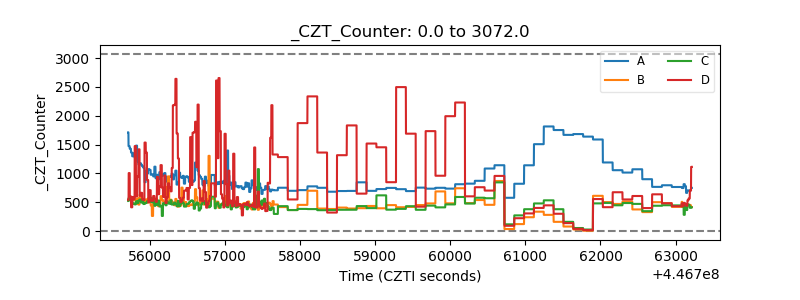 |
| +2.5 Volts monitor | 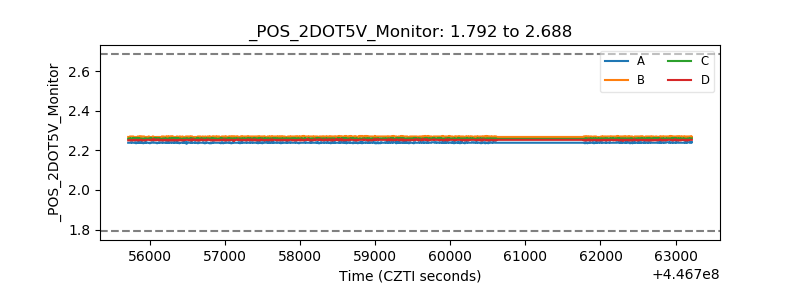 |
| +5 Volts monitor | 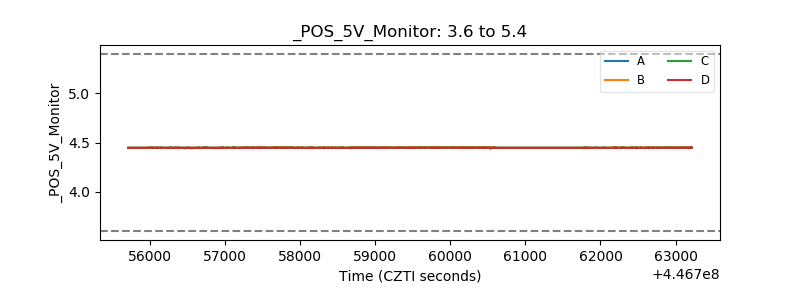 |
| _ROLL_ROT | 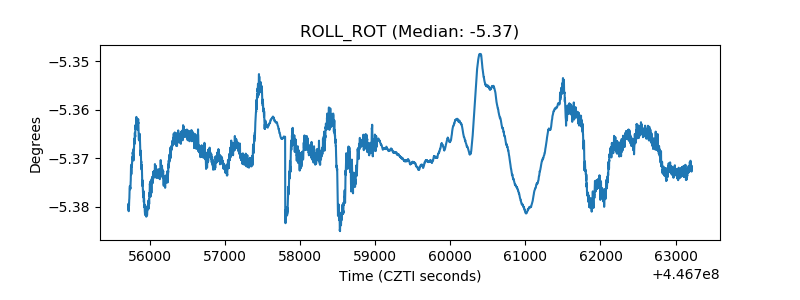 |
| _Roll_DEC | 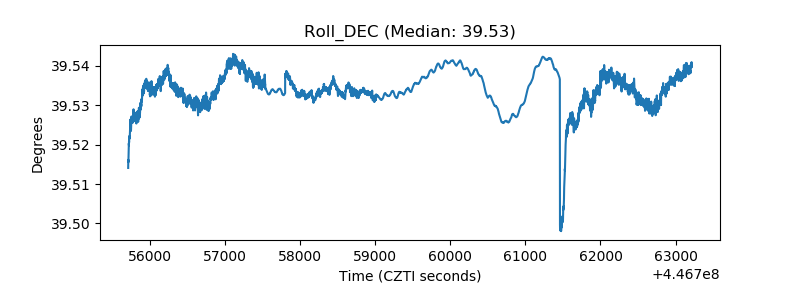 |
| _Roll_RA | 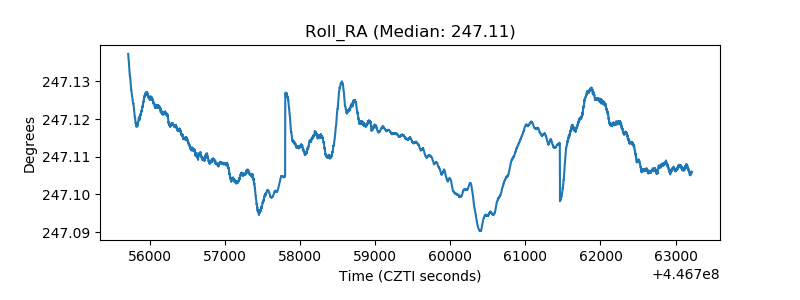 |
| Veto Counter | 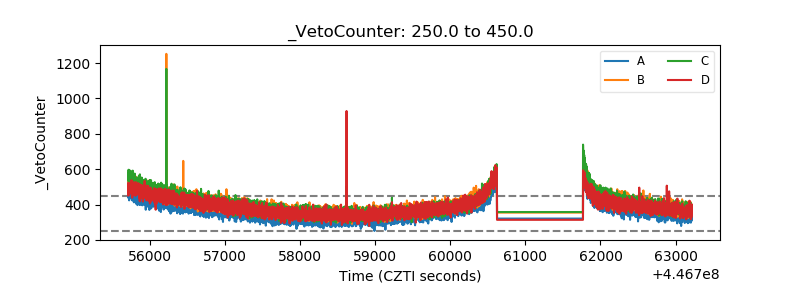 |