| Param | Original file | Final file |
|---|---|---|
| Filename | modeM0/AS1A13_031T01_9000006102_45520cztM0_level2.fits | modeM0/AS1A13_031T01_9000006102_45520cztM0_level2_quad_clean.evt |
| Size (bytes) | 472,432,320 | 113,227,200 |
| Size | 450.5 MB | 108.0 MB |
| Events in quadrant A | 5,872,586 | 744,692 |
| Events in quadrant B | 3,597,813 | 783,239 |
| Events in quadrant C | 3,034,664 | 761,026 |
| Events in quadrant D | 4,449,592 | 661,523 |
| Mode M0 | |||
|---|---|---|---|
| Quadrant | BADHDUFLAG | Total packets | Discarded packets |
| A | 0 | 22637 | 2 |
| B | 0 | 15367 | 2 |
| C | 0 | 14070 | 3 |
| D | 0 | 18038 | 2 |
| Mode M9 | |||
|---|---|---|---|
| Quadrant | BADHDUFLAG | Total packets | Discarded packets |
| A | 0 | 21 | 0 |
| B | 0 | 21 | 0 |
| C | 0 | 21 | 0 |
| D | 0 | 21 | 0 |
| Mode SS | |||
|---|---|---|---|
| Quadrant | BADHDUFLAG | Total packets | Discarded packets |
| A | 0 | 140 | 0 |
| B | 0 | 140 | 0 |
| C | 0 | 140 | 0 |
| D | 0 | 140 | 0 |
| Quadrant | Total seconds | Saturated seconds | Saturation percentage |
|---|---|---|---|
| A | 6867 | 280 | 4.077472% |
| B | 6867 | 157 | 2.286297% |
| C | 6866 | 29 | 0.422371% |
| D | 6866 | 406 | 5.913195% |
Noise dominated data is calculated using 1-second bins in cleaned event files. If a bin has >2000 counts, and if more than 50% of those come from <1% of pixels, then it is considered to be noise-dominated and hence unusable.
| Quadrant | # 1 sec bins | Bins with >0 counts | Bins with >2000 counts | High rate bins dominated by noise | Noise dominated (total time) | Noise dominated (detector-on time) | Marked lightcurve |
|---|---|---|---|---|---|---|---|
| A | 8872 | 6869 | 22 | 22 | 0.25% | 0.32% | 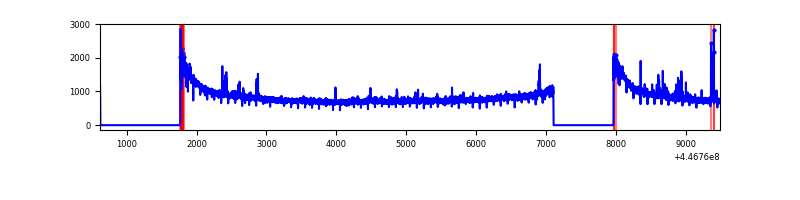 |
| B | 8872 | 6869 | 62 | 62 | 0.70% | 0.90% | 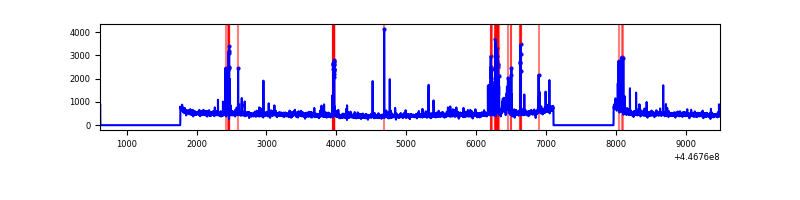 |
| C | 8871 | 6868 | 1 | 1 | 0.01% | 0.01% | 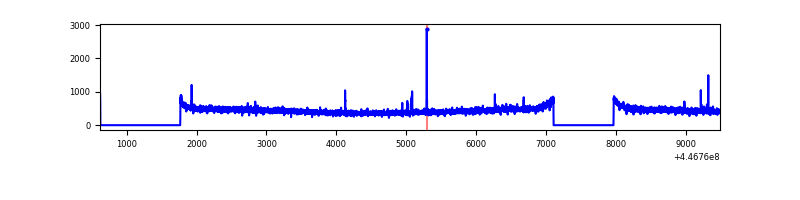 |
| D | 8871 | 6868 | 288 | 288 | 3.25% | 4.19% | 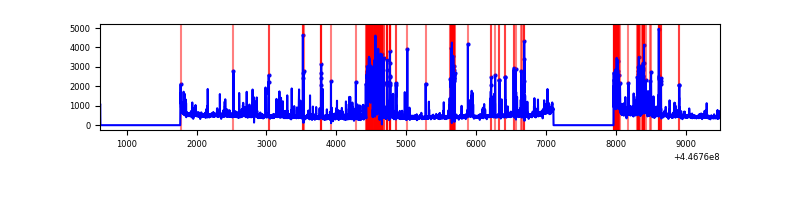 |
Top three noisy pixels from each quadrant. If the there are fewer than three noisy pixels in the level2.evt file, extra rows are filled as -1
| Pixel properties | Quadrant properties | ||||||
|---|---|---|---|---|---|---|---|
| Quadrant | DetID | PixID | Counts | Sigma | Mean | Median | Sigma |
| A | 10 | 83 | 2783617 | 17343.85 | 769 | 752 | 160.5 |
| A | 7 | 3 | 84911 | 524.51 | 769 | 752 | 160.5 |
| A | 13 | 248 | 11629 | 67.79 | 769 | 752 | 160.5 |
| B | 15 | 201 | 275264 | 1805.49 | 774 | 750 | 152.0 |
| B | 5 | 172 | 101436 | 662.22 | 774 | 750 | 152.0 |
| B | 0 | 183 | 45533 | 294.54 | 774 | 750 | 152.0 |
| C | 14 | 254 | 13173 | 68.38 | 772 | 774 | 181.3 |
| C | 2 | 14 | 12432 | 64.29 | 772 | 774 | 181.3 |
| C | 13 | 61 | 5319 | 25.07 | 772 | 774 | 181.3 |
| D | 13 | 249 | 737356 | 3892.26 | 748 | 728 | 189.3 |
| D | 1 | 52 | 285712 | 1505.82 | 748 | 728 | 189.3 |
| D | 2 | 249 | 239745 | 1262.94 | 748 | 728 | 189.3 |
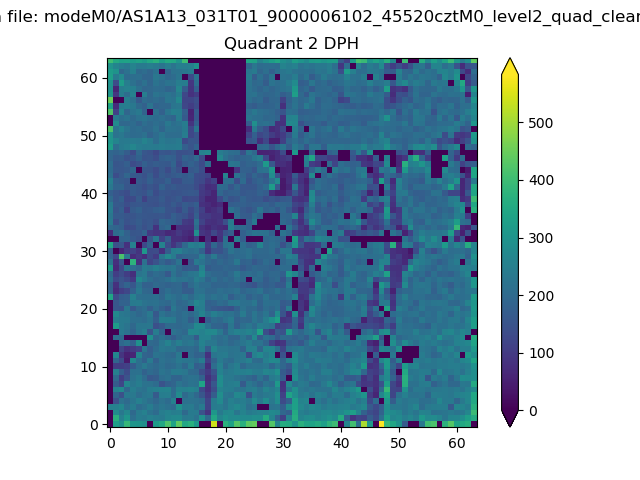
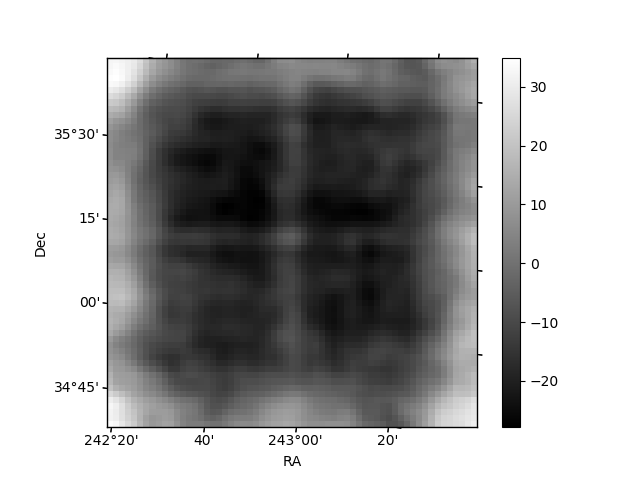
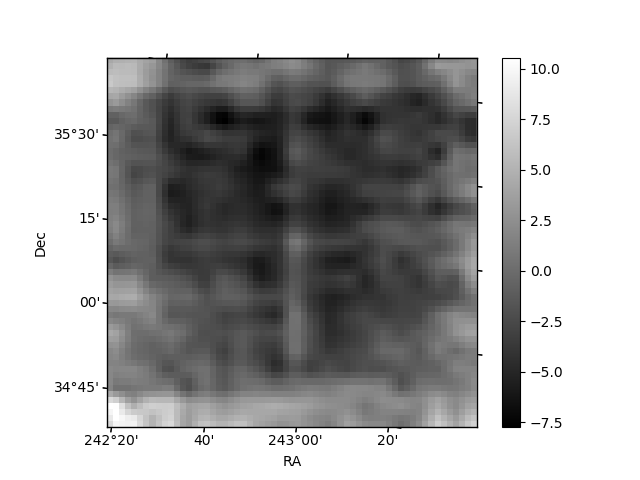
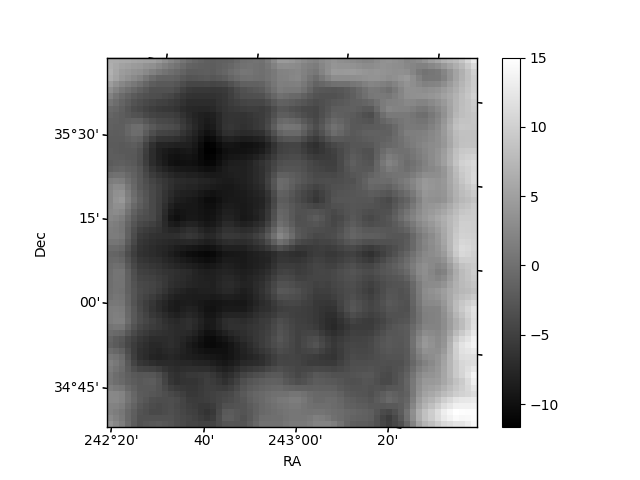
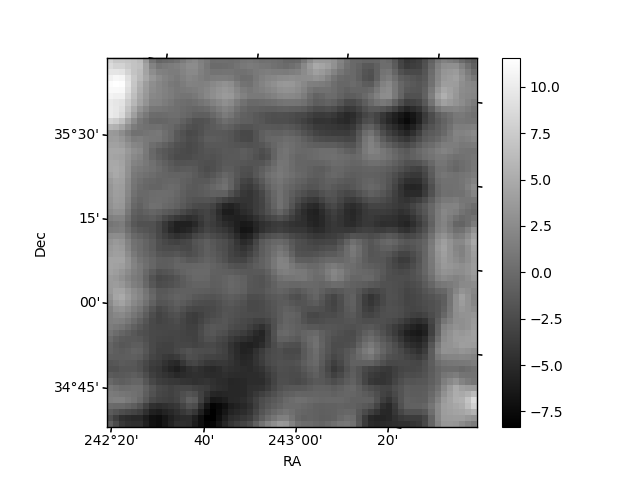
Histogram calculated using DETX and DETY for each event in the final _common_clean file
| Quadrant A | 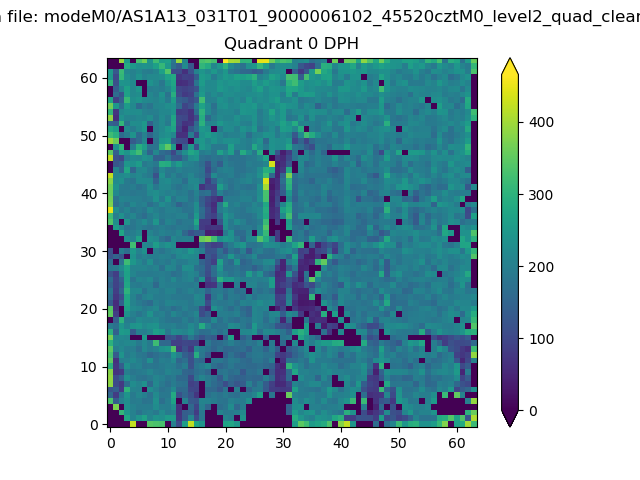 |
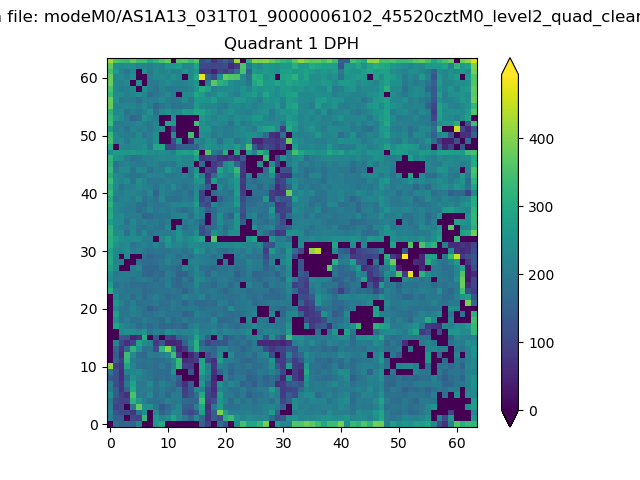 |
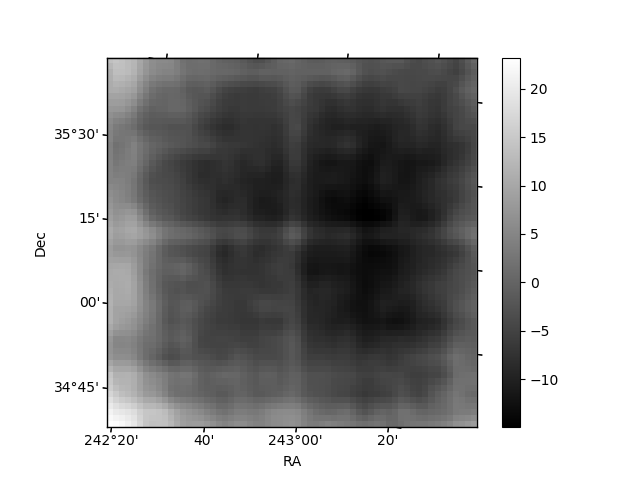
Quadrant B |
|---|---|---|---|
| Quadrant D | 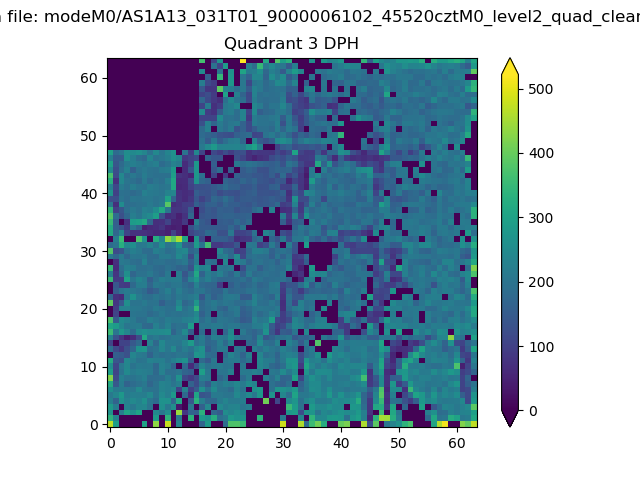 |
 |
Quadrant C |
| Plot type | Count rate plots | Images |
|---|---|---|
| Comparison with Poisson distribution Blue bars denote a histogram of data divided into 1 sec bins. Red curve is a Poisson curve with rate = median count rate of data. |
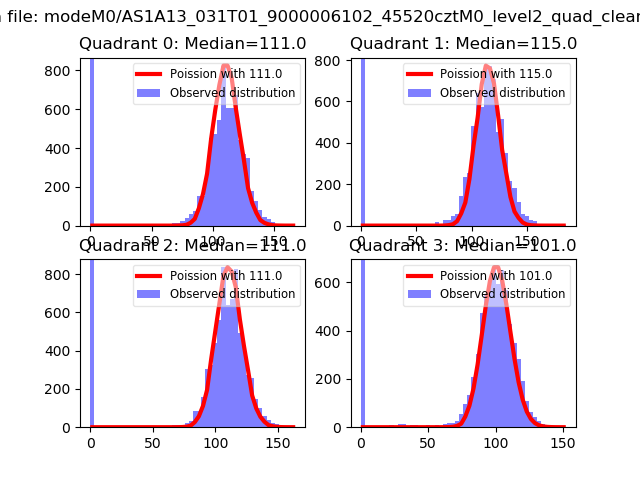 |
 |
| Quadrant-wise count rates Data is divided into 100 sec bins |
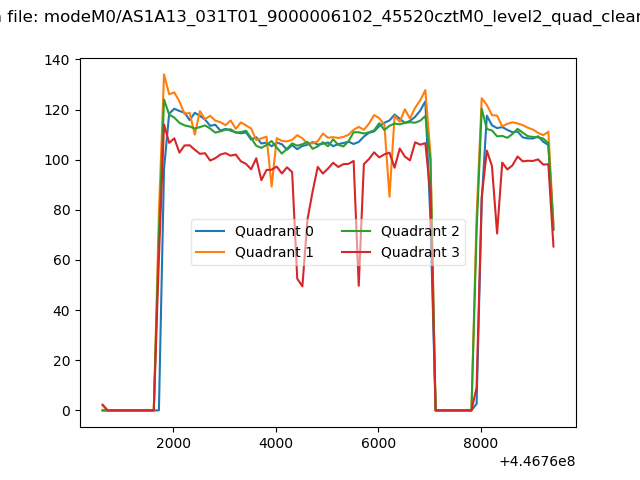 |
|
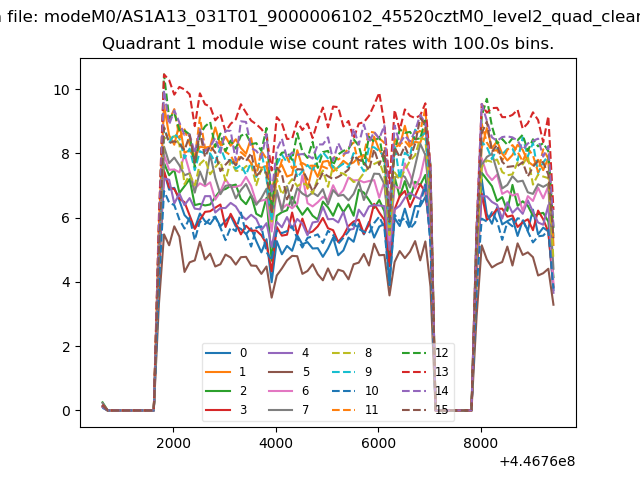
| Module-wise count rates for Quadrant A Data is divided into 100 sec bins |
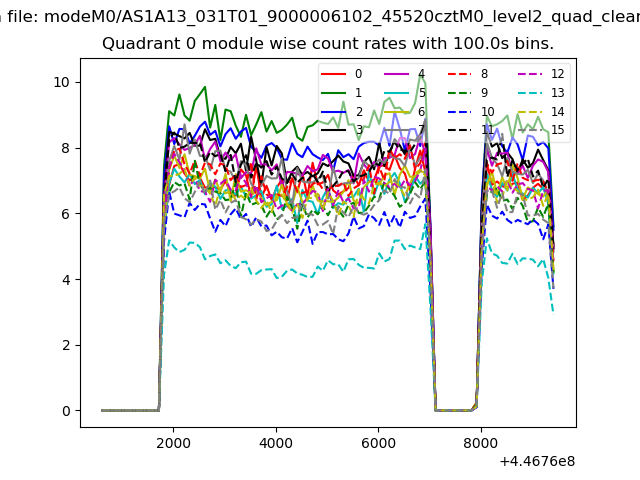 |
 |
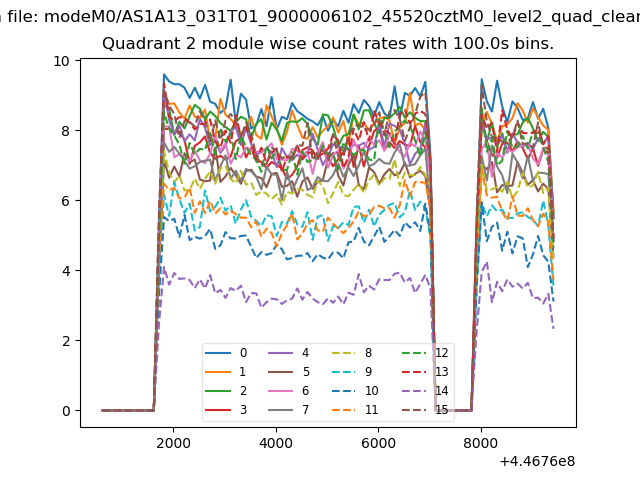
| Module-wise count rates for Quadrant B Data is divided into 100 sec bins |
 |
 |
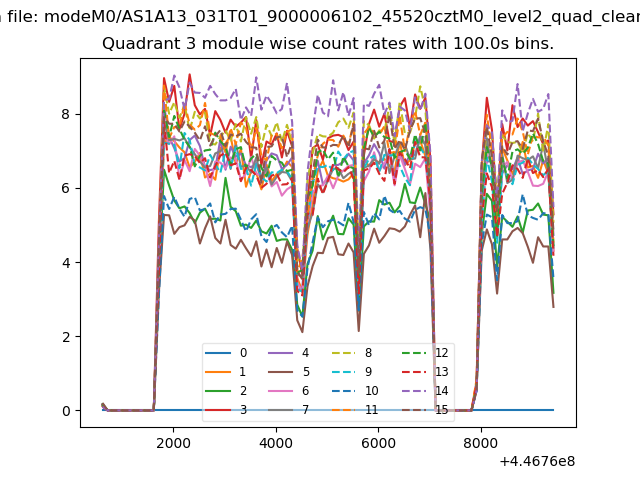
| Module-wise count rates for Quadrant C Data is divided into 100 sec bins |
 |
 |
| Module-wise count rates for Quadrant D Data is divided into 100 sec bins |
 |
 |
| Parameter | Plot |
|---|---|
| CZT HV Monitor | 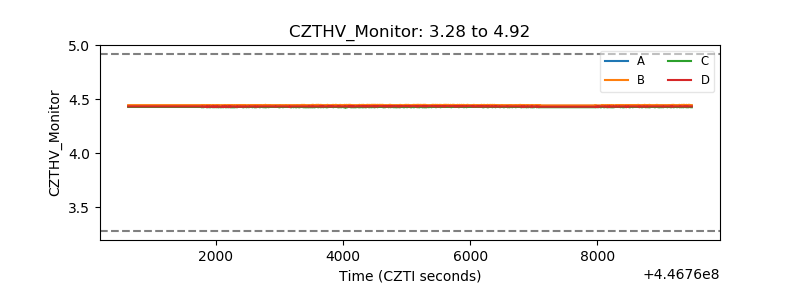 |
| D_VDD | 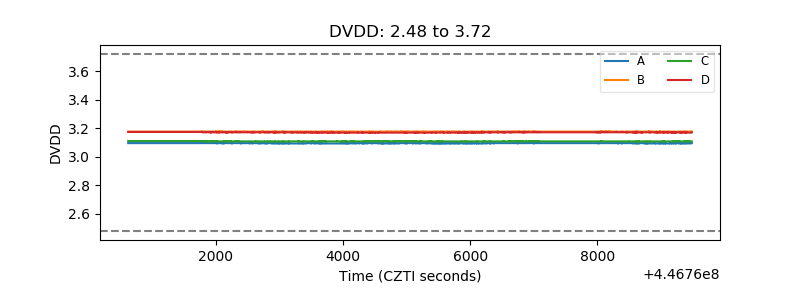 |
| Temperature 1 | 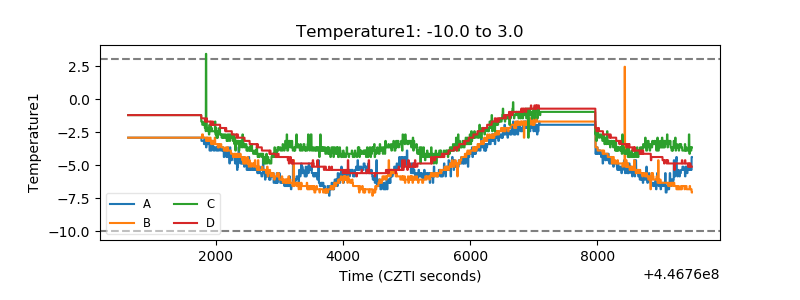 |
| Veto HV Monitor | 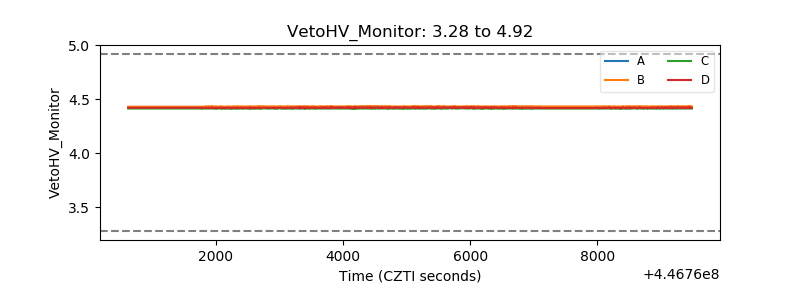 |
| Veto LLD | 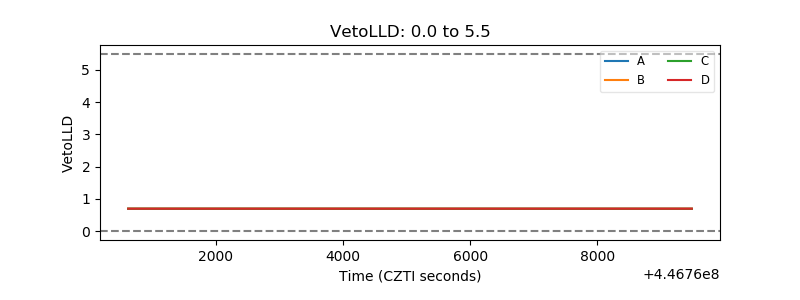 |
| Alpha Counter | 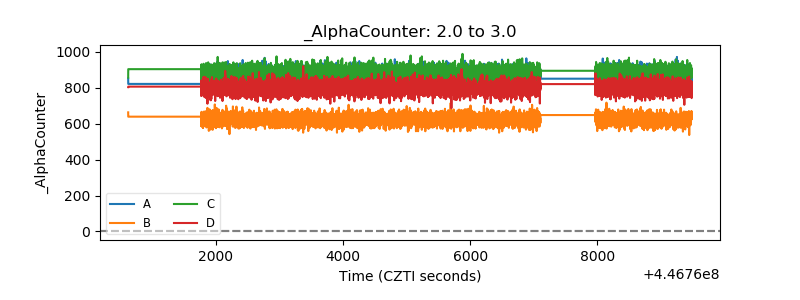 |
| _CPM_Rate |  |
| CZT Counter | 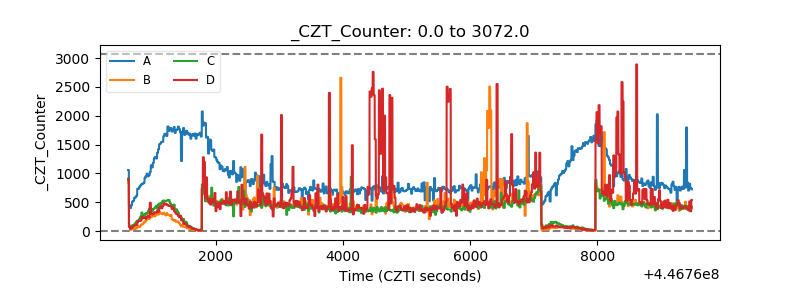 |
| +2.5 Volts monitor | 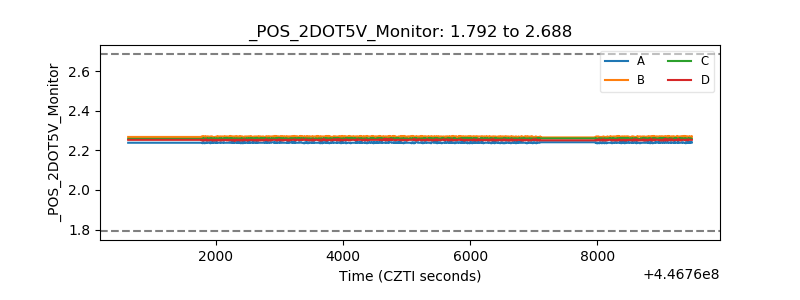 |
| +5 Volts monitor | 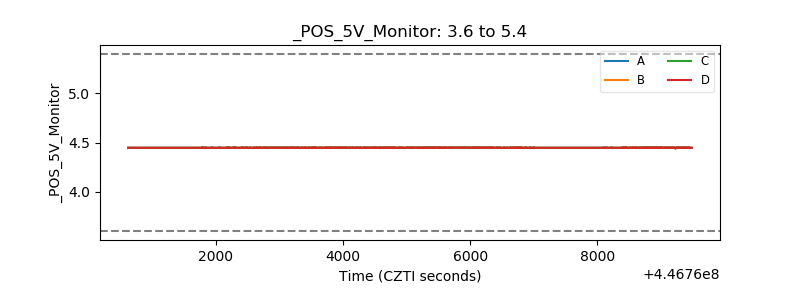 |
| _ROLL_ROT | 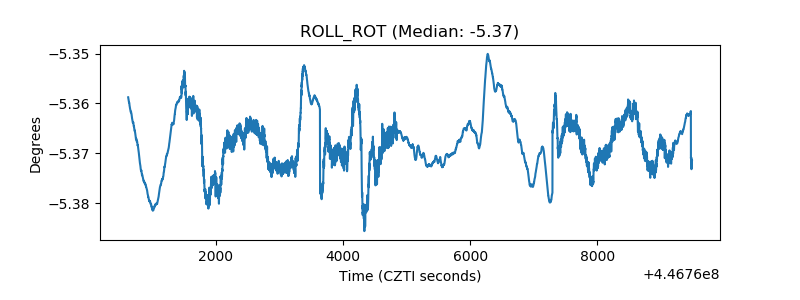 |
| _Roll_DEC | 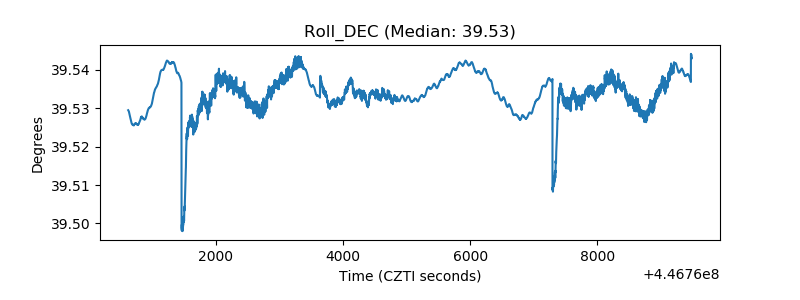 |
| _Roll_RA | 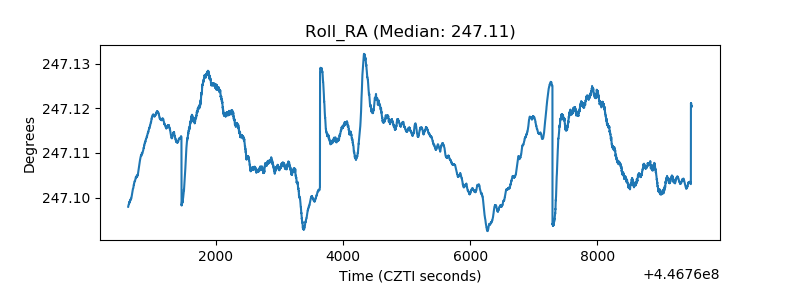 |
| Veto Counter | 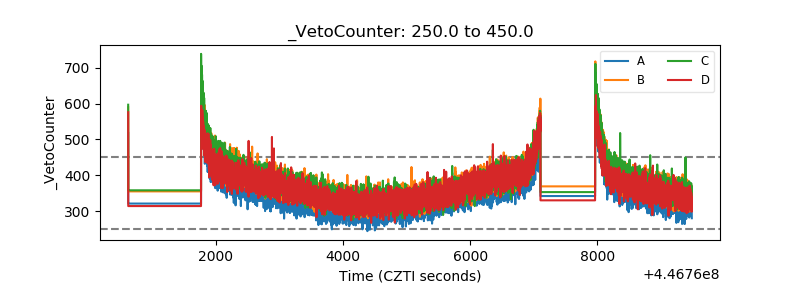 |