| Param | Original file | Final file |
|---|---|---|
| Filename | modeM0/AS1A13_031T01_9000006102_45521cztM0_level2.fits | modeM0/AS1A13_031T01_9000006102_45521cztM0_level2_quad_clean.evt |
| Size (bytes) | 488,825,280 | 115,041,600 |
| Size | 466.2 MB | 109.7 MB |
| Events in quadrant A | 5,974,083 | 764,820 |
| Events in quadrant B | 3,795,832 | 775,950 |
| Events in quadrant C | 3,095,602 | 767,091 |
| Events in quadrant D | 4,676,423 | 679,828 |
| Mode M0 | |||
|---|---|---|---|
| Quadrant | BADHDUFLAG | Total packets | Discarded packets |
| A | 0 | 22948 | 1 |
| B | 0 | 16302 | 1 |
| C | 0 | 14547 | 1 |
| D | 0 | 19033 | 1 |
| Mode M9 | |||
|---|---|---|---|
| Quadrant | BADHDUFLAG | Total packets | Discarded packets |
| A | 0 | 4 | 0 |
| B | 0 | 4 | 0 |
| C | 0 | 4 | 0 |
| D | 0 | 4 | 0 |
| Mode SS | |||
|---|---|---|---|
| Quadrant | BADHDUFLAG | Total packets | Discarded packets |
| A | 0 | 144 | 0 |
| B | 0 | 144 | 0 |
| C | 0 | 144 | 0 |
| D | 0 | 144 | 0 |
| Quadrant | Total seconds | Saturated seconds | Saturation percentage |
|---|---|---|---|
| A | 7119 | 186 | 2.612727% |
| B | 7119 | 273 | 3.834808% |
| C | 7119 | 17 | 0.238798% |
| D | 7120 | 288 | 4.044944% |
Noise dominated data is calculated using 1-second bins in cleaned event files. If a bin has >2000 counts, and if more than 50% of those come from <1% of pixels, then it is considered to be noise-dominated and hence unusable.
| Quadrant | # 1 sec bins | Bins with >0 counts | Bins with >2000 counts | High rate bins dominated by noise | Noise dominated (total time) | Noise dominated (detector-on time) | Marked lightcurve |
|---|---|---|---|---|---|---|---|
| A | 7524 | 7122 | 23 | 23 | 0.31% | 0.32% | 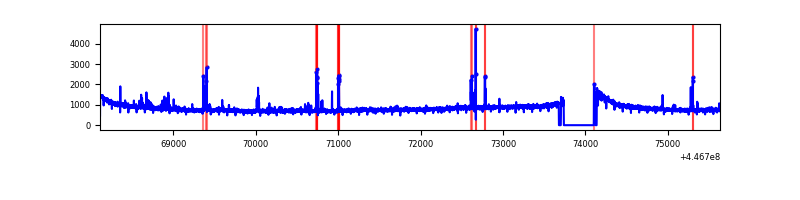 |
| B | 7524 | 7122 | 142 | 142 | 1.89% | 1.99% | 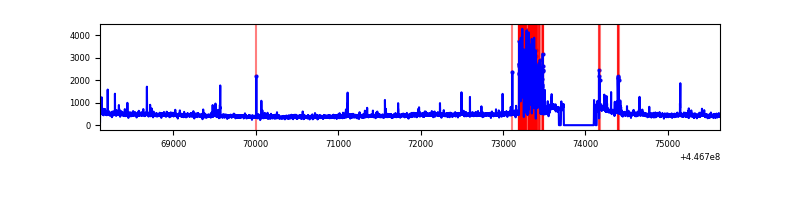 |
| C | 7524 | 7122 | 0 | 0 | 0.00% | 0.00% | 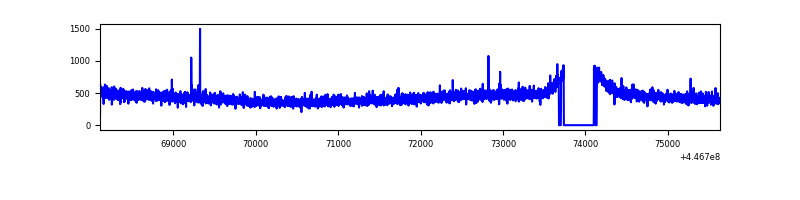 |
| D | 7525 | 7123 | 257 | 257 | 3.42% | 3.61% | 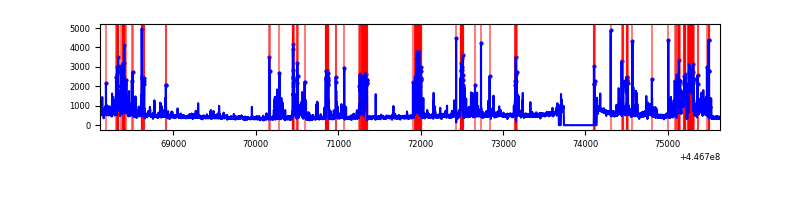 |
Top three noisy pixels from each quadrant. If the there are fewer than three noisy pixels in the level2.evt file, extra rows are filled as -1
| Pixel properties | Quadrant properties | ||||||
|---|---|---|---|---|---|---|---|
| Quadrant | DetID | PixID | Counts | Sigma | Mean | Median | Sigma |
| A | 10 | 83 | 2741636 | 16604.14 | 792 | 776 | 165.1 |
| A | 7 | 3 | 117446 | 706.79 | 792 | 776 | 165.1 |
| A | 13 | 248 | 34905 | 206.75 | 792 | 776 | 165.1 |
| B | 0 | 189 | 312932 | 2006.41 | 785 | 760 | 155.6 |
| B | 15 | 201 | 226813 | 1452.9 | 785 | 760 | 155.6 |
| B | 5 | 172 | 73322 | 466.38 | 785 | 760 | 155.6 |
| C | 2 | 14 | 8036 | 38.76 | 790 | 793 | 186.8 |
| C | 13 | 61 | 5285 | 24.04 | 790 | 793 | 186.8 |
| C | 0 | 239 | 3593 | 14.99 | 790 | 793 | 186.8 |
| D | 13 | 249 | 756877 | 3866.0 | 773 | 747 | 195.6 |
| D | 5 | 222 | 307821 | 1570.03 | 773 | 747 | 195.6 |
| D | 2 | 249 | 146970 | 747.62 | 773 | 747 | 195.6 |
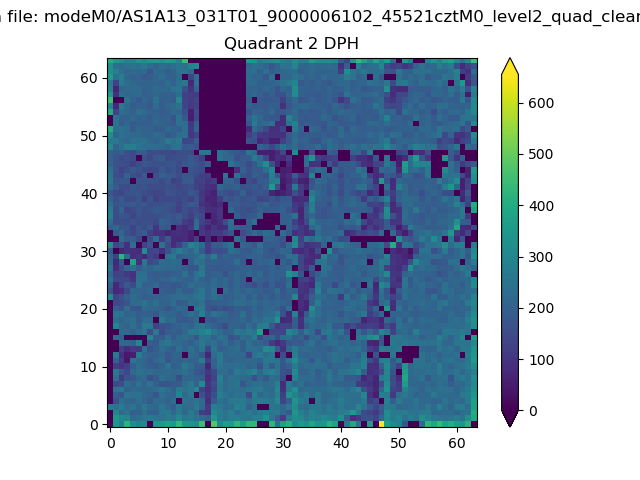
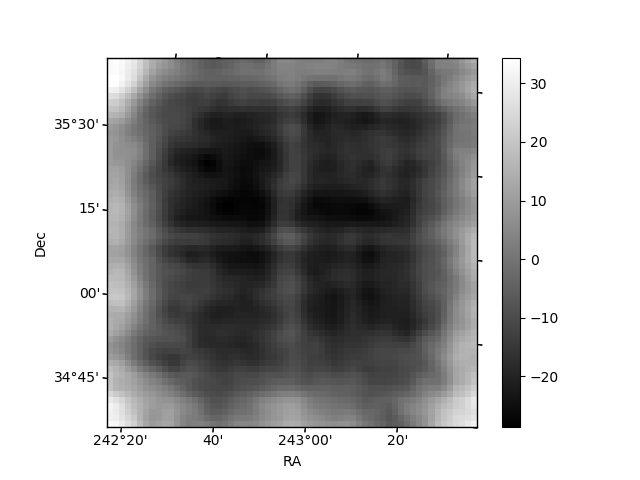
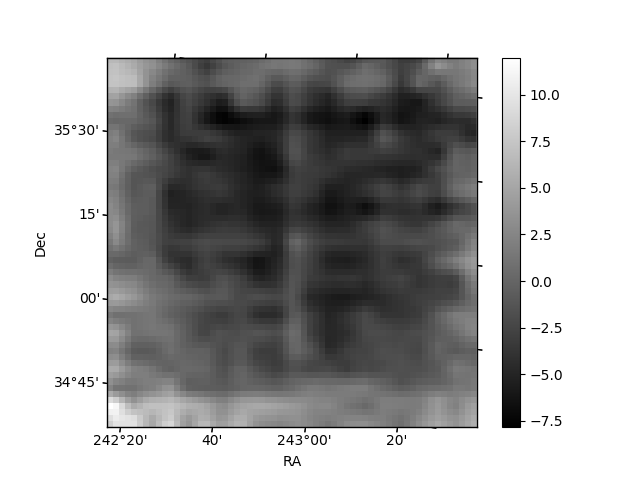
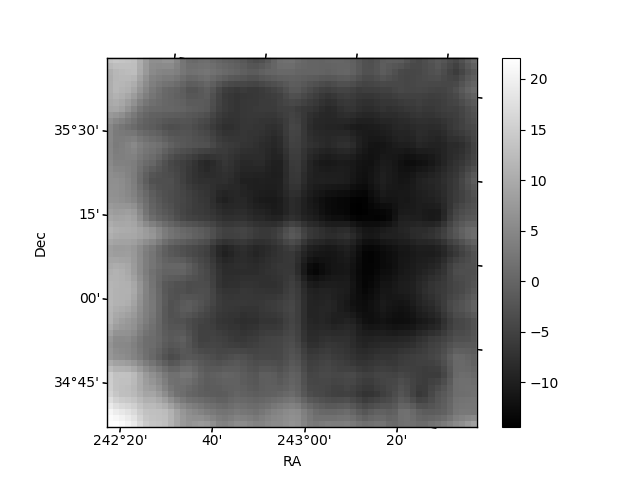
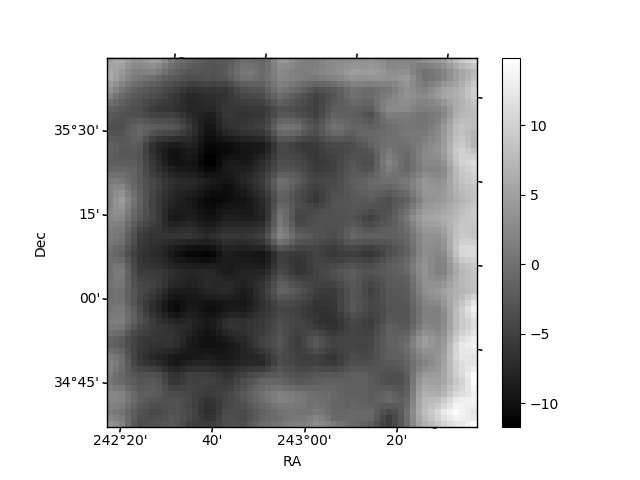
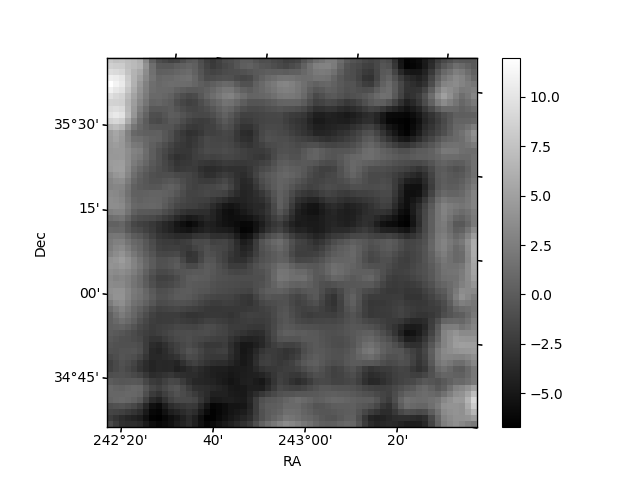
Histogram calculated using DETX and DETY for each event in the final _common_clean file
| Quadrant A | 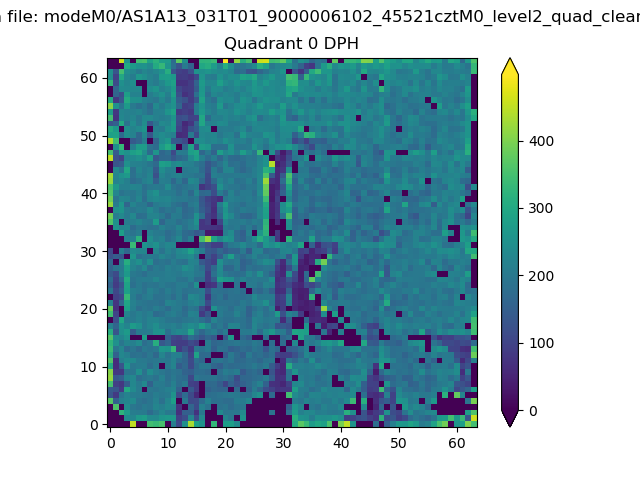 |
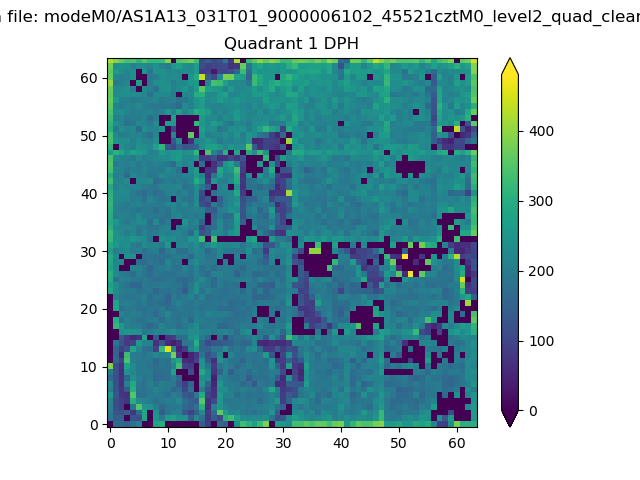 |
Quadrant B |
|---|---|---|---|
| Quadrant D | 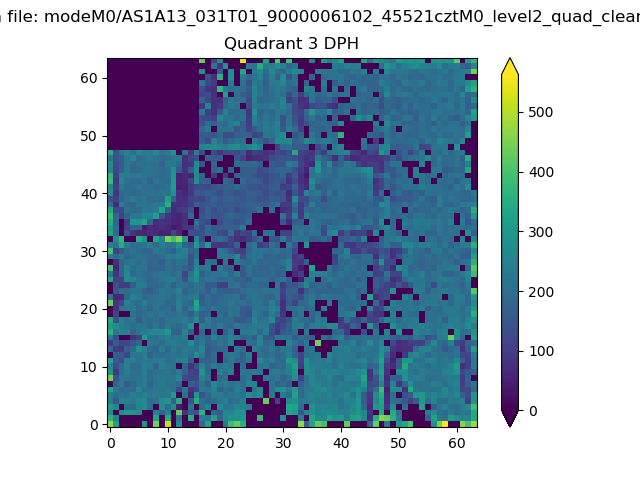 |
 |
Quadrant C |
| Plot type | Count rate plots | Images |
|---|---|---|
| Comparison with Poisson distribution Blue bars denote a histogram of data divided into 1 sec bins. Red curve is a Poisson curve with rate = median count rate of data. |
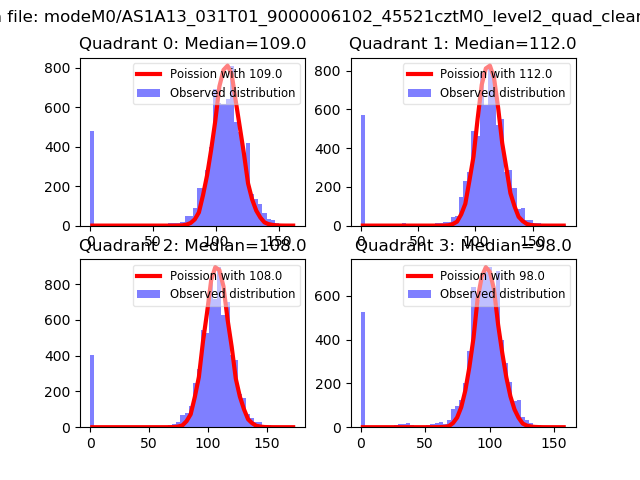 |
 |
| Quadrant-wise count rates Data is divided into 100 sec bins |
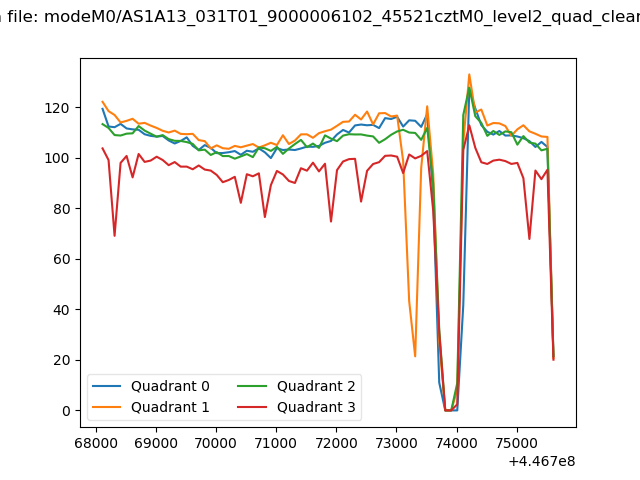 |
|
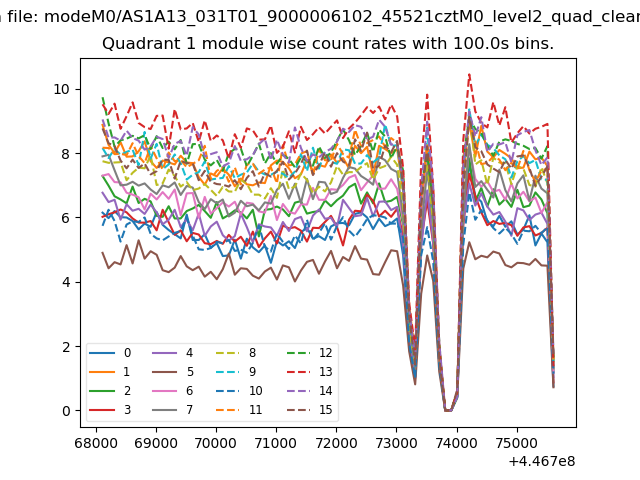
| Module-wise count rates for Quadrant A Data is divided into 100 sec bins |
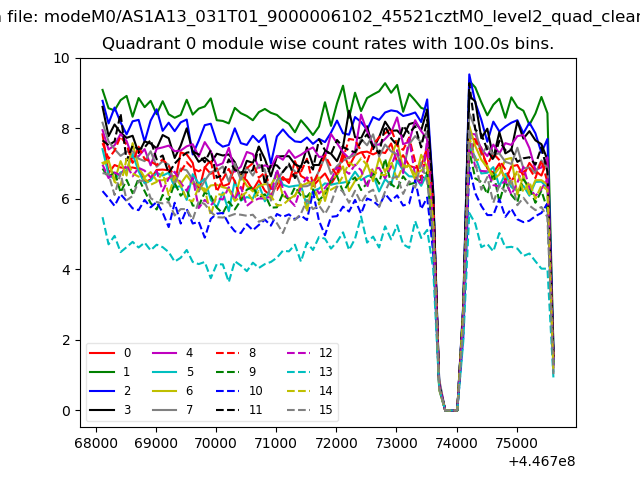 |
 |
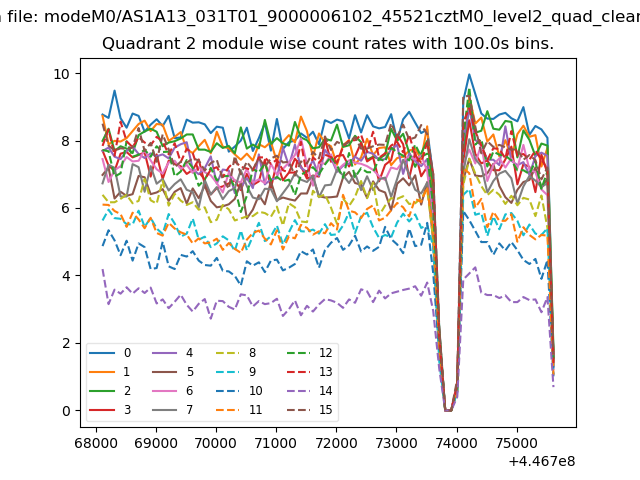
| Module-wise count rates for Quadrant B Data is divided into 100 sec bins |
 |
 |
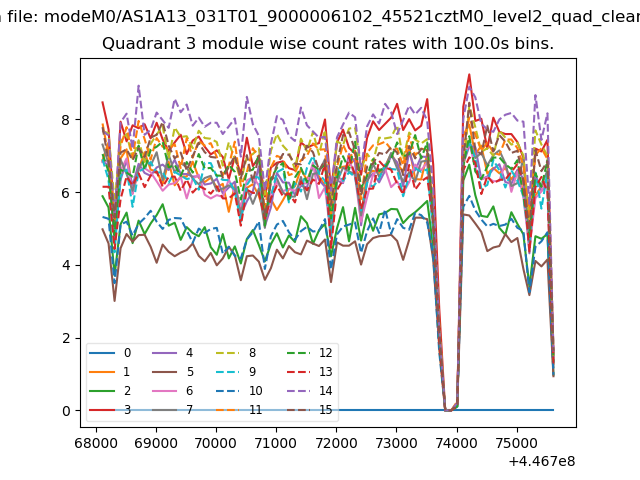
| Module-wise count rates for Quadrant C Data is divided into 100 sec bins |
 |
 |
| Module-wise count rates for Quadrant D Data is divided into 100 sec bins |
 |
 |
| Parameter | Plot |
|---|---|
| CZT HV Monitor | 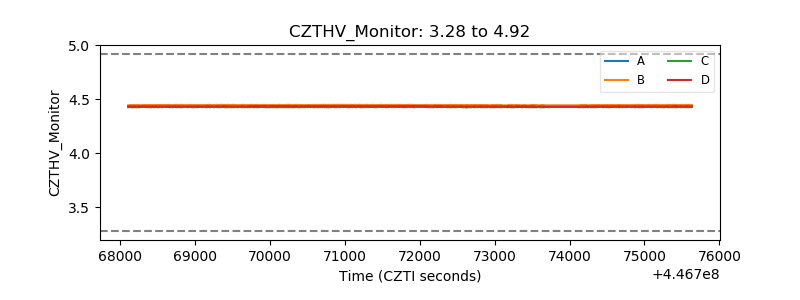 |
| D_VDD | 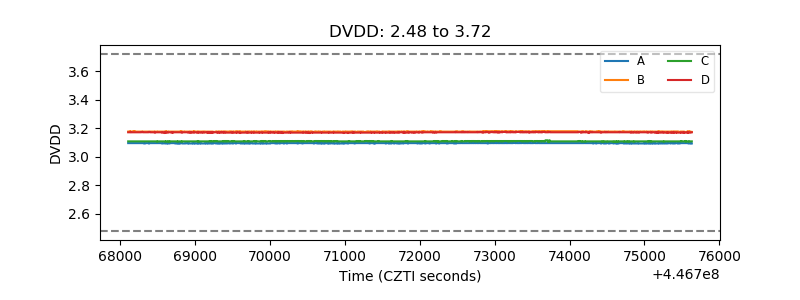 |
| Temperature 1 | 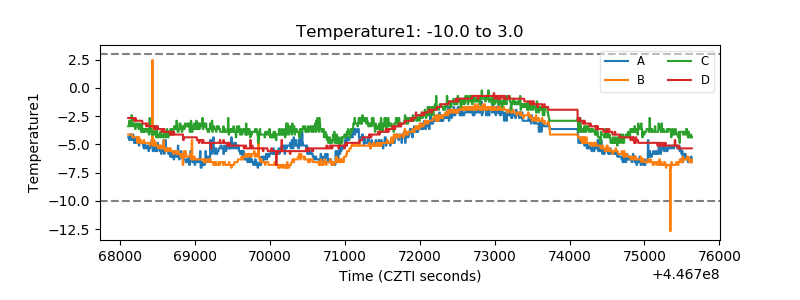 |
| Veto HV Monitor | 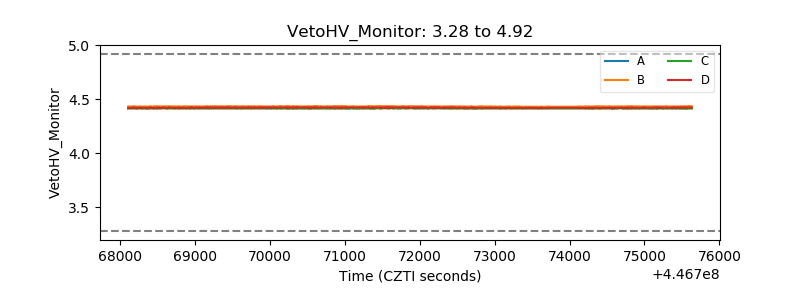 |
| Veto LLD | 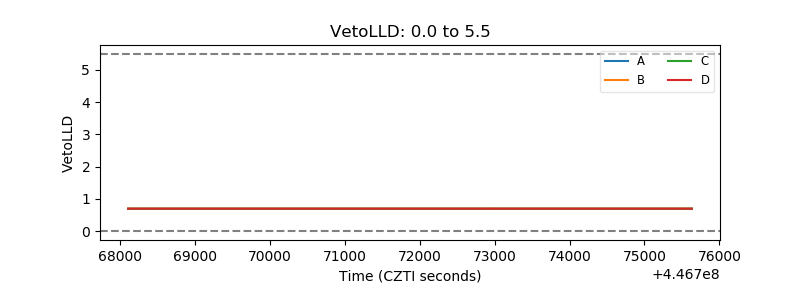 |
| Alpha Counter | 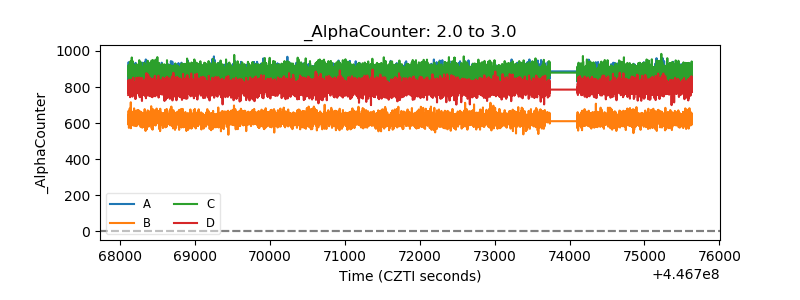 |
| _CPM_Rate | 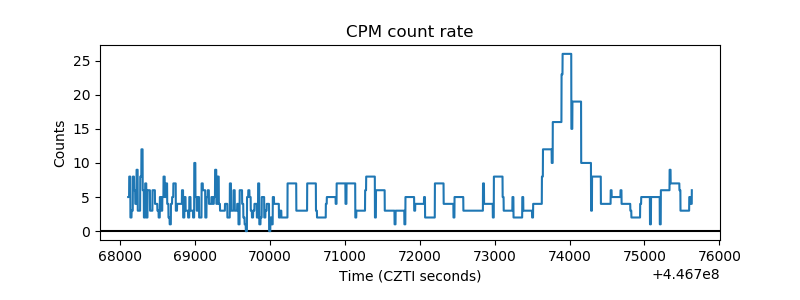 |
| CZT Counter | 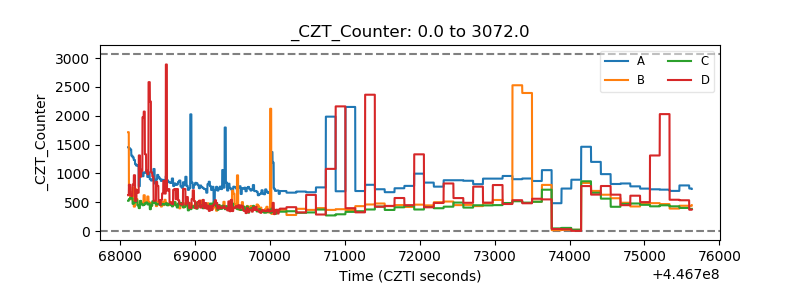 |
| +2.5 Volts monitor | 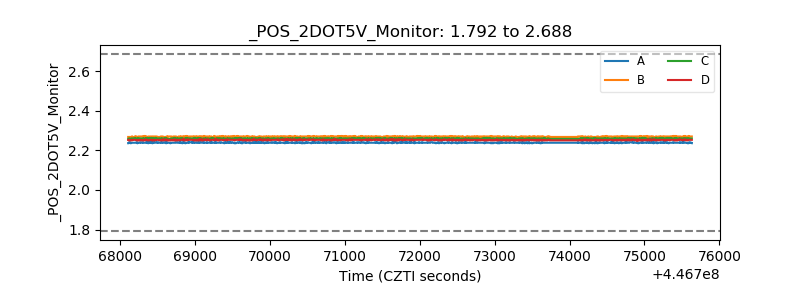 |
| +5 Volts monitor | 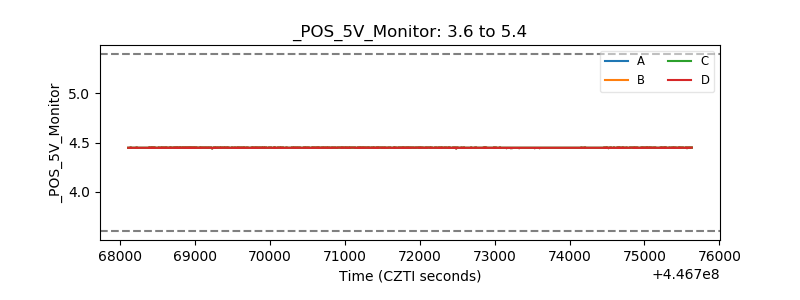 |
| _ROLL_ROT | 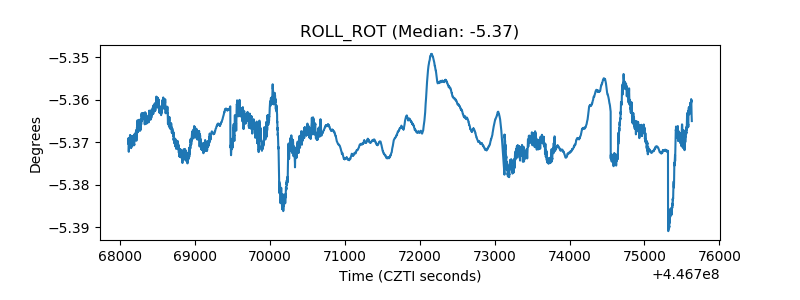 |
| _Roll_DEC | 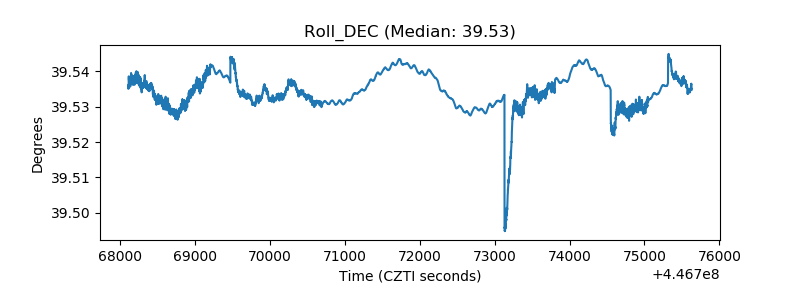 |
| _Roll_RA | 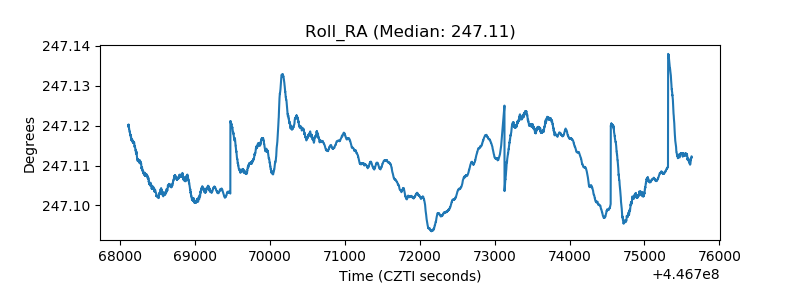 |
| Veto Counter | 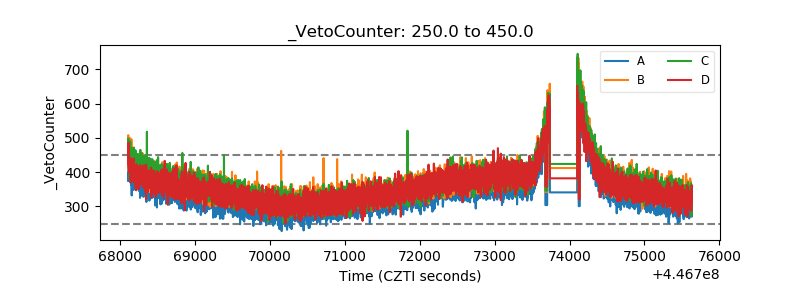 |