| Param | Original file | Final file |
|---|---|---|
| Filename | modeM0/AS1A13_031T01_9000006102_45522cztM0_level2.fits | modeM0/AS1A13_031T01_9000006102_45522cztM0_level2_quad_clean.evt |
| Size (bytes) | 604,382,400 | 127,843,200 |
| Size | 576.4 MB | 121.9 MB |
| Events in quadrant A | 6,799,483 | 874,976 |
| Events in quadrant B | 4,264,278 | 901,607 |
| Events in quadrant C | 3,630,275 | 875,622 |
| Events in quadrant D | 7,045,346 | 652,285 |
| Mode M0 | |||
|---|---|---|---|
| Quadrant | BADHDUFLAG | Total packets | Discarded packets |
| A | 0 | 26176 | 1 |
| B | 0 | 18513 | 1 |
| C | 0 | 17042 | 1 |
| D | 0 | 26933 | 1 |
| Mode M9 | |||
|---|---|---|---|
| Quadrant | BADHDUFLAG | Total packets | Discarded packets |
| A | 0 | 4 | 0 |
| B | 0 | 4 | 0 |
| C | 0 | 4 | 0 |
| D | 0 | 4 | 0 |
| Mode SS | |||
|---|---|---|---|
| Quadrant | BADHDUFLAG | Total packets | Discarded packets |
| A | 0 | 164 | 0 |
| B | 0 | 164 | 0 |
| C | 0 | 164 | 0 |
| D | 0 | 164 | 0 |
| Quadrant | Total seconds | Saturated seconds | Saturation percentage |
|---|---|---|---|
| A | 8153 | 198 | 2.428554% |
| B | 8153 | 213 | 2.612535% |
| C | 8154 | 22 | 0.269806% |
| D | 8154 | 1542 | 18.910964% |
Noise dominated data is calculated using 1-second bins in cleaned event files. If a bin has >2000 counts, and if more than 50% of those come from <1% of pixels, then it is considered to be noise-dominated and hence unusable.
| Quadrant | # 1 sec bins | Bins with >0 counts | Bins with >2000 counts | High rate bins dominated by noise | Noise dominated (total time) | Noise dominated (detector-on time) | Marked lightcurve |
|---|---|---|---|---|---|---|---|
| A | 8558 | 8156 | 13 | 13 | 0.15% | 0.16% | 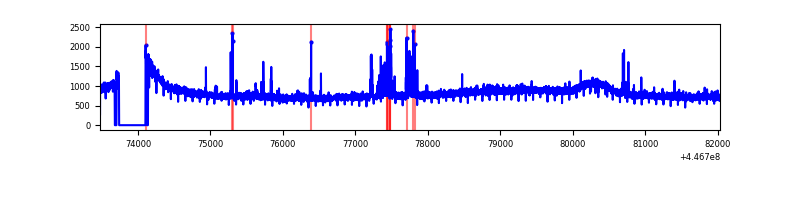 |
| B | 8558 | 8156 | 83 | 83 | 0.97% | 1.02% | 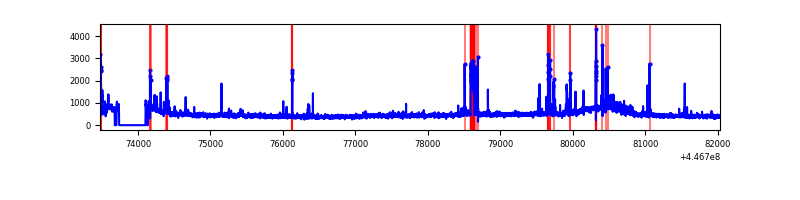 |
| C | 8559 | 8157 | 1 | 1 | 0.01% | 0.01% | 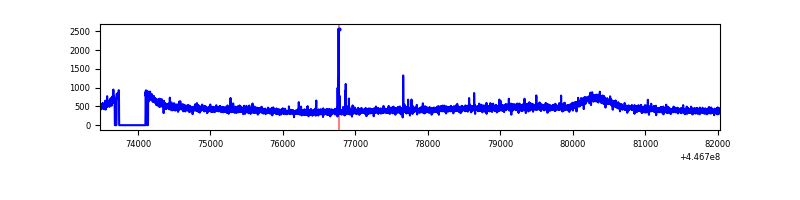 |
| D | 8559 | 8157 | 774 | 774 | 9.04% | 9.49% | 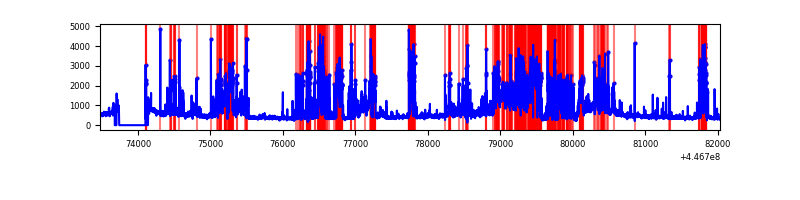 |
Top three noisy pixels from each quadrant. If the there are fewer than three noisy pixels in the level2.evt file, extra rows are filled as -1
| Pixel properties | Quadrant properties | ||||||
|---|---|---|---|---|---|---|---|
| Quadrant | DetID | PixID | Counts | Sigma | Mean | Median | Sigma |
| A | 10 | 83 | 2995069 | 15304.98 | 929 | 909 | 195.6 |
| A | 7 | 3 | 185384 | 942.96 | 929 | 909 | 195.6 |
| A | 13 | 254 | 12369 | 58.58 | 929 | 909 | 195.6 |
| B | 15 | 201 | 177632 | 949.31 | 931 | 902 | 186.2 |
| B | 5 | 172 | 160939 | 859.64 | 931 | 902 | 186.2 |
| B | 12 | 18 | 96689 | 514.52 | 931 | 902 | 186.2 |
| C | 11 | 16 | 16960 | 73.36 | 924 | 929 | 218.5 |
| C | 14 | 254 | 6492 | 25.46 | 924 | 929 | 218.5 |
| C | 13 | 61 | 6093 | 23.63 | 924 | 929 | 218.5 |
| D | 13 | 249 | 2508871 | 12274.57 | 799 | 774 | 204.3 |
| D | 5 | 171 | 769498 | 3762.12 | 799 | 774 | 204.3 |
| D | 5 | 222 | 373934 | 1826.24 | 799 | 774 | 204.3 |
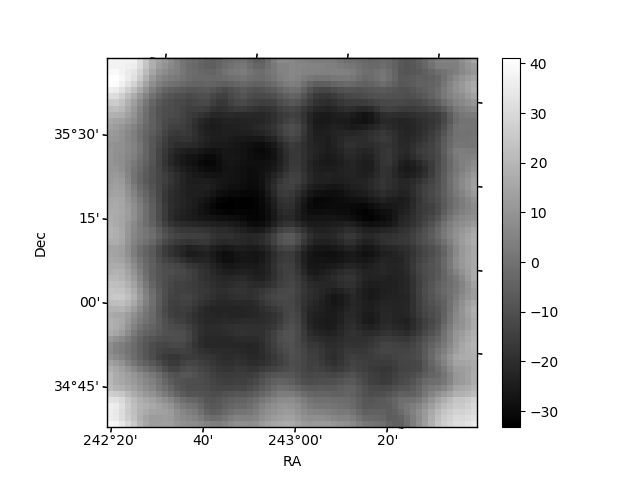
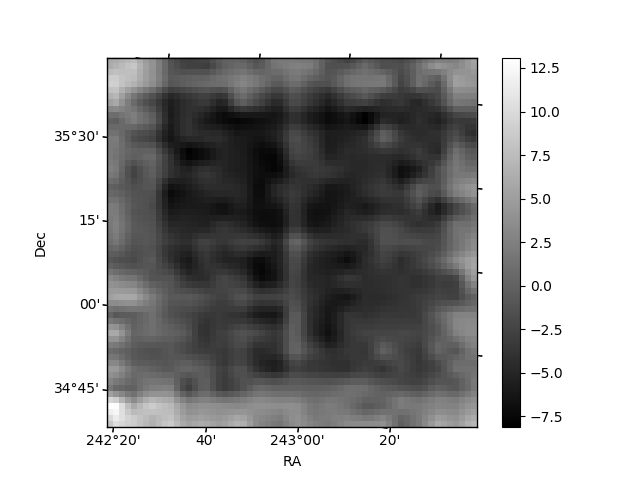
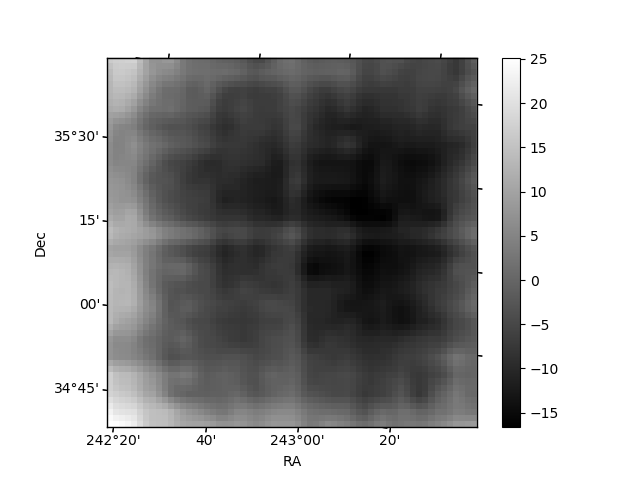
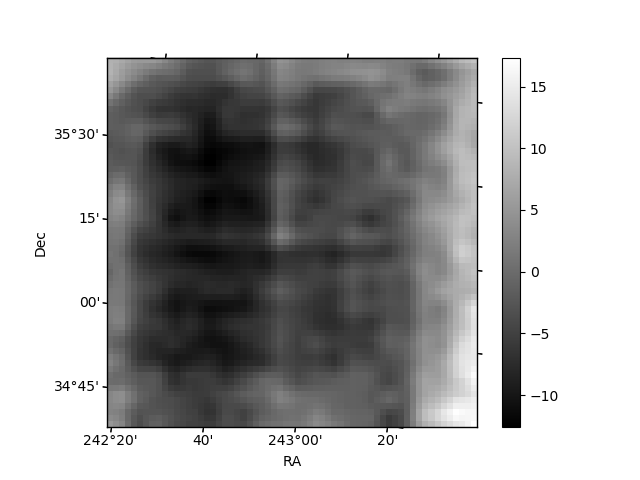
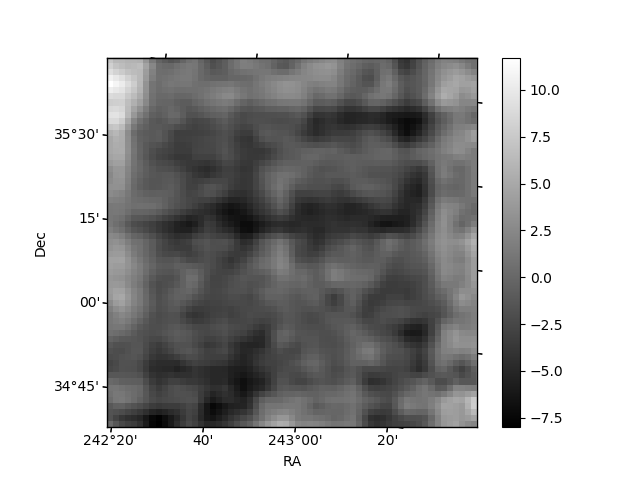
Histogram calculated using DETX and DETY for each event in the final _common_clean file
| Quadrant A | 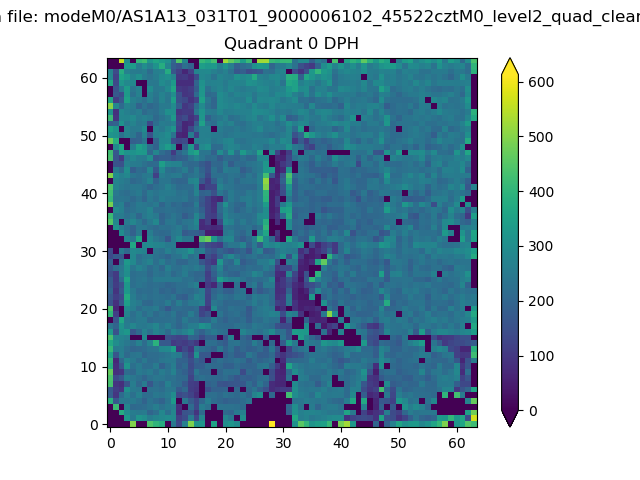 |
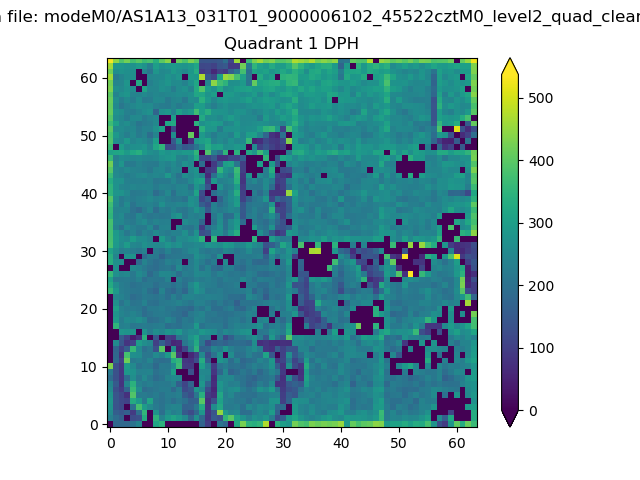 |
Quadrant B |
|---|---|---|---|
| Quadrant D | 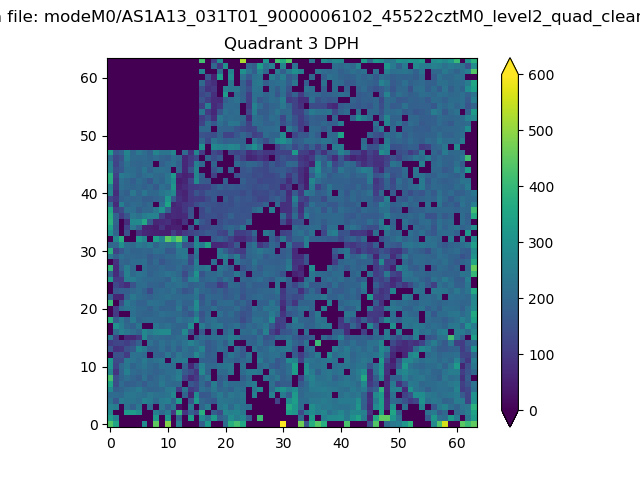 |
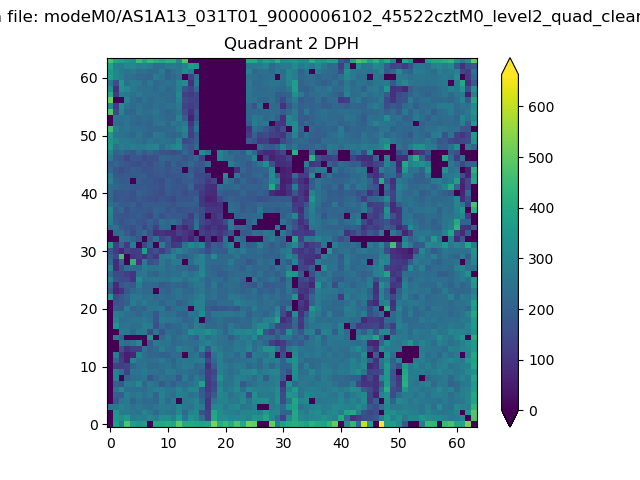 |
Quadrant C |
| Plot type | Count rate plots | Images |
|---|---|---|
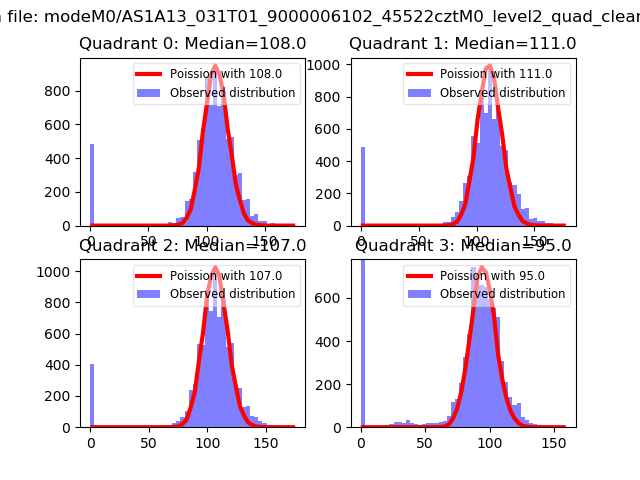
| Comparison with Poisson distribution Blue bars denote a histogram of data divided into 1 sec bins. Red curve is a Poisson curve with rate = median count rate of data. |
 |
 |
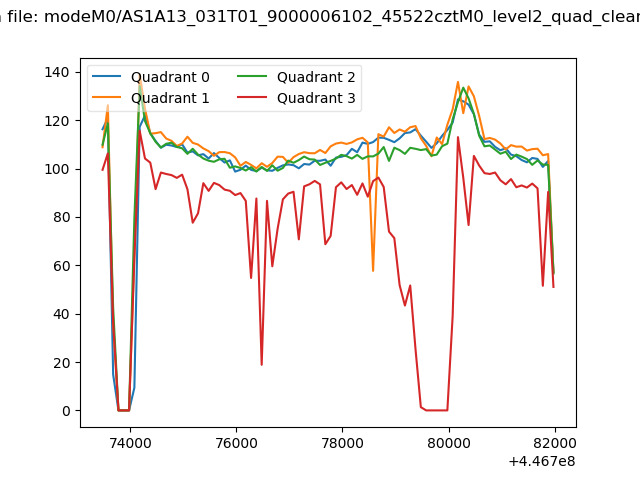
| Quadrant-wise count rates Data is divided into 100 sec bins |
 |
|
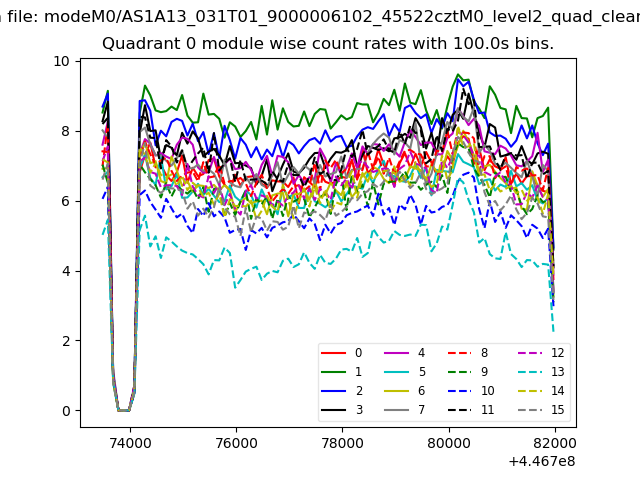
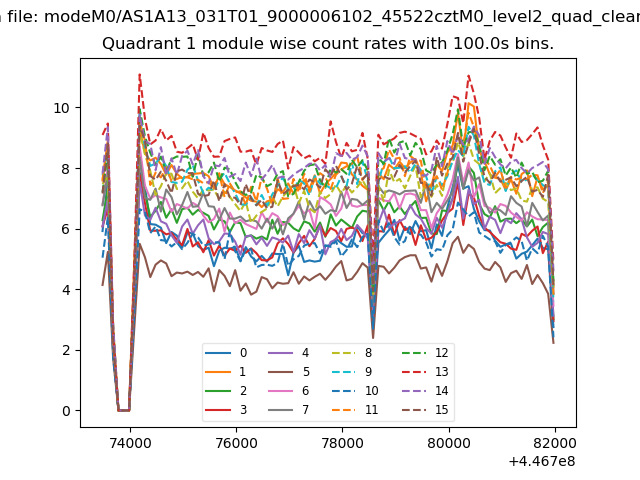
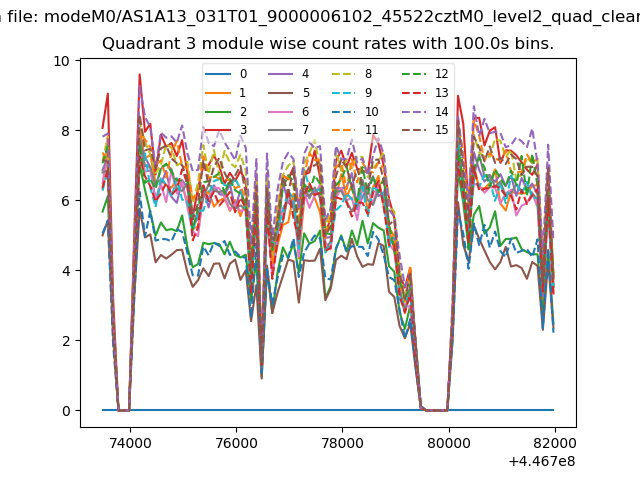
| Module-wise count rates for Quadrant A Data is divided into 100 sec bins |
 |
 |
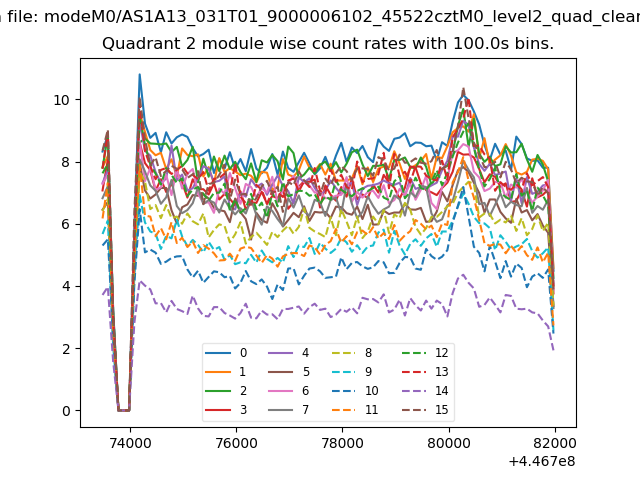
| Module-wise count rates for Quadrant B Data is divided into 100 sec bins |
 |
 |
| Module-wise count rates for Quadrant C Data is divided into 100 sec bins |
 |
 |
| Module-wise count rates for Quadrant D Data is divided into 100 sec bins |
 |
 |
| Parameter | Plot |
|---|---|
| CZT HV Monitor | 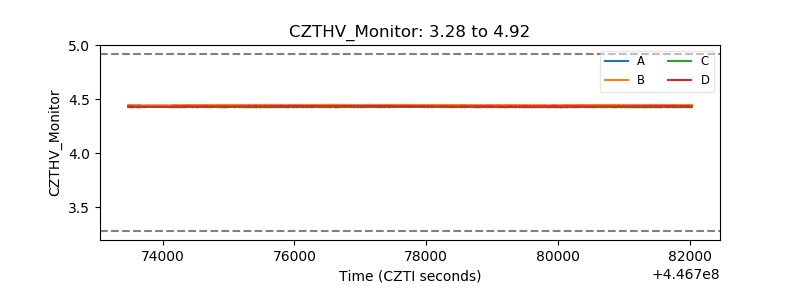 |
| D_VDD | 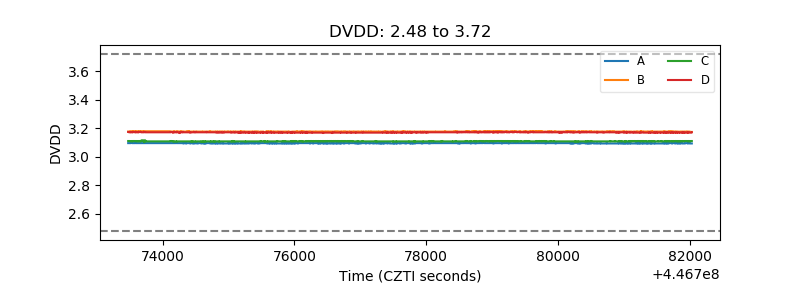 |
| Temperature 1 | 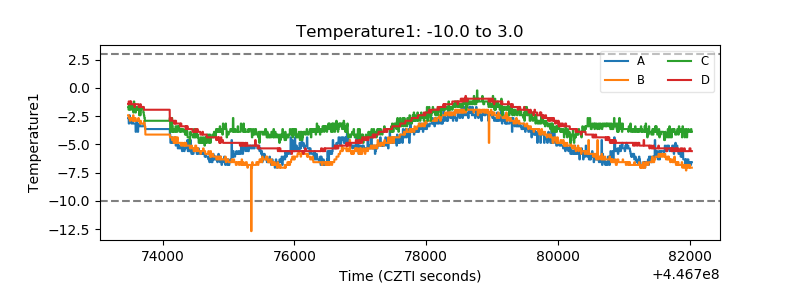 |
| Veto HV Monitor | 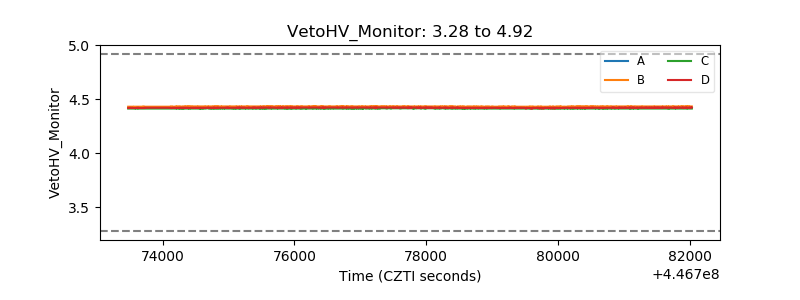 |
| Veto LLD | 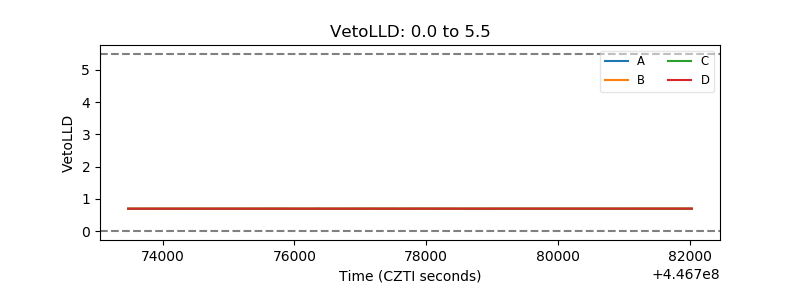 |
| Alpha Counter | 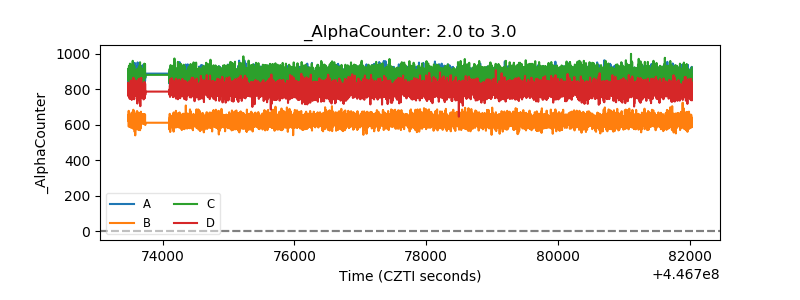 |
| _CPM_Rate | 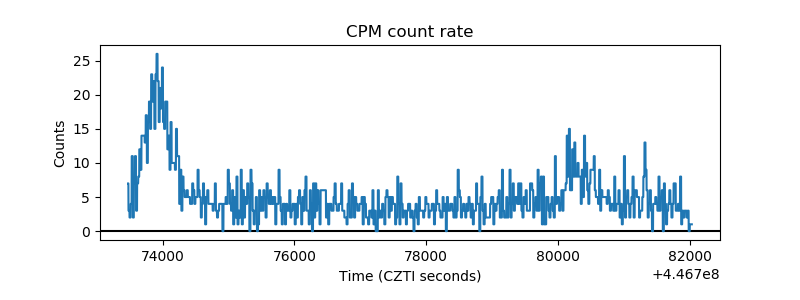 |
| CZT Counter | 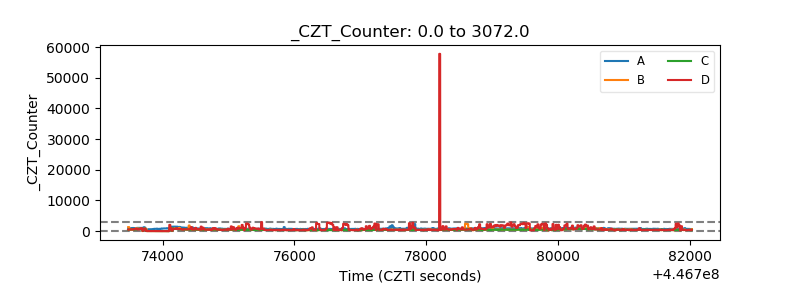 |
| +2.5 Volts monitor | 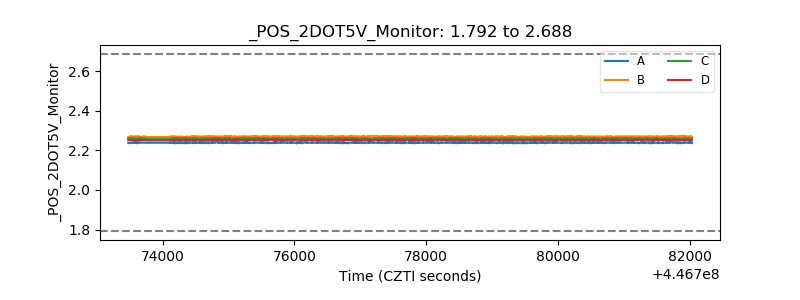 |
| +5 Volts monitor | 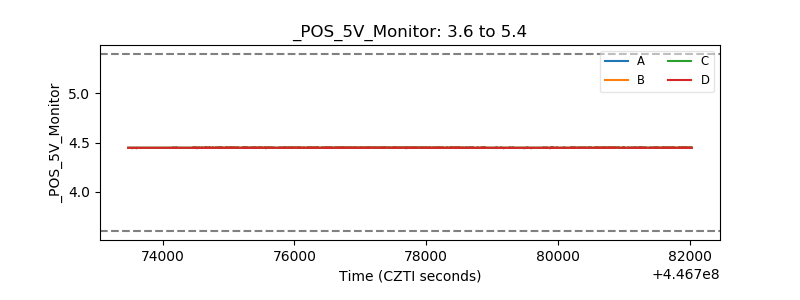 |
| _ROLL_ROT | 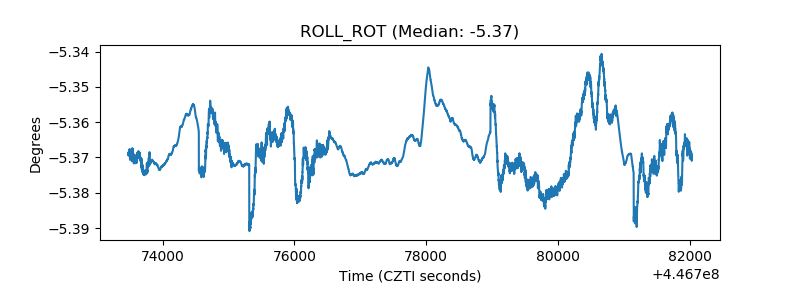 |
| _Roll_DEC | 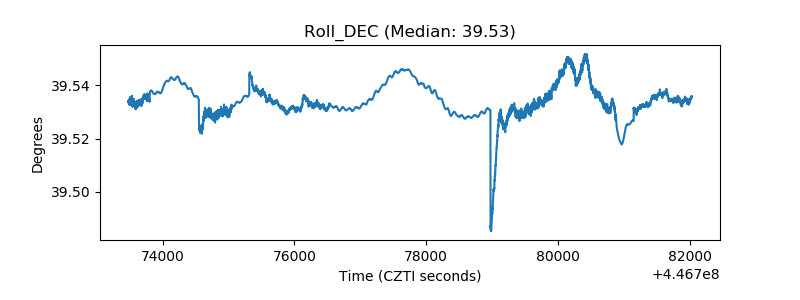 |
| _Roll_RA | 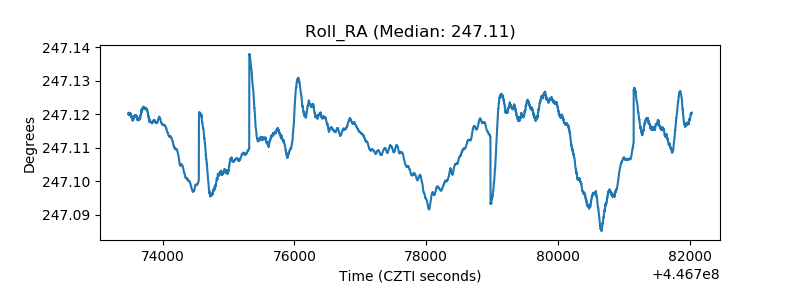 |
| Veto Counter | 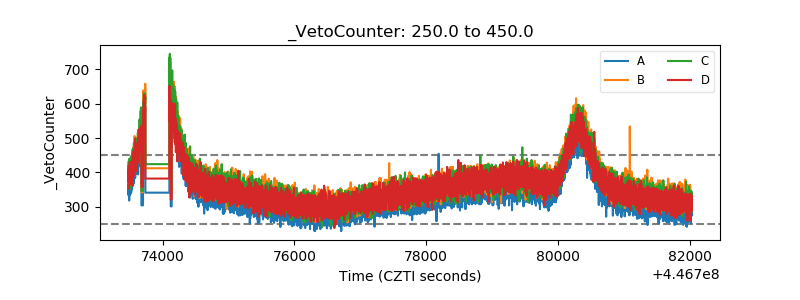 |