| Param | Original file | Final file |
|---|---|---|
| Filename | modeM0/AS1A13_031T01_9000006102_45531cztM0_level2.fits | modeM0/AS1A13_031T01_9000006102_45531cztM0_level2_quad_clean.evt |
| Size (bytes) | 343,013,760 | 65,969,280 |
| Size | 327.1 MB | 62.9 MB |
| Events in quadrant A | 3,454,405 | 460,595 |
| Events in quadrant B | 3,407,514 | 395,084 |
| Events in quadrant C | 1,819,354 | 453,939 |
| Events in quadrant D | 3,674,086 | 379,316 |
| Mode M0 | |||
|---|---|---|---|
| Quadrant | BADHDUFLAG | Total packets | Discarded packets |
| A | 0 | 13384 | 0 |
| B | 0 | 13509 | 0 |
| C | 0 | 8857 | 0 |
| D | 0 | 14221 | 1 |
| Mode SS | |||
|---|---|---|---|
| Quadrant | BADHDUFLAG | Total packets | Discarded packets |
| A | 0 | 88 | 0 |
| B | 0 | 88 | 0 |
| C | 0 | 88 | 0 |
| D | 0 | 88 | 0 |
| Quadrant | Total seconds | Saturated seconds | Saturation percentage |
|---|---|---|---|
| A | 4384 | 11 | 0.250912% |
| B | 4384 | 763 | 17.404197% |
| C | 4384 | 2 | 0.045620% |
| D | 4383 | 479 | 10.928588% |
Noise dominated data is calculated using 1-second bins in cleaned event files. If a bin has >2000 counts, and if more than 50% of those come from <1% of pixels, then it is considered to be noise-dominated and hence unusable.
| Quadrant | # 1 sec bins | Bins with >0 counts | Bins with >2000 counts | High rate bins dominated by noise | Noise dominated (total time) | Noise dominated (detector-on time) | Marked lightcurve |
|---|---|---|---|---|---|---|---|
| A | 4384 | 4384 | 1 | 1 | 0.02% | 0.02% | 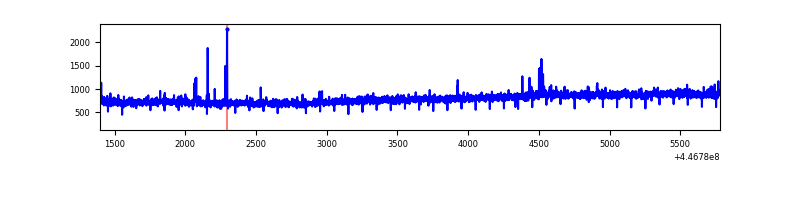 |
| B | 4384 | 4384 | 500 | 500 | 11.41% | 11.41% | 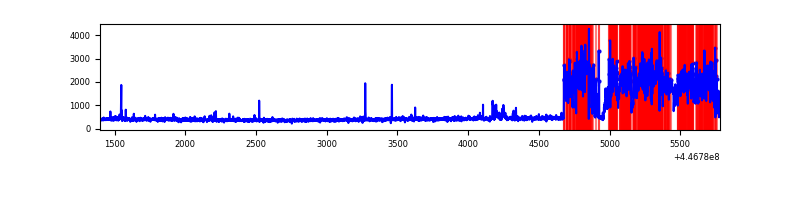 |
| C | 4384 | 4384 | 3 | 3 | 0.07% | 0.07% | 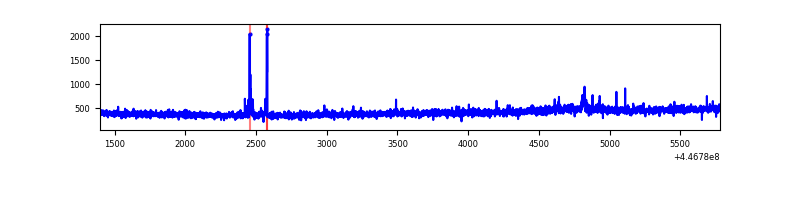 |
| D | 4383 | 4383 | 378 | 378 | 8.62% | 8.62% | 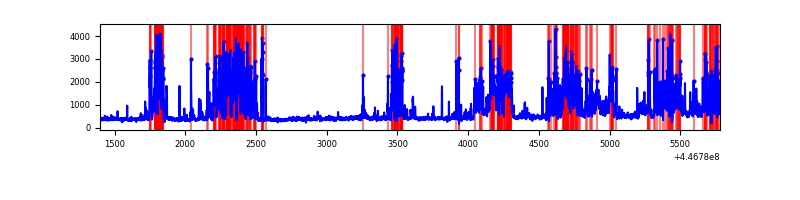 |
Top three noisy pixels from each quadrant. If the there are fewer than three noisy pixels in the level2.evt file, extra rows are filled as -1
| Pixel properties | Quadrant properties | ||||||
|---|---|---|---|---|---|---|---|
| Quadrant | DetID | PixID | Counts | Sigma | Mean | Median | Sigma |
| A | 10 | 83 | 1616197 | 16620.29 | 462 | 453 | 97.2 |
| A | 7 | 3 | 15537 | 155.16 | 462 | 453 | 97.2 |
| A | 0 | 243 | 14761 | 147.18 | 462 | 453 | 97.2 |
| B | 15 | 201 | 1662758 | 19532.24 | 425 | 414 | 85.1 |
| B | 5 | 172 | 42486 | 494.34 | 425 | 414 | 85.1 |
| B | 12 | 111 | 10560 | 119.21 | 425 | 414 | 85.1 |
| C | 14 | 254 | 22174 | 202.14 | 453 | 455 | 107.4 |
| C | 3 | 233 | 15384 | 138.94 | 453 | 455 | 107.4 |
| C | 12 | 2 | 12656 | 113.55 | 453 | 455 | 107.4 |
| D | 13 | 249 | 992636 | 9028.43 | 434 | 419 | 109.9 |
| D | 5 | 171 | 741660 | 6744.74 | 434 | 419 | 109.9 |
| D | 5 | 222 | 155925 | 1414.99 | 434 | 419 | 109.9 |
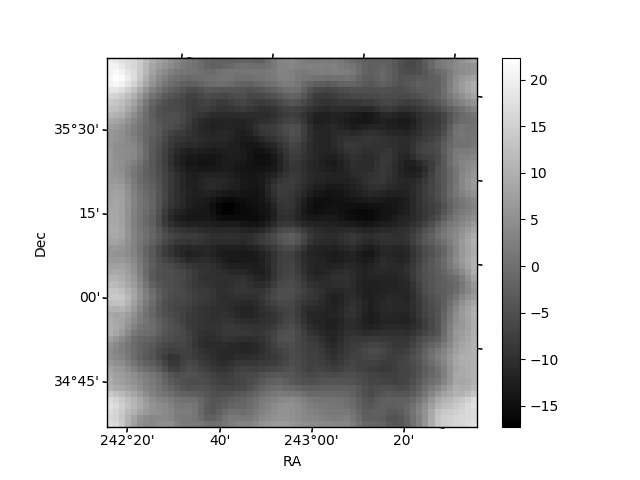
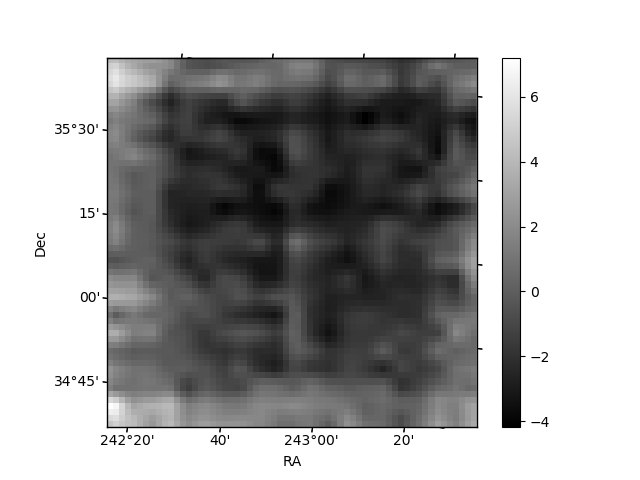
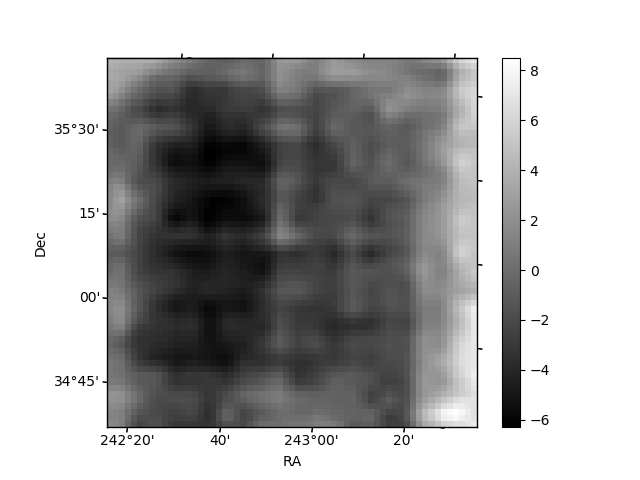
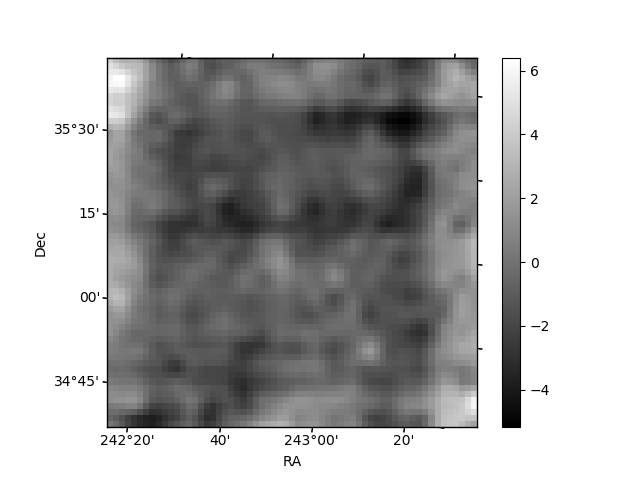
Histogram calculated using DETX and DETY for each event in the final _common_clean file
| Quadrant A | 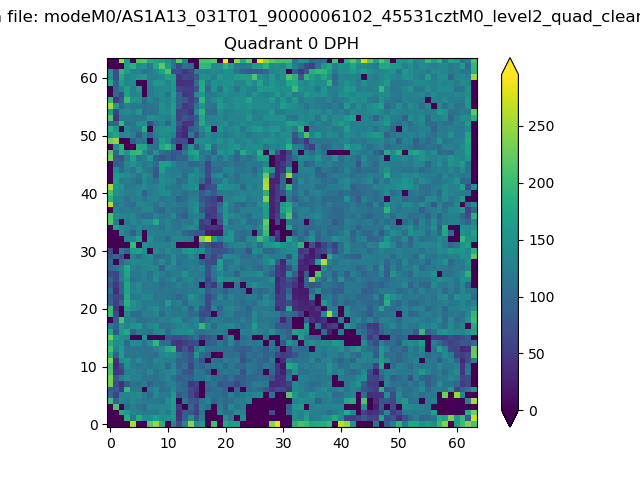 |
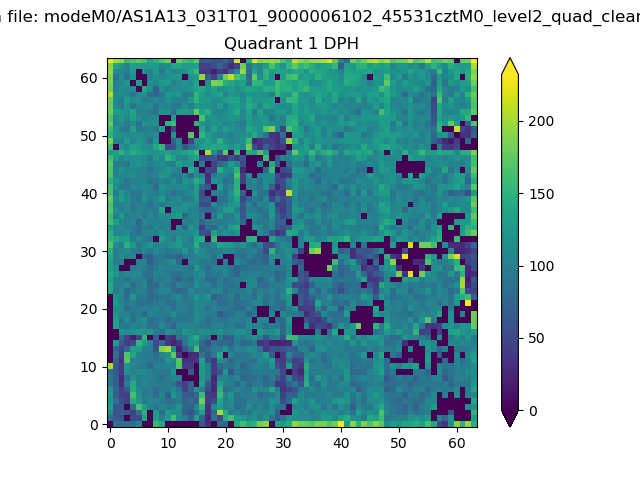 |
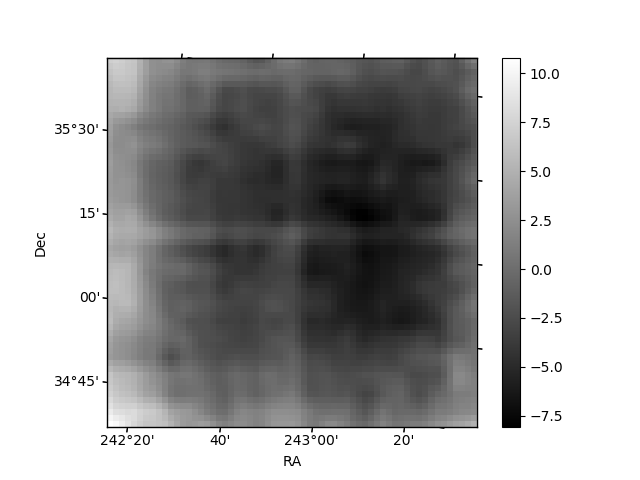
Quadrant B |
|---|---|---|---|
| Quadrant D | 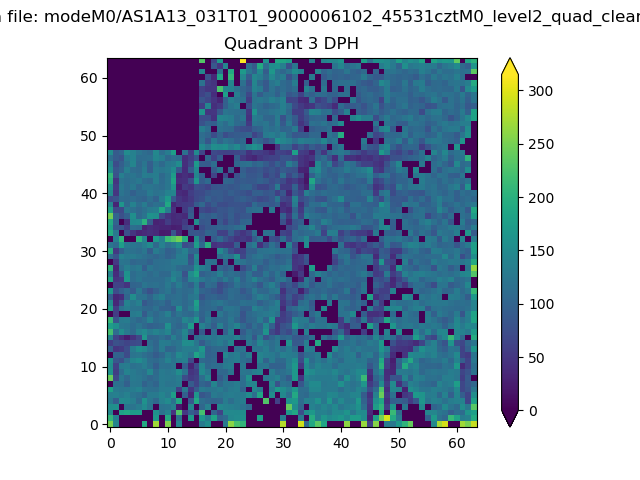 |
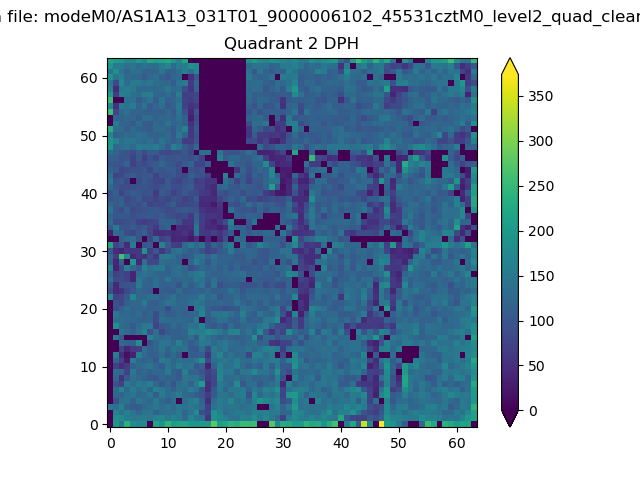 |
Quadrant C |
| Plot type | Count rate plots | Images |
|---|---|---|
| Comparison with Poisson distribution Blue bars denote a histogram of data divided into 1 sec bins. Red curve is a Poisson curve with rate = median count rate of data. |
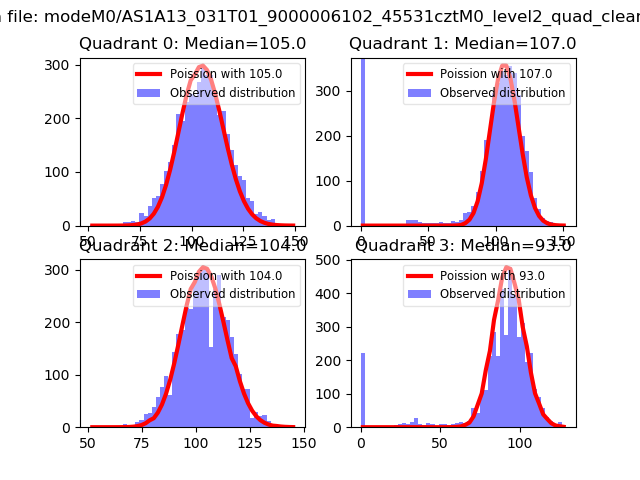 |
 |
| Quadrant-wise count rates Data is divided into 100 sec bins |
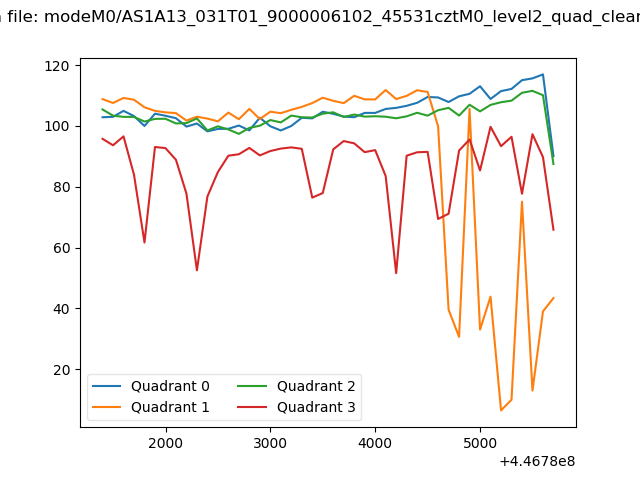 |
|
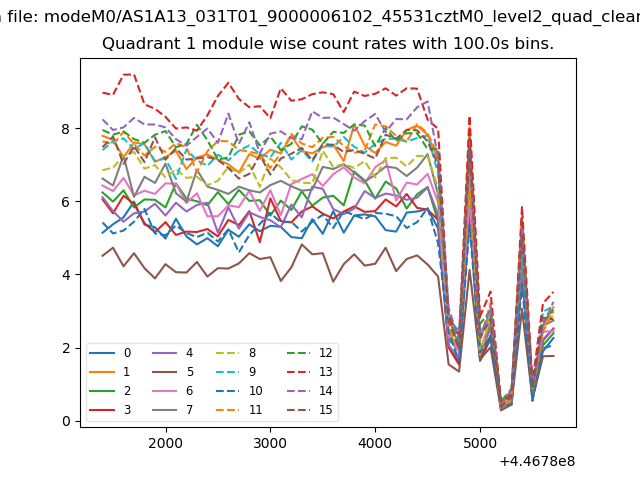
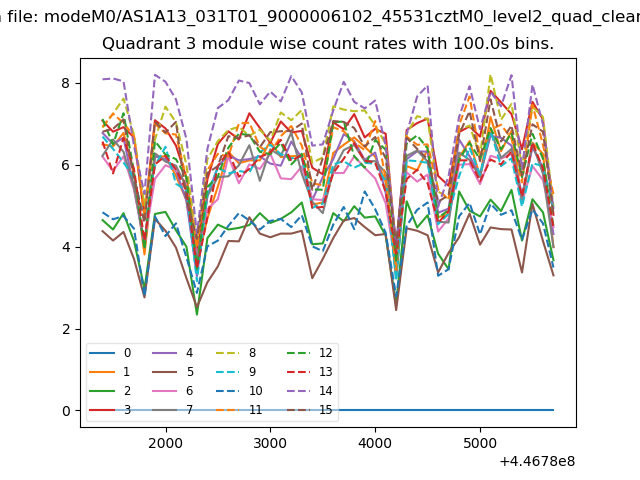
| Module-wise count rates for Quadrant A Data is divided into 100 sec bins |
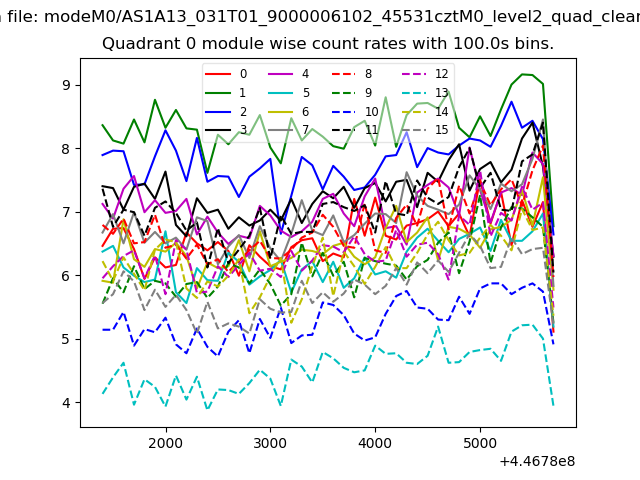 |
 |
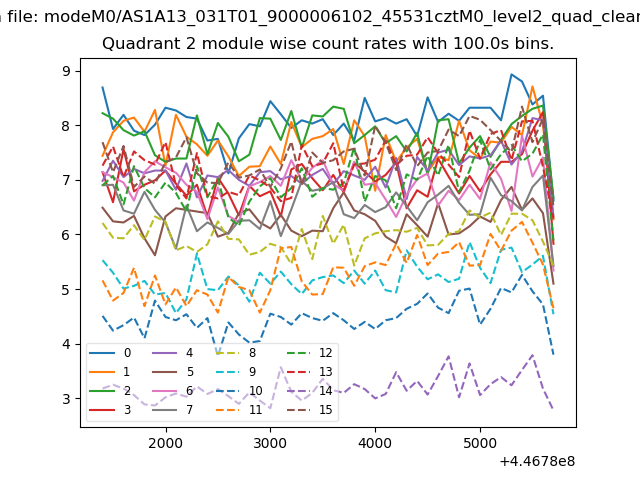
| Module-wise count rates for Quadrant B Data is divided into 100 sec bins |
 |
 |
| Module-wise count rates for Quadrant C Data is divided into 100 sec bins |
 |
 |
| Module-wise count rates for Quadrant D Data is divided into 100 sec bins |
 |
 |
| Parameter | Plot |
|---|---|
| CZT HV Monitor | 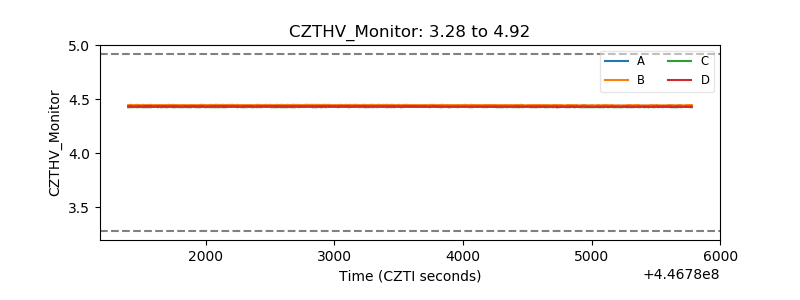 |
| D_VDD | 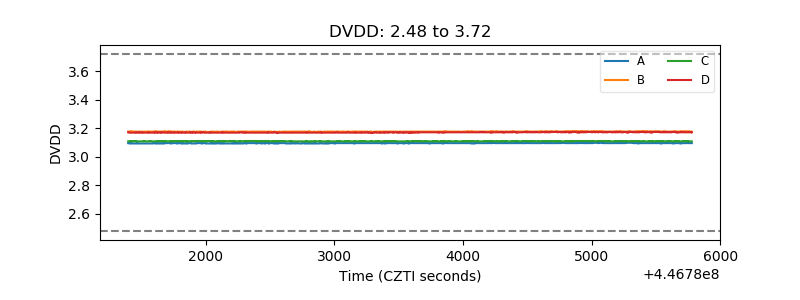 |
| Temperature 1 | 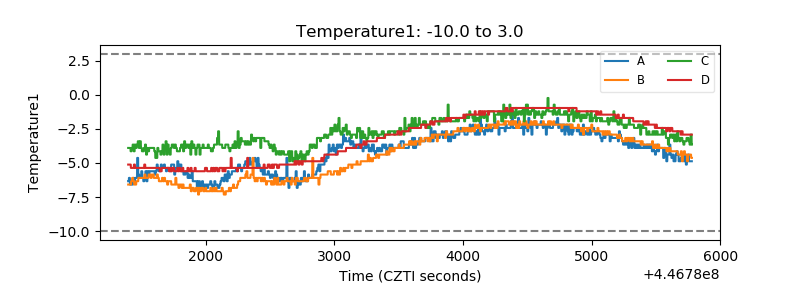 |
| Veto HV Monitor | 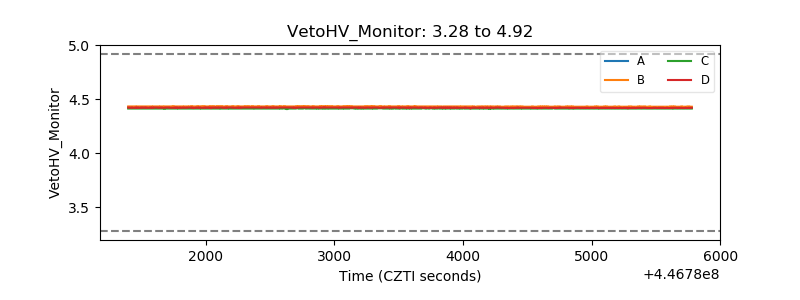 |
| Veto LLD | 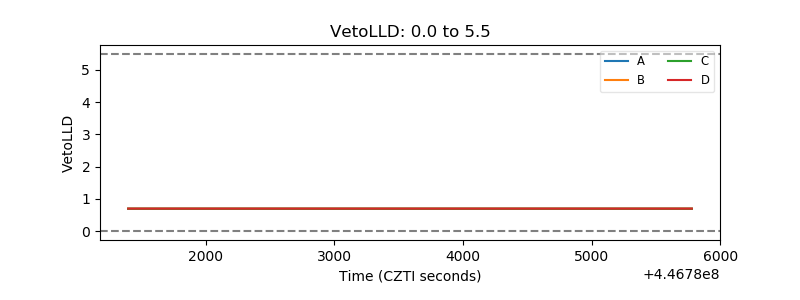 |
| Alpha Counter | 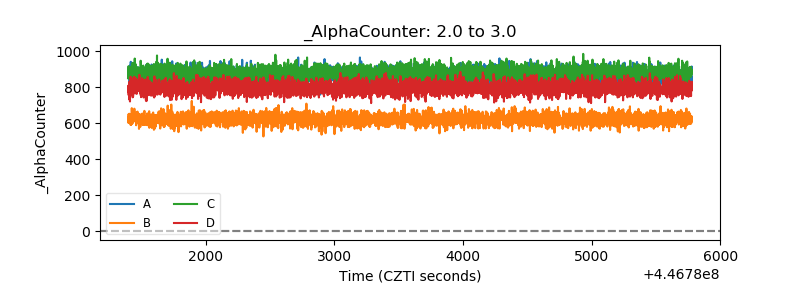 |
| _CPM_Rate | 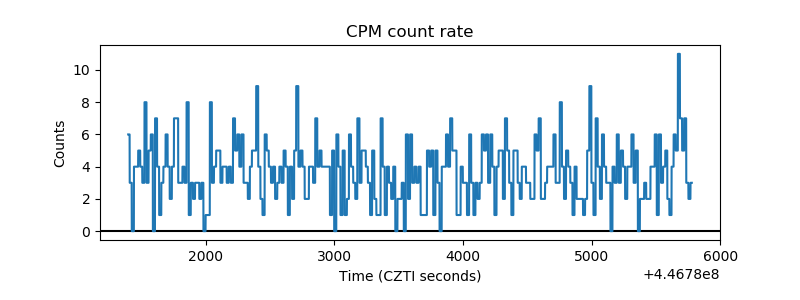 |
| CZT Counter | 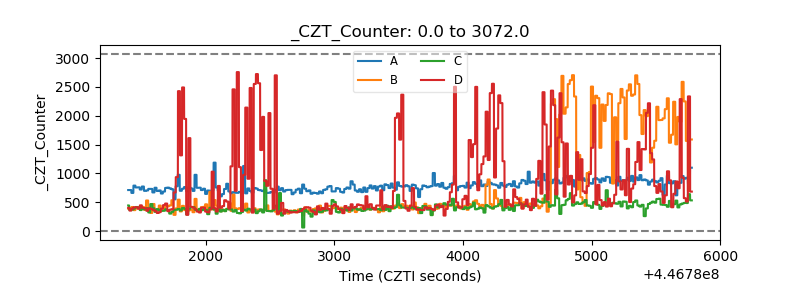 |
| +2.5 Volts monitor | 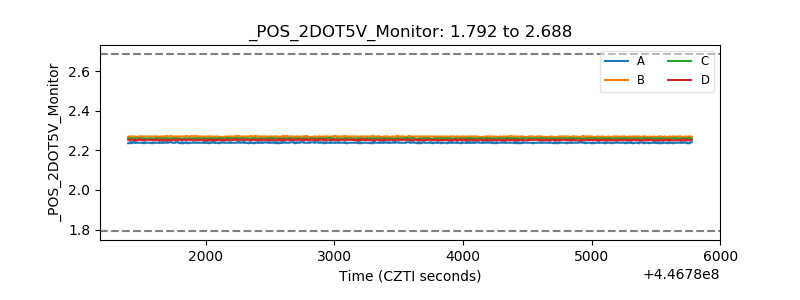 |
| +5 Volts monitor |  |
| _ROLL_ROT | 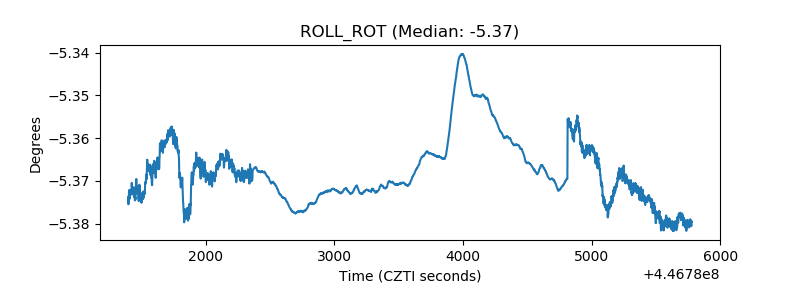 |
| _Roll_DEC | 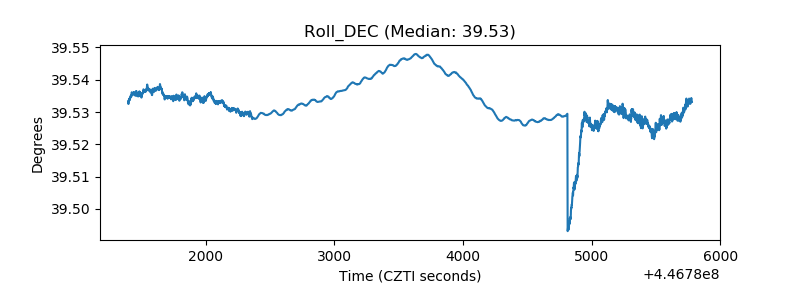 |
| _Roll_RA | 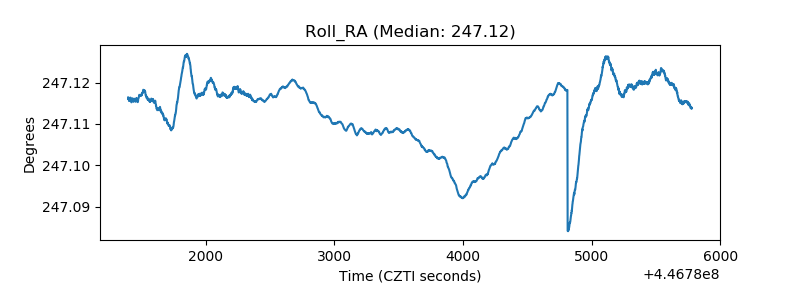 |
| Veto Counter | 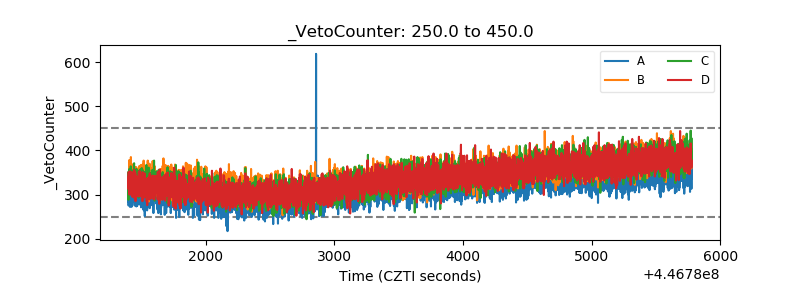 |