| Param | Original file | Final file |
|---|---|---|
| Filename | modeM0/AS1A13_031T02_9000006100_45513cztM0_level2.fits | modeM0/AS1A13_031T02_9000006100_45513cztM0_level2_quad_clean.evt |
| Size (bytes) | 448,312,320 | 106,418,880 |
| Size | 427.5 MB | 101.5 MB |
| Events in quadrant A | 5,390,219 | 709,182 |
| Events in quadrant B | 3,643,295 | 727,219 |
| Events in quadrant C | 3,148,253 | 693,946 |
| Events in quadrant D | 3,897,686 | 628,813 |
| Mode SS | |||
|---|---|---|---|
| Quadrant | BADHDUFLAG | Total packets | Discarded packets |
| A | 0 | 136 | 0 |
| B | 0 | 136 | 0 |
| C | 0 | 136 | 0 |
| D | 0 | 136 | 0 |
| Mode M0 | |||
|---|---|---|---|
| Quadrant | BADHDUFLAG | Total packets | Discarded packets |
| A | 0 | 20598 | 2 |
| B | 0 | 15253 | 1 |
| C | 0 | 14237 | 1 |
| D | 0 | 16092 | 1 |
| Mode M9 | |||
|---|---|---|---|
| Quadrant | BADHDUFLAG | Total packets | Discarded packets |
| A | 0 | 9 | 0 |
| B | 0 | 9 | 0 |
| C | 0 | 9 | 0 |
| D | 0 | 9 | 0 |
| Quadrant | Total seconds | Saturated seconds | Saturation percentage |
|---|---|---|---|
| A | 6637 | 144 | 2.169655% |
| B | 6638 | 188 | 2.832178% |
| C | 6638 | 118 | 1.777644% |
| D | 6638 | 213 | 3.208798% |
Noise dominated data is calculated using 1-second bins in cleaned event files. If a bin has >2000 counts, and if more than 50% of those come from <1% of pixels, then it is considered to be noise-dominated and hence unusable.
| Quadrant | # 1 sec bins | Bins with >0 counts | Bins with >2000 counts | High rate bins dominated by noise | Noise dominated (total time) | Noise dominated (detector-on time) | Marked lightcurve |
|---|---|---|---|---|---|---|---|
| A | 7537 | 6638 | 0 | 0 | 0.00% | 0.00% | 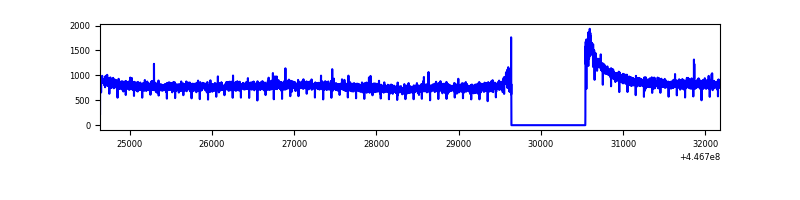 |
| B | 7538 | 6639 | 64 | 64 | 0.85% | 0.96% | 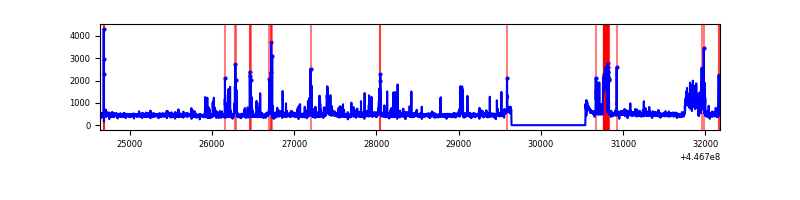 |
| C | 7538 | 6639 | 61 | 61 | 0.81% | 0.92% | 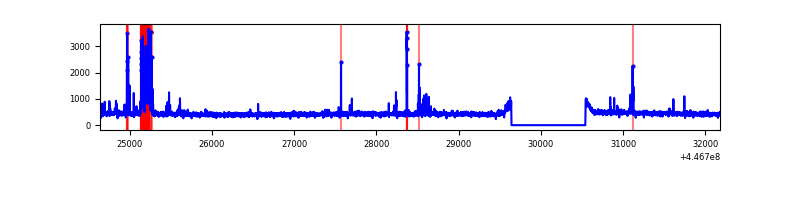 |
| D | 7538 | 6639 | 119 | 119 | 1.58% | 1.79% | 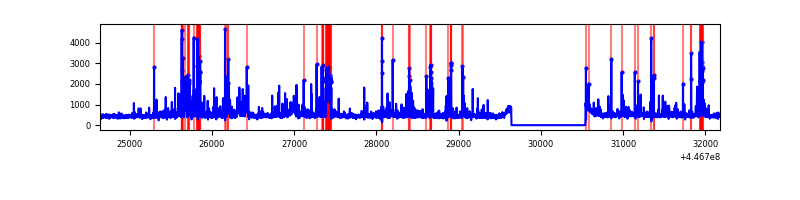 |
Top three noisy pixels from each quadrant. If the there are fewer than three noisy pixels in the level2.evt file, extra rows are filled as -1
| Pixel properties | Quadrant properties | ||||||
|---|---|---|---|---|---|---|---|
| Quadrant | DetID | PixID | Counts | Sigma | Mean | Median | Sigma |
| A | 10 | 83 | 2496299 | 16110.65 | 745 | 728 | 154.9 |
| A | 3 | 137 | 8512 | 50.25 | 745 | 728 | 154.9 |
| A | 2 | 79 | 7660 | 44.75 | 745 | 728 | 154.9 |
| B | 15 | 201 | 308387 | 2094.19 | 739 | 717 | 146.9 |
| B | 5 | 172 | 264447 | 1795.11 | 739 | 717 | 146.9 |
| B | 12 | 16 | 46377 | 310.79 | 739 | 717 | 146.9 |
| C | 14 | 254 | 293607 | 1701.0 | 728 | 733 | 172.2 |
| C | 7 | 253 | 7788 | 40.98 | 728 | 733 | 172.2 |
| C | 3 | 233 | 6309 | 32.39 | 728 | 733 | 172.2 |
| D | 5 | 222 | 367589 | 1982.89 | 728 | 701 | 185.0 |
| D | 2 | 249 | 278820 | 1503.13 | 728 | 701 | 185.0 |
| D | 13 | 249 | 204741 | 1102.76 | 728 | 701 | 185.0 |
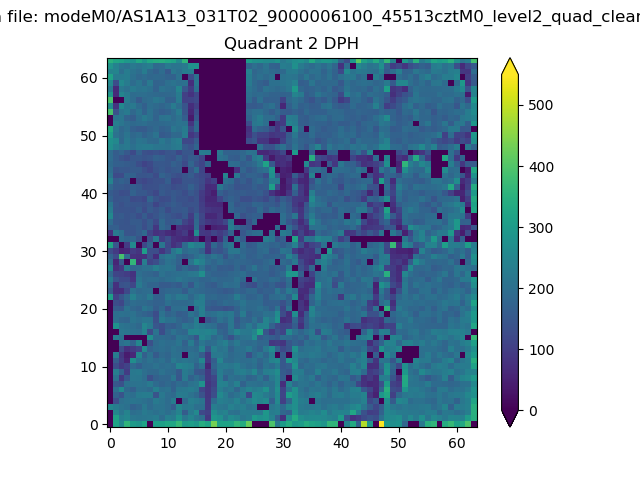
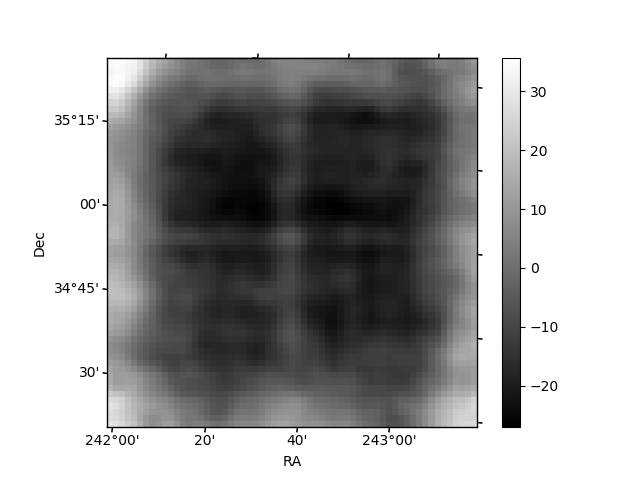
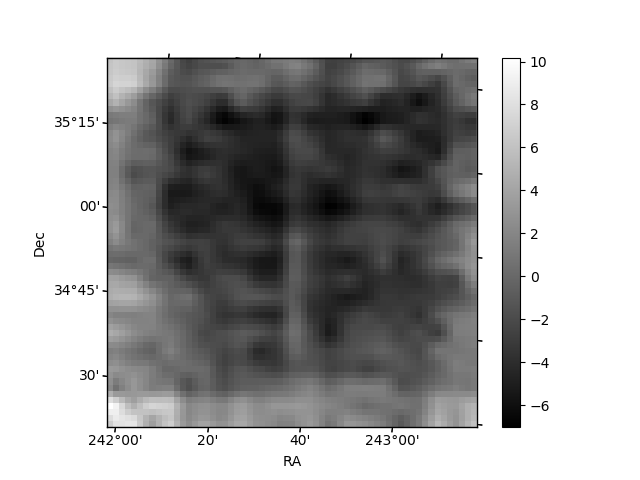
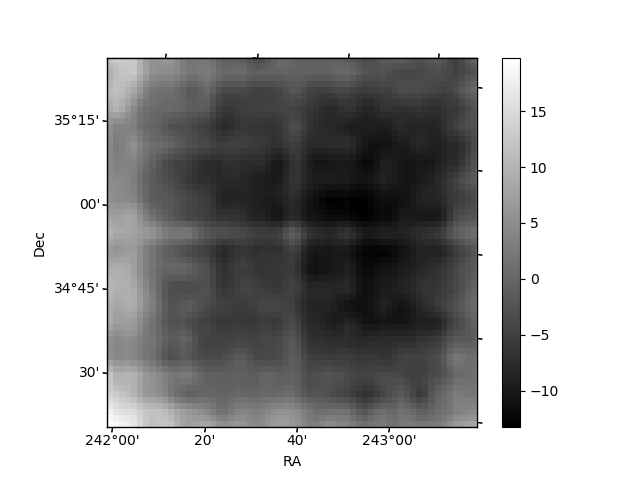
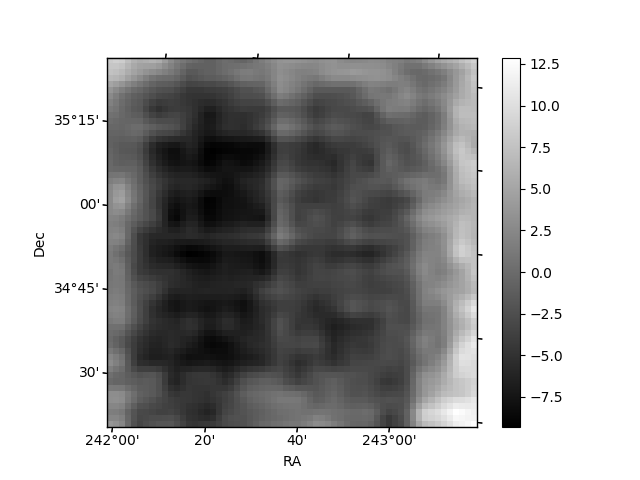
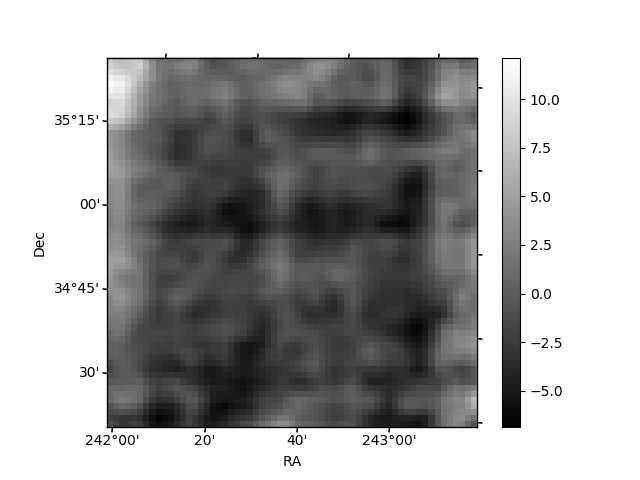
Histogram calculated using DETX and DETY for each event in the final _common_clean file
| Quadrant A | 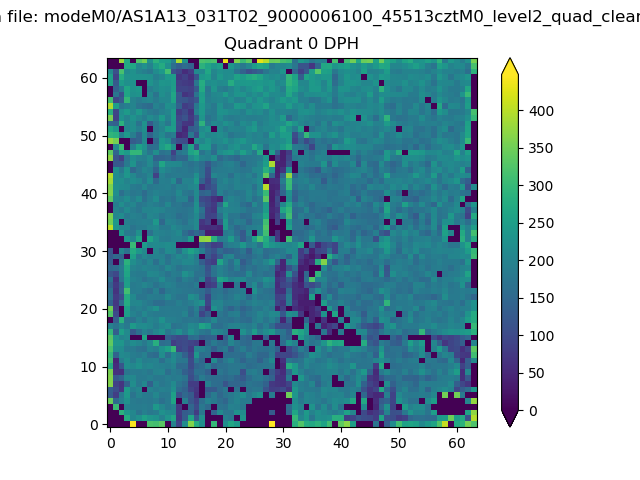 |
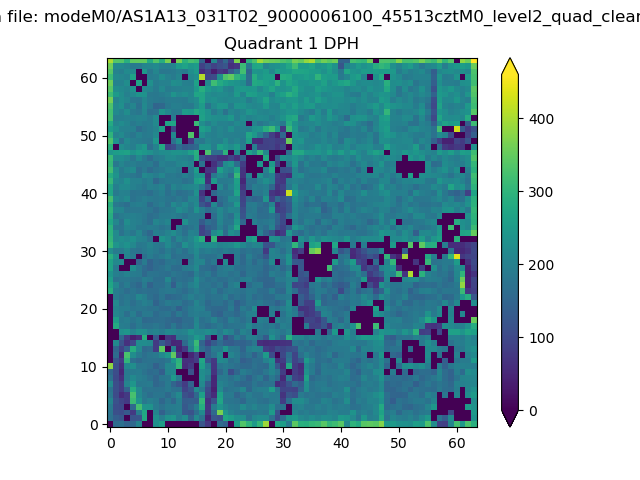 |
Quadrant B |
|---|---|---|---|
| Quadrant D | 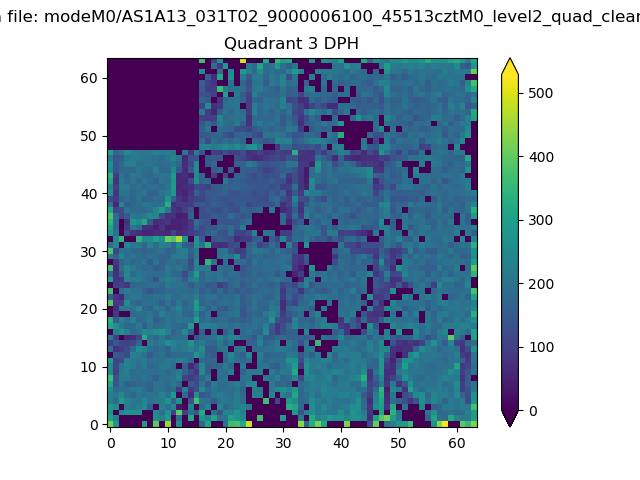 |
 |
Quadrant C |
| Plot type | Count rate plots | Images |
|---|---|---|
| Comparison with Poisson distribution Blue bars denote a histogram of data divided into 1 sec bins. Red curve is a Poisson curve with rate = median count rate of data. |
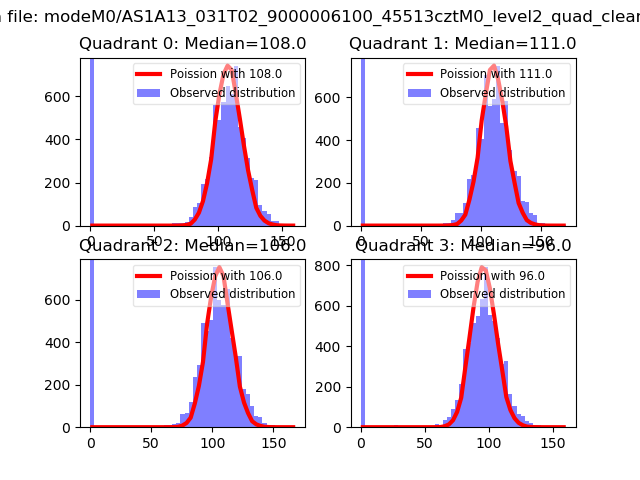 |
 |
| Quadrant-wise count rates Data is divided into 100 sec bins |
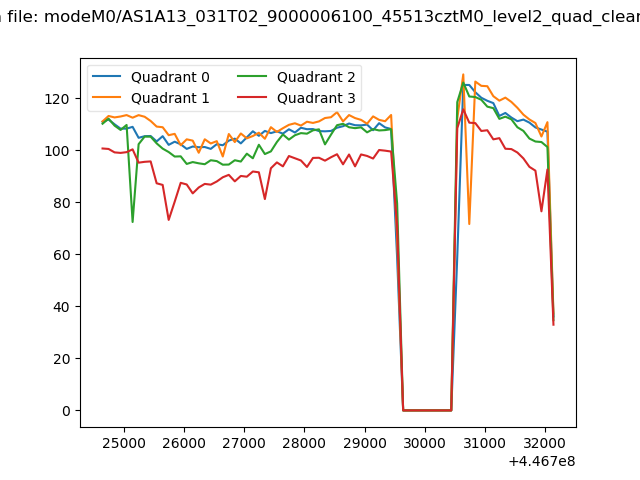 |
|
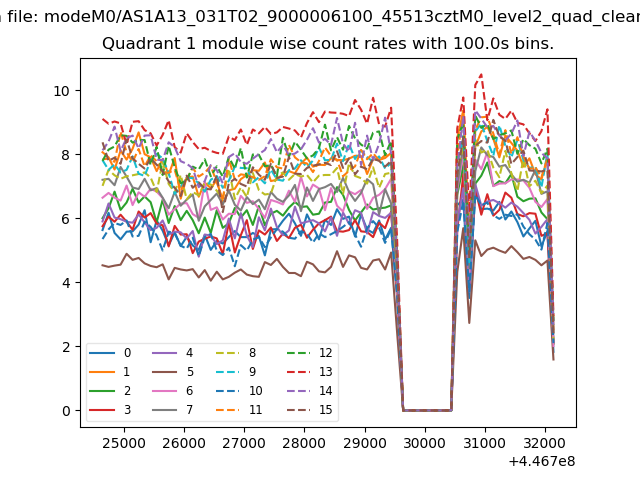
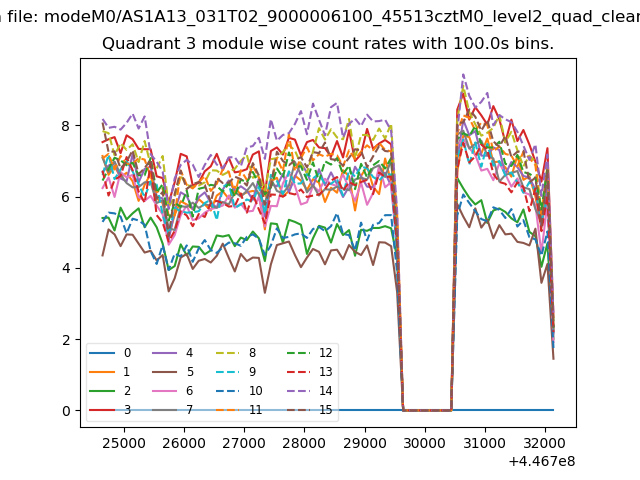
| Module-wise count rates for Quadrant A Data is divided into 100 sec bins |
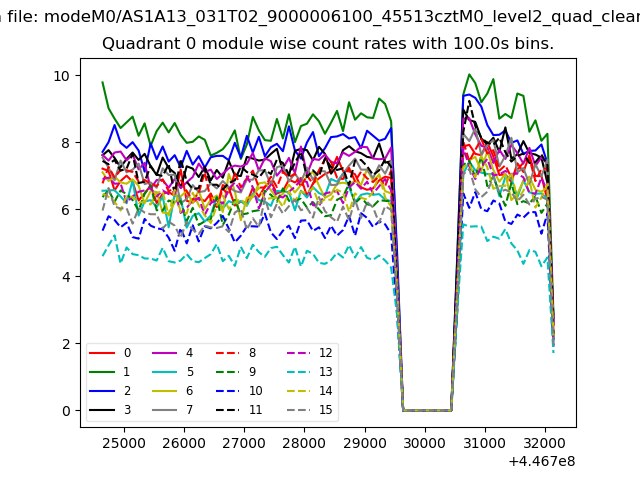 |
 |
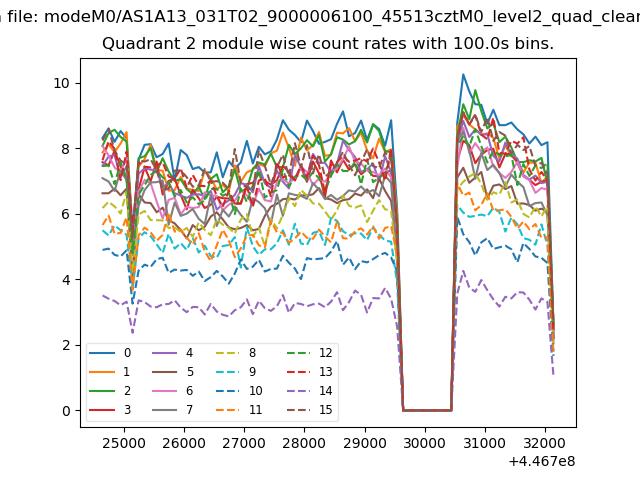
| Module-wise count rates for Quadrant B Data is divided into 100 sec bins |
 |
 |
| Module-wise count rates for Quadrant C Data is divided into 100 sec bins |
 |
 |
| Module-wise count rates for Quadrant D Data is divided into 100 sec bins |
 |
 |
| Parameter | Plot |
|---|---|
| CZT HV Monitor | 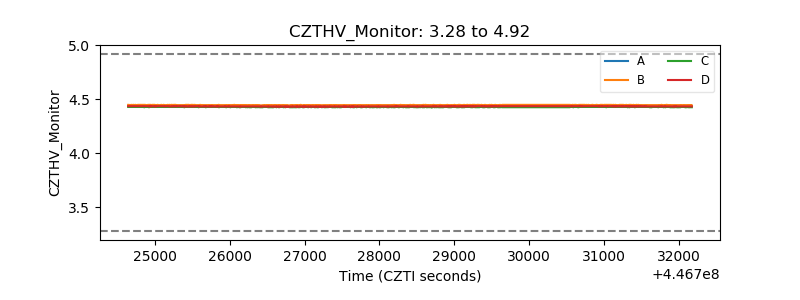 |
| D_VDD | 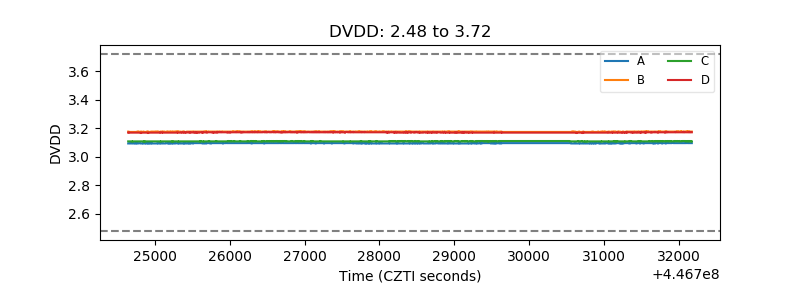 |
| Temperature 1 | 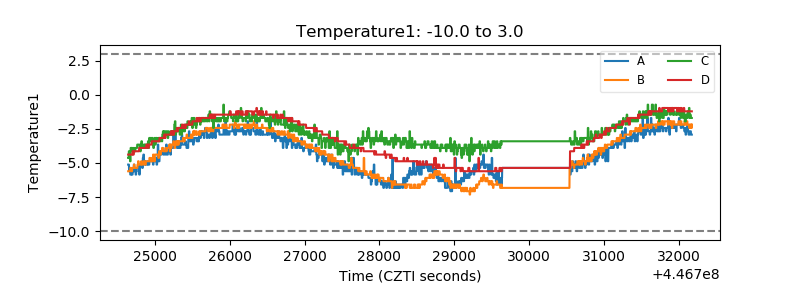 |
| Veto HV Monitor | 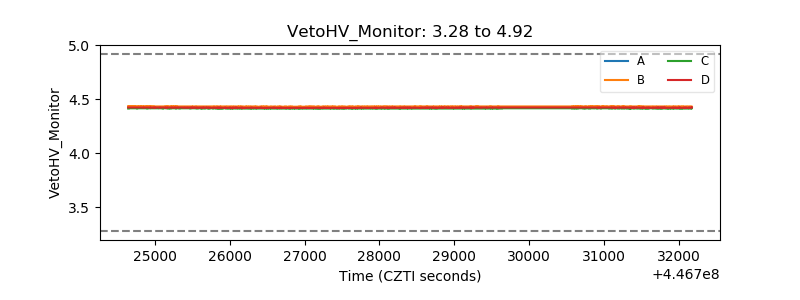 |
| Veto LLD | 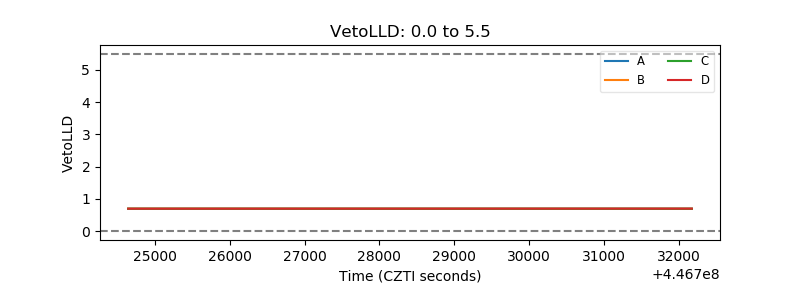 |
| Alpha Counter | 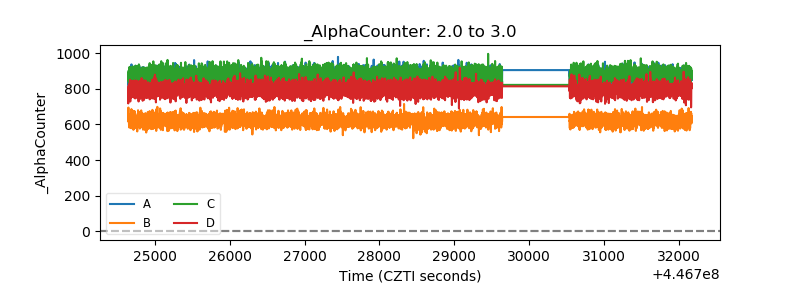 |
| _CPM_Rate | 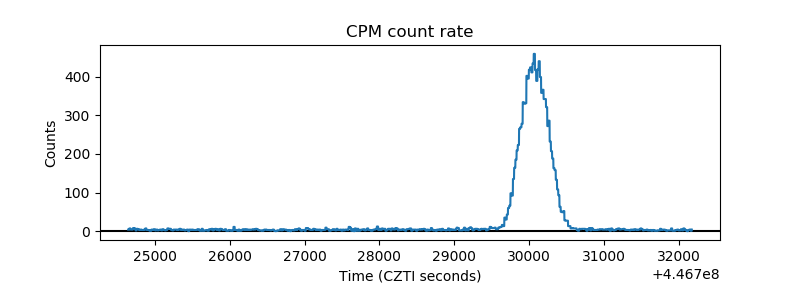 |
| CZT Counter | 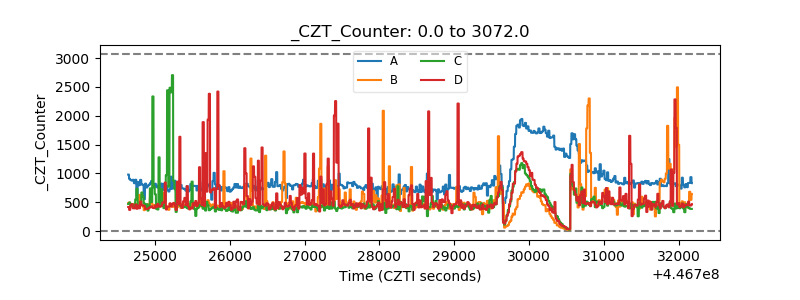 |
| +2.5 Volts monitor | 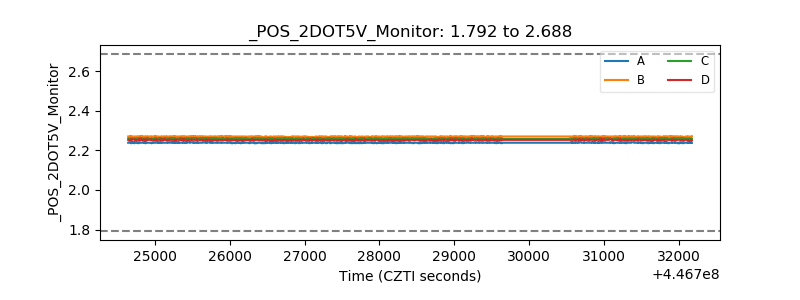 |
| +5 Volts monitor | 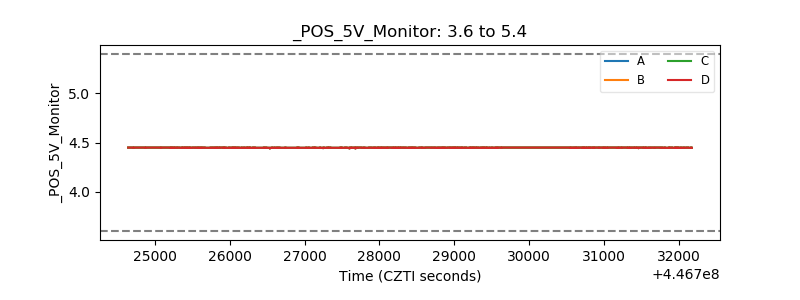 |
| _ROLL_ROT | 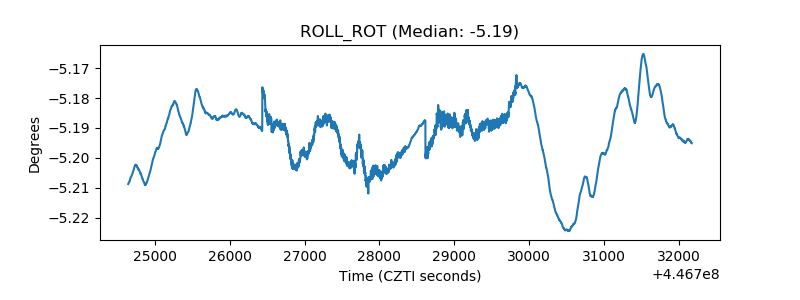 |
| _Roll_DEC | 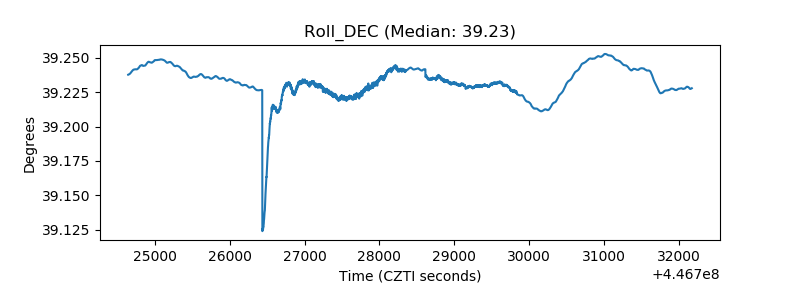 |
| _Roll_RA |  |
| Veto Counter | 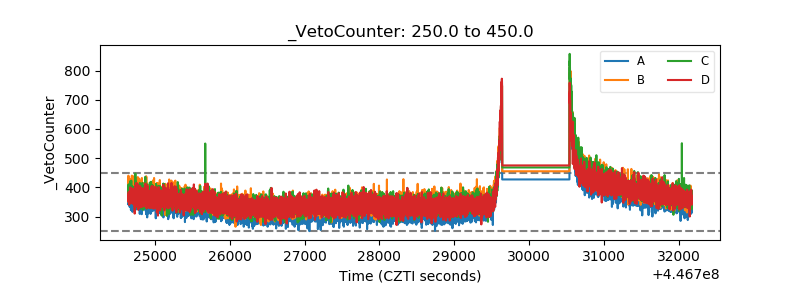 |