| Param | Original file | Final file |
|---|---|---|
| Filename | modeM0/AS1A13_031T02_9000006100_45515cztM0_level2.fits | modeM0/AS1A13_031T02_9000006100_45515cztM0_level2_quad_clean.evt |
| Size (bytes) | 479,626,560 | 113,195,520 |
| Size | 457.4 MB | 108.0 MB |
| Events in quadrant A | 5,926,981 | 757,353 |
| Events in quadrant B | 3,744,876 | 788,900 |
| Events in quadrant C | 3,225,012 | 750,480 |
| Events in quadrant D | 4,324,452 | 652,618 |
| Mode SS | |||
|---|---|---|---|
| Quadrant | BADHDUFLAG | Total packets | Discarded packets |
| A | 0 | 140 | 0 |
| B | 0 | 140 | 0 |
| C | 0 | 140 | 0 |
| D | 0 | 140 | 0 |
| Mode M0 | |||
|---|---|---|---|
| Quadrant | BADHDUFLAG | Total packets | Discarded packets |
| A | 0 | 22200 | 2 |
| B | 0 | 15708 | 2 |
| C | 0 | 14411 | 2 |
| D | 0 | 17457 | 2 |
| Mode M9 | |||
|---|---|---|---|
| Quadrant | BADHDUFLAG | Total packets | Discarded packets |
| A | 0 | 10 | 0 |
| B | 0 | 11 | 0 |
| C | 0 | 11 | 0 |
| D | 0 | 11 | 0 |
| Quadrant | Total seconds | Saturated seconds | Saturation percentage |
|---|---|---|---|
| A | 6860 | 235 | 3.425656% |
| B | 6860 | 210 | 3.061224% |
| C | 6860 | 115 | 1.676385% |
| D | 6860 | 464 | 6.763848% |
Noise dominated data is calculated using 1-second bins in cleaned event files. If a bin has >2000 counts, and if more than 50% of those come from <1% of pixels, then it is considered to be noise-dominated and hence unusable.
| Quadrant | # 1 sec bins | Bins with >0 counts | Bins with >2000 counts | High rate bins dominated by noise | Noise dominated (total time) | Noise dominated (detector-on time) | Marked lightcurve |
|---|---|---|---|---|---|---|---|
| A | 7900 | 6861 | 4 | 4 | 0.05% | 0.06% | 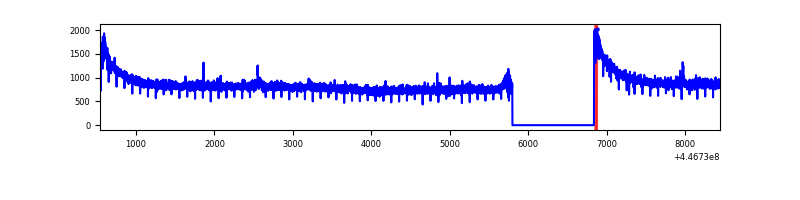 |
| B | 7900 | 6861 | 66 | 66 | 0.84% | 0.96% | 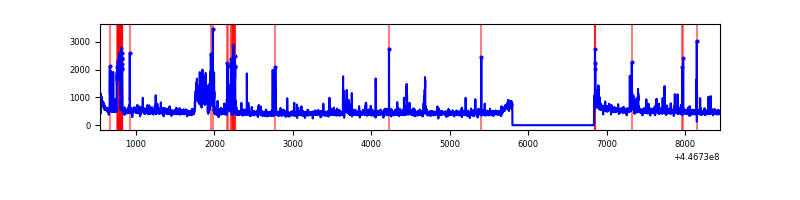 |
| C | 7900 | 6861 | 28 | 28 | 0.35% | 0.41% | 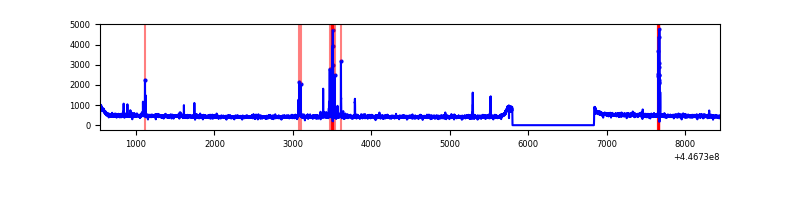 |
| D | 7900 | 6861 | 277 | 277 | 3.51% | 4.04% | 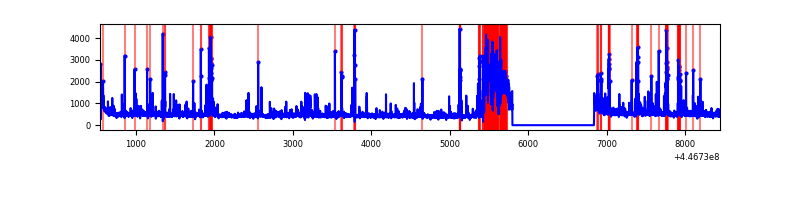 |
Top three noisy pixels from each quadrant. If the there are fewer than three noisy pixels in the level2.evt file, extra rows are filled as -1
| Pixel properties | Quadrant properties | ||||||
|---|---|---|---|---|---|---|---|
| Quadrant | DetID | PixID | Counts | Sigma | Mean | Median | Sigma |
| A | 10 | 83 | 2807897 | 17085.2 | 796 | 779 | 164.3 |
| A | 9 | 191 | 22420 | 131.72 | 796 | 779 | 164.3 |
| A | 2 | 79 | 14955 | 86.28 | 796 | 779 | 164.3 |
| B | 15 | 201 | 288671 | 1836.62 | 792 | 768 | 156.8 |
| B | 5 | 172 | 218550 | 1389.3 | 792 | 768 | 156.8 |
| B | 0 | 186 | 54671 | 343.86 | 792 | 768 | 156.8 |
| C | 14 | 254 | 121285 | 650.29 | 784 | 786 | 185.3 |
| C | 12 | 2 | 43355 | 229.73 | 784 | 786 | 185.3 |
| C | 3 | 233 | 6895 | 32.97 | 784 | 786 | 185.3 |
| D | 13 | 249 | 787938 | 4079.18 | 764 | 739 | 193.0 |
| D | 2 | 249 | 202908 | 1047.62 | 764 | 739 | 193.0 |
| D | 1 | 52 | 152333 | 785.54 | 764 | 739 | 193.0 |
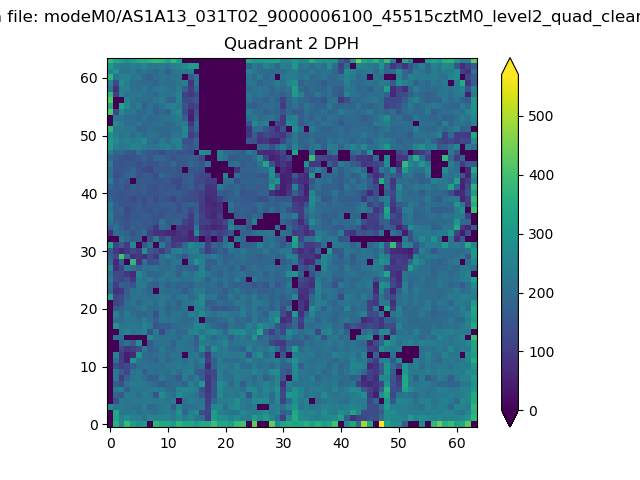
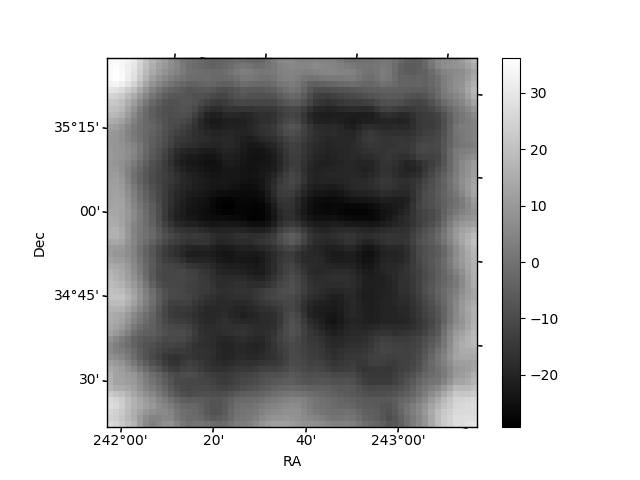
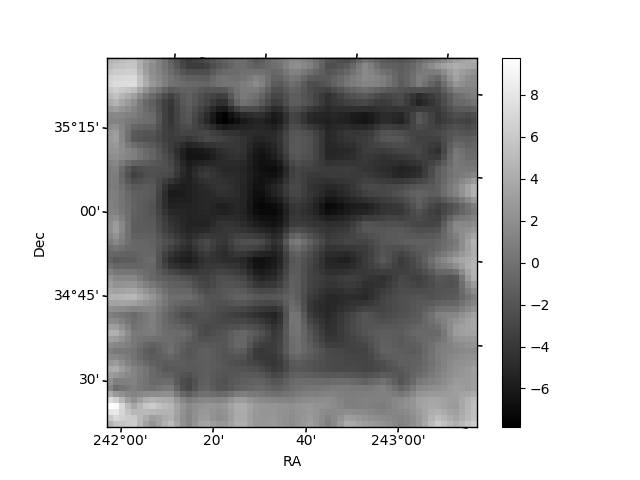
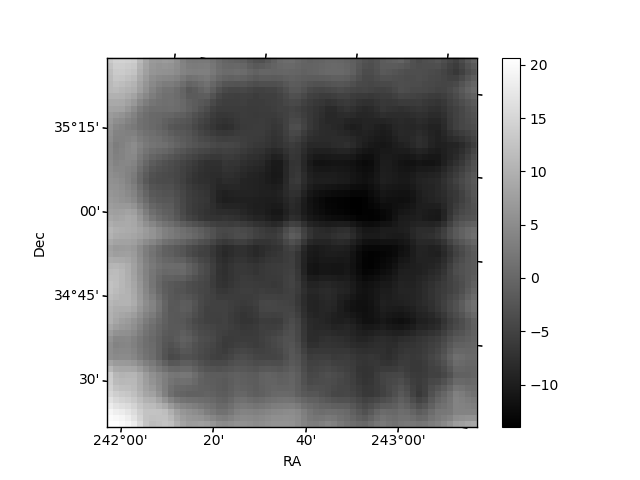
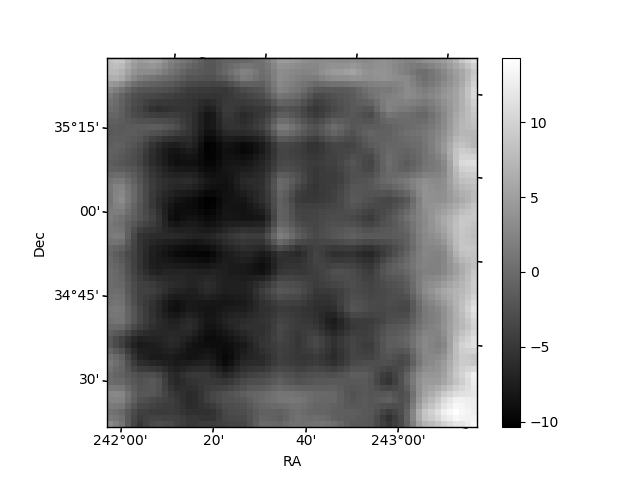
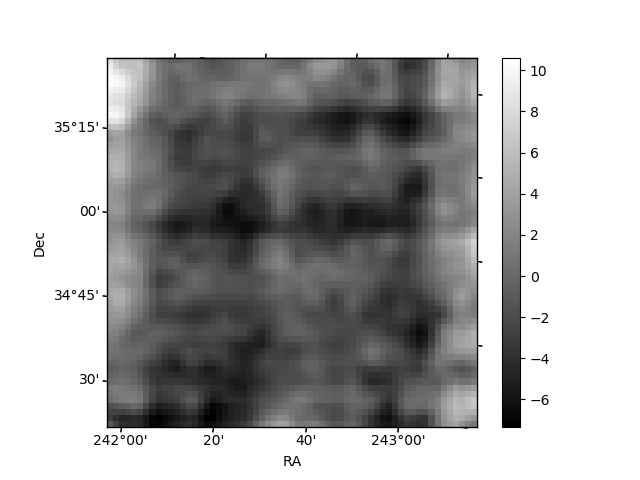
Histogram calculated using DETX and DETY for each event in the final _common_clean file
| Quadrant A | 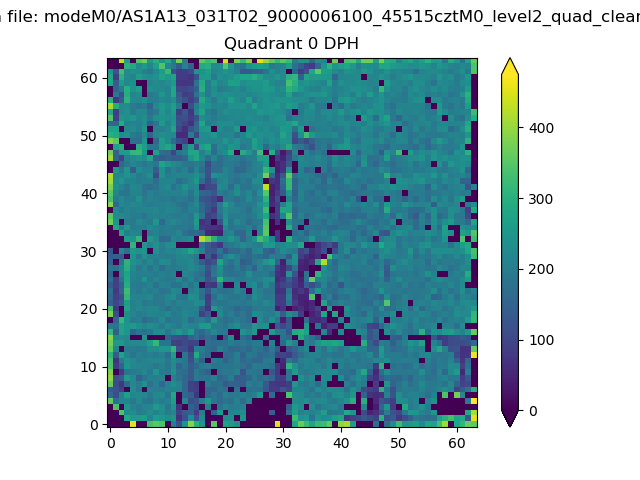 |
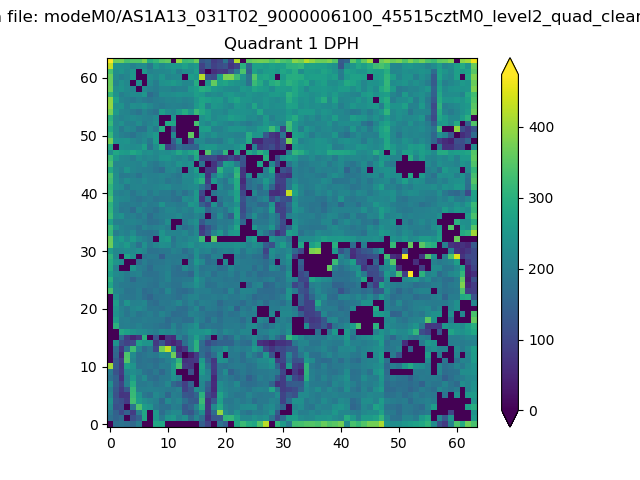 |
Quadrant B |
|---|---|---|---|
| Quadrant D | 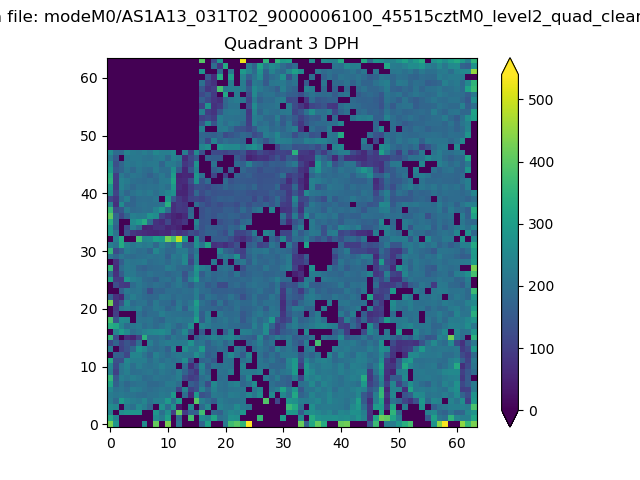 |
 |
Quadrant C |
| Plot type | Count rate plots | Images |
|---|---|---|
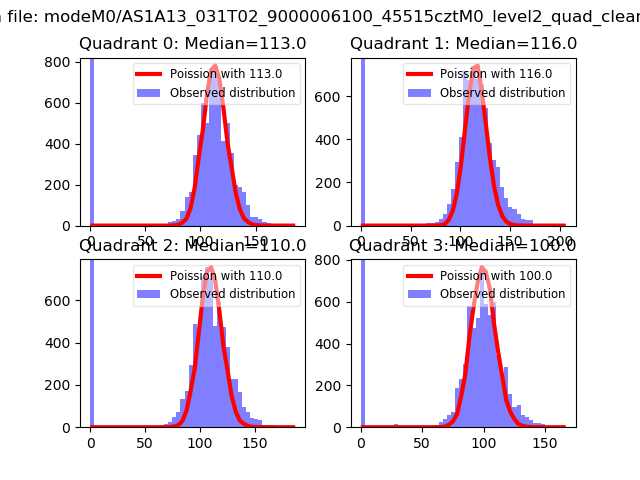
| Comparison with Poisson distribution Blue bars denote a histogram of data divided into 1 sec bins. Red curve is a Poisson curve with rate = median count rate of data. |
 |
 |
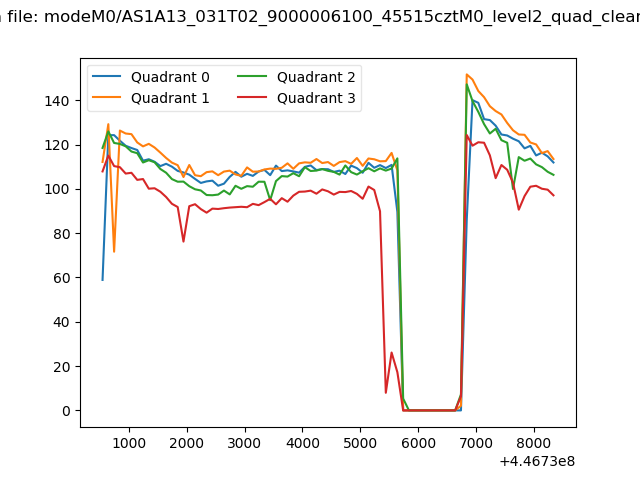
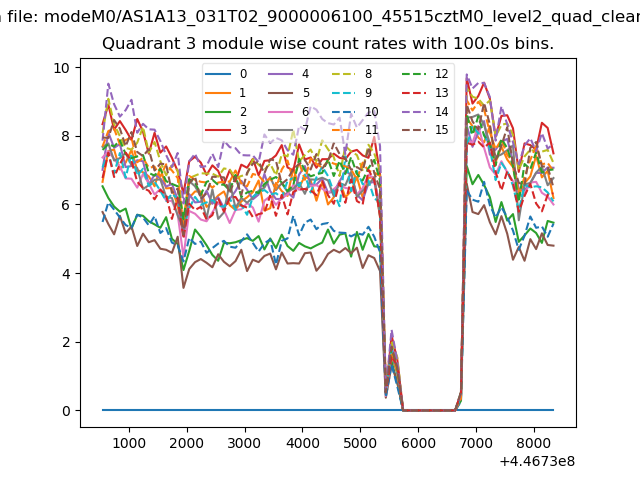
| Quadrant-wise count rates Data is divided into 100 sec bins |
 |
|
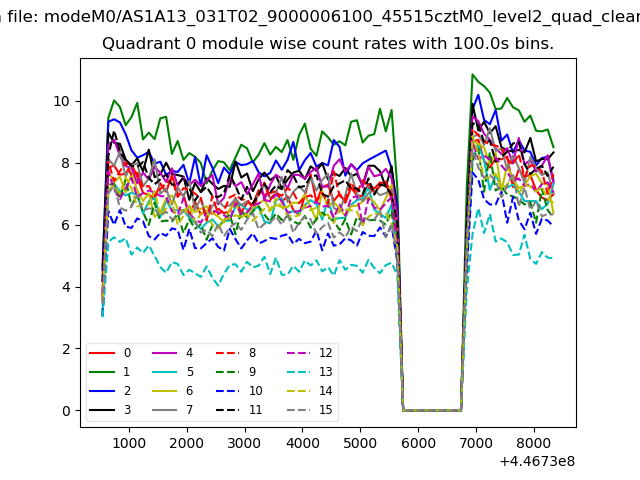
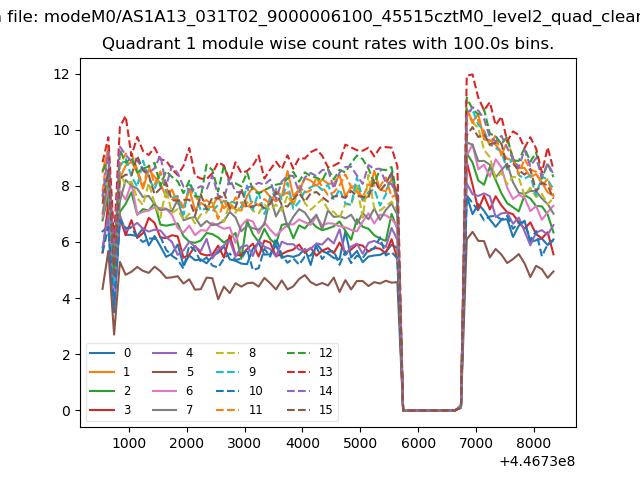
| Module-wise count rates for Quadrant A Data is divided into 100 sec bins |
 |
 |
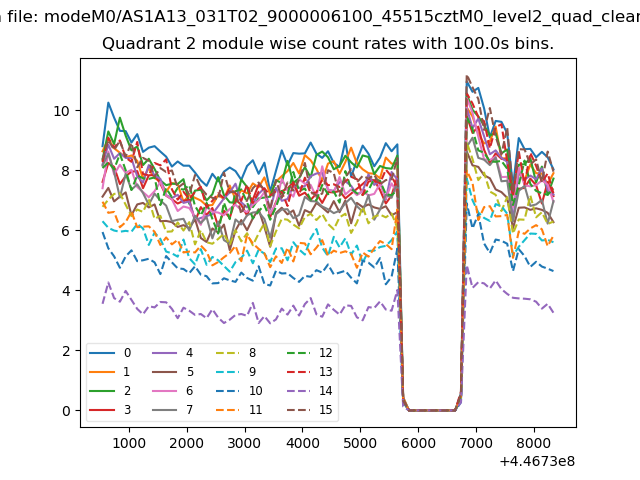
| Module-wise count rates for Quadrant B Data is divided into 100 sec bins |
 |
 |
| Module-wise count rates for Quadrant C Data is divided into 100 sec bins |
 |
 |
| Module-wise count rates for Quadrant D Data is divided into 100 sec bins |
 |
 |
| Parameter | Plot |
|---|---|
| CZT HV Monitor |  |
| D_VDD | 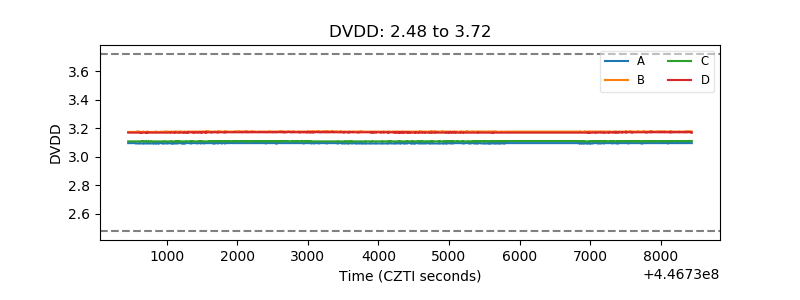 |
| Temperature 1 | 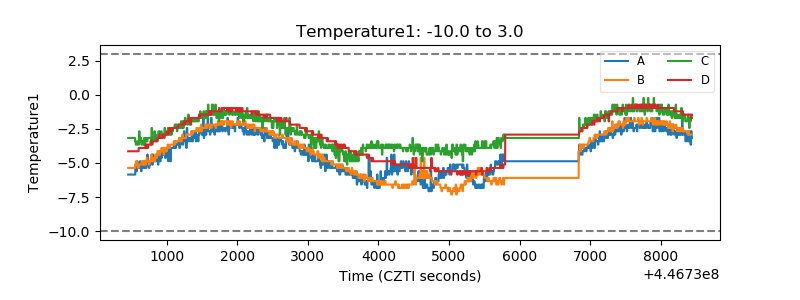 |
| Veto HV Monitor | 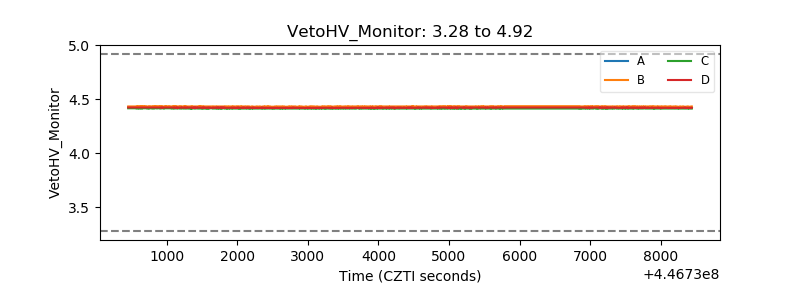 |
| Veto LLD | 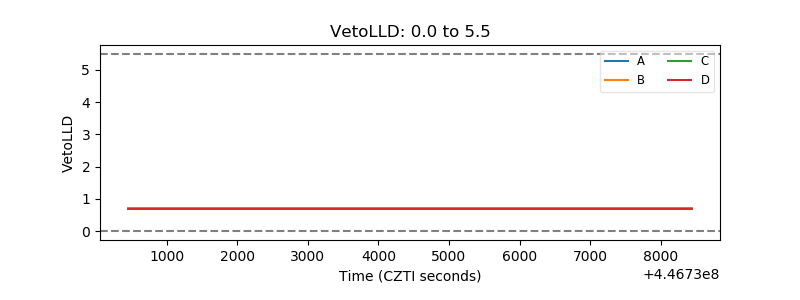 |
| Alpha Counter | 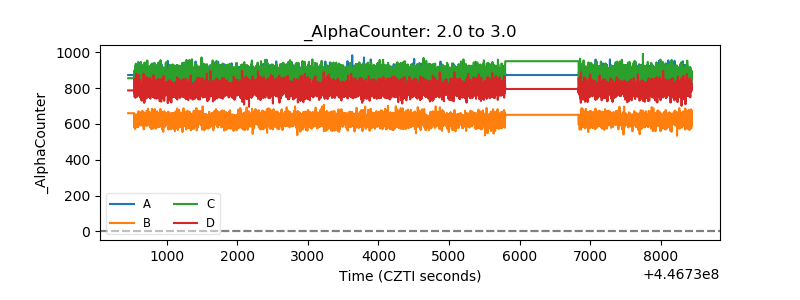 |
| _CPM_Rate | 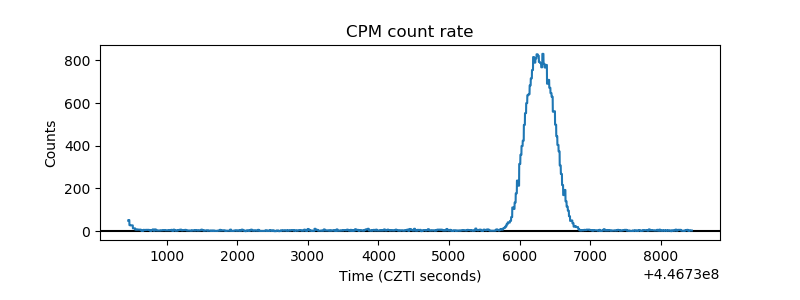 |
| CZT Counter | 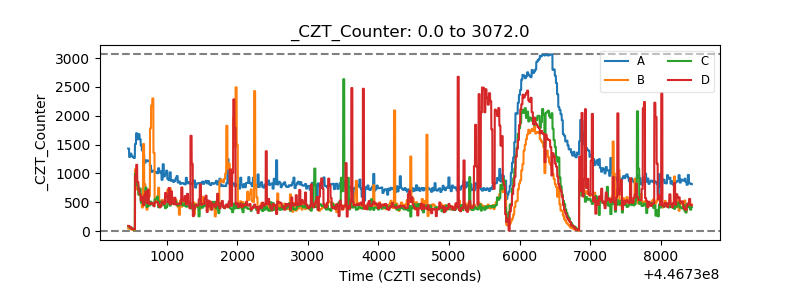 |
| +2.5 Volts monitor | 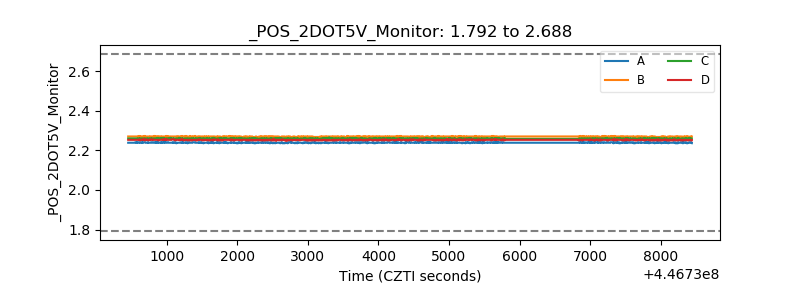 |
| +5 Volts monitor | 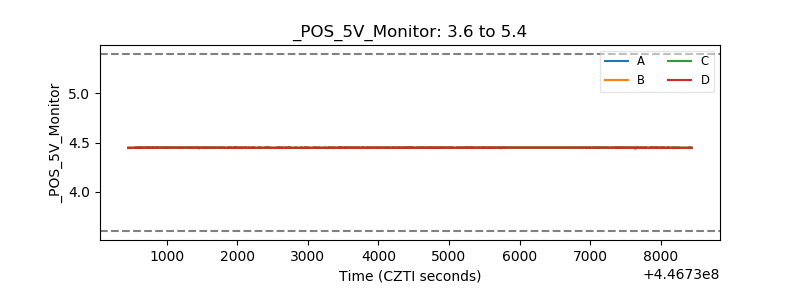 |
| _ROLL_ROT | 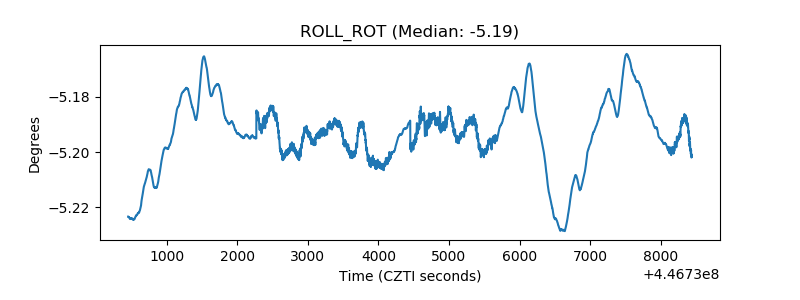 |
| _Roll_DEC | 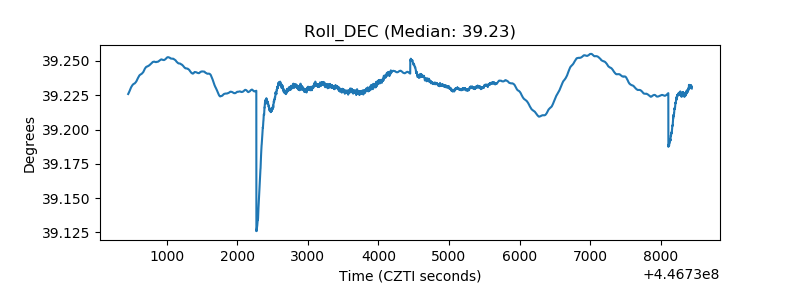 |
| _Roll_RA | 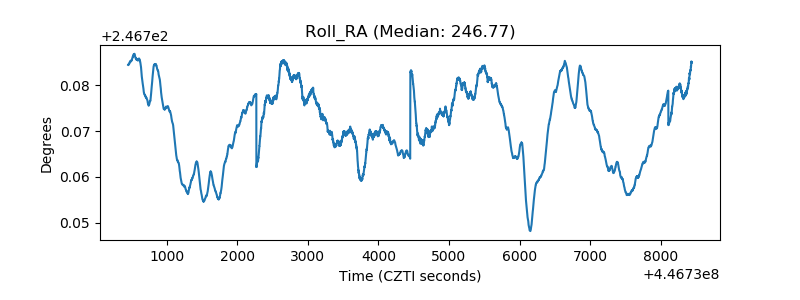 |
| Veto Counter | 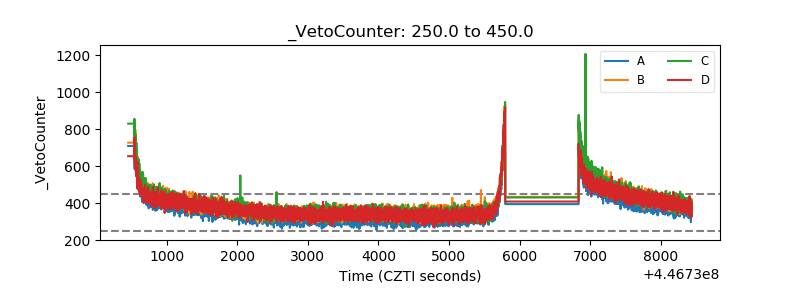 |