| Param | Original file | Final file |
|---|---|---|
| Filename | modeM0/AS1A13_031T02_9000006100_45516cztM0_level2.fits | modeM0/AS1A13_031T02_9000006100_45516cztM0_level2_quad_clean.evt |
| Size (bytes) | 466,715,520 | 111,355,200 |
| Size | 445.1 MB | 106.2 MB |
| Events in quadrant A | 5,622,585 | 755,394 |
| Events in quadrant B | 3,361,761 | 785,321 |
| Events in quadrant C | 3,236,510 | 740,852 |
| Events in quadrant D | 4,554,640 | 640,848 |
| Mode SS | |||
|---|---|---|---|
| Quadrant | BADHDUFLAG | Total packets | Discarded packets |
| A | 0 | 130 | 0 |
| B | 0 | 130 | 0 |
| C | 0 | 130 | 0 |
| D | 0 | 130 | 0 |
| Mode M0 | |||
|---|---|---|---|
| Quadrant | BADHDUFLAG | Total packets | Discarded packets |
| A | 0 | 21208 | 1 |
| B | 0 | 14205 | 1 |
| C | 0 | 14063 | 1 |
| D | 0 | 17832 | 1 |
| Mode M9 | |||
|---|---|---|---|
| Quadrant | BADHDUFLAG | Total packets | Discarded packets |
| A | 0 | 12 | 0 |
| B | 0 | 12 | 0 |
| C | 0 | 12 | 0 |
| D | 0 | 12 | 0 |
| Quadrant | Total seconds | Saturated seconds | Saturation percentage |
|---|---|---|---|
| A | 6448 | 191 | 2.962159% |
| B | 6448 | 131 | 2.031638% |
| C | 6449 | 128 | 1.984804% |
| D | 6449 | 480 | 7.443014% |
Noise dominated data is calculated using 1-second bins in cleaned event files. If a bin has >2000 counts, and if more than 50% of those come from <1% of pixels, then it is considered to be noise-dominated and hence unusable.
| Quadrant | # 1 sec bins | Bins with >0 counts | Bins with >2000 counts | High rate bins dominated by noise | Noise dominated (total time) | Noise dominated (detector-on time) | Marked lightcurve |
|---|---|---|---|---|---|---|---|
| A | 7578 | 6449 | 8 | 8 | 0.11% | 0.12% | 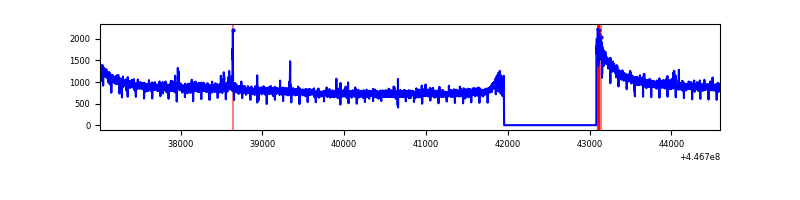 |
| B | 7578 | 6449 | 26 | 26 | 0.34% | 0.40% | 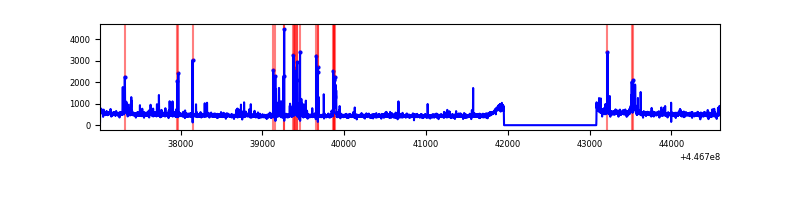 |
| C | 7579 | 6450 | 38 | 38 | 0.50% | 0.59% | 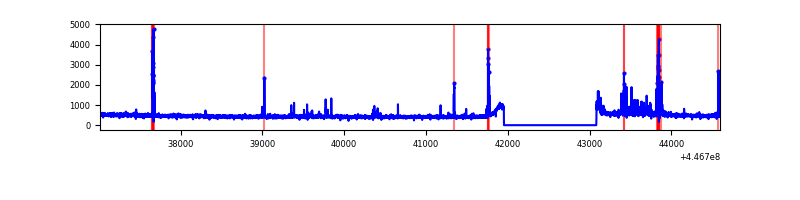 |
| D | 7579 | 6448 | 318 | 318 | 4.20% | 4.93% | 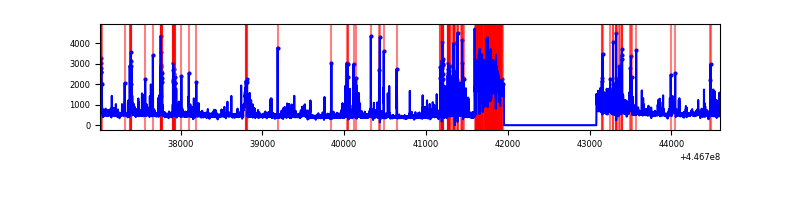 |
Top three noisy pixels from each quadrant. If the there are fewer than three noisy pixels in the level2.evt file, extra rows are filled as -1
| Pixel properties | Quadrant properties | ||||||
|---|---|---|---|---|---|---|---|
| Quadrant | DetID | PixID | Counts | Sigma | Mean | Median | Sigma |
| A | 10 | 83 | 2604389 | 16585.65 | 767 | 751 | 157.0 |
| A | 2 | 79 | 29742 | 184.68 | 767 | 751 | 157.0 |
| A | 7 | 191 | 12101 | 72.3 | 767 | 751 | 157.0 |
| B | 5 | 172 | 182858 | 1205.79 | 768 | 746 | 151.0 |
| B | 15 | 201 | 61822 | 404.39 | 768 | 746 | 151.0 |
| B | 0 | 186 | 19575 | 124.67 | 768 | 746 | 151.0 |
| C | 14 | 254 | 210301 | 1185.16 | 757 | 762 | 176.8 |
| C | 12 | 2 | 47190 | 262.6 | 757 | 762 | 176.8 |
| C | 2 | 14 | 17626 | 95.38 | 757 | 762 | 176.8 |
| D | 13 | 249 | 1093654 | 6008.01 | 726 | 704 | 181.9 |
| D | 2 | 249 | 254307 | 1394.07 | 726 | 704 | 181.9 |
| D | 1 | 52 | 218189 | 1195.53 | 726 | 704 | 181.9 |
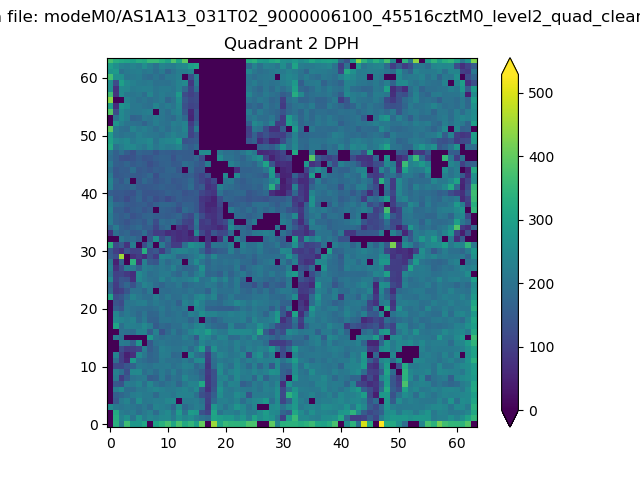
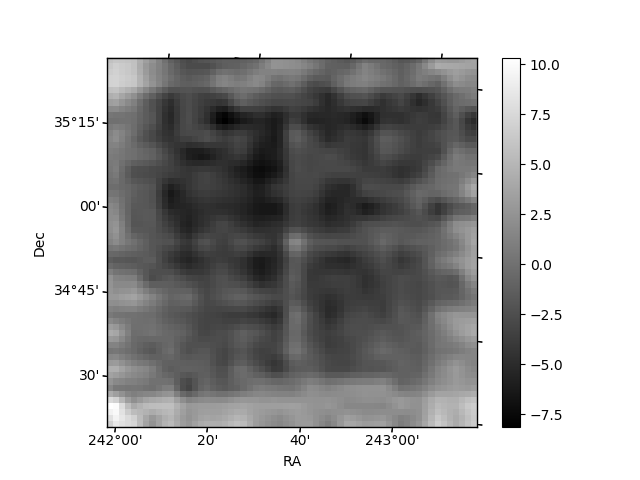
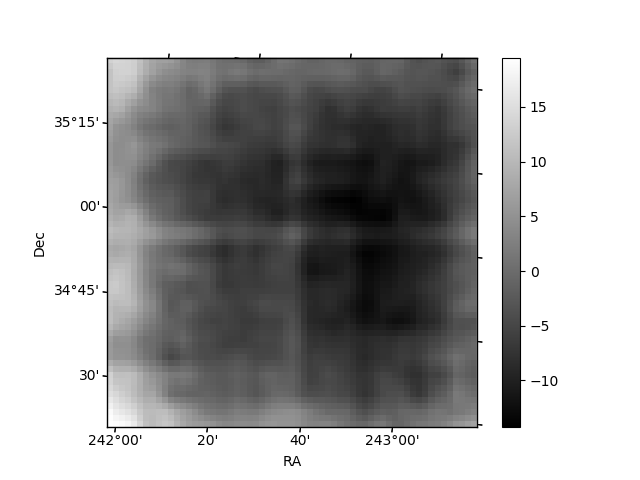
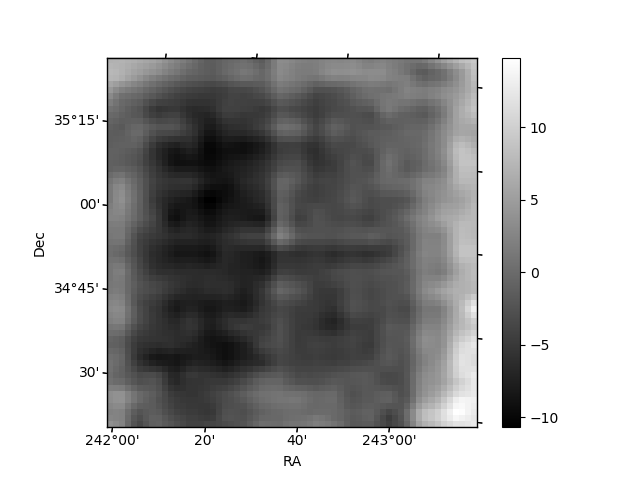
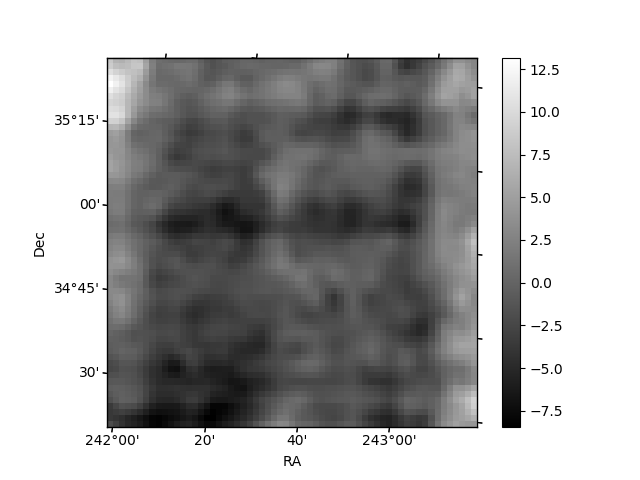
Histogram calculated using DETX and DETY for each event in the final _common_clean file
| Quadrant A | 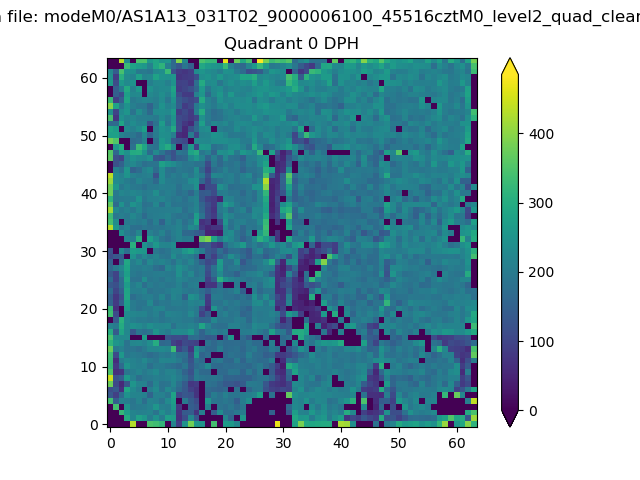 |
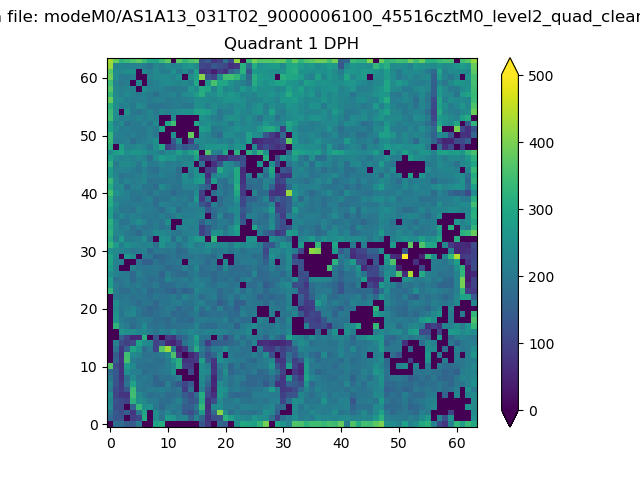 |
Quadrant B |
|---|---|---|---|
| Quadrant D | 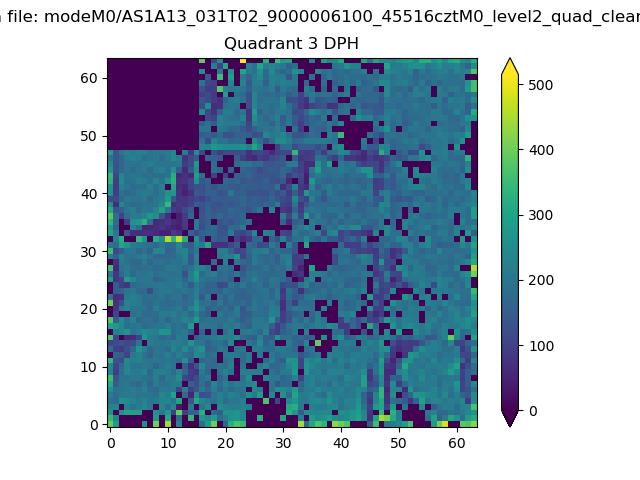 |
 |
Quadrant C |
| Plot type | Count rate plots | Images |
|---|---|---|
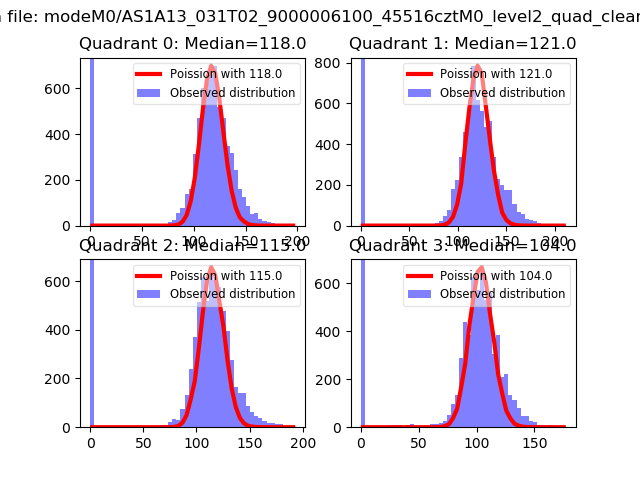
| Comparison with Poisson distribution Blue bars denote a histogram of data divided into 1 sec bins. Red curve is a Poisson curve with rate = median count rate of data. |
 |
 |
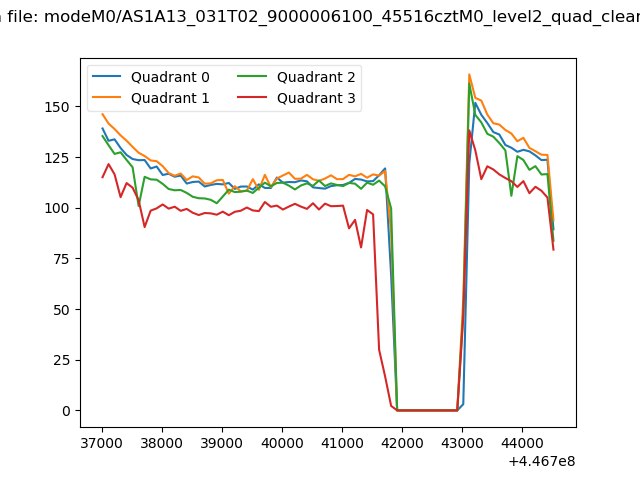
| Quadrant-wise count rates Data is divided into 100 sec bins |
 |
|
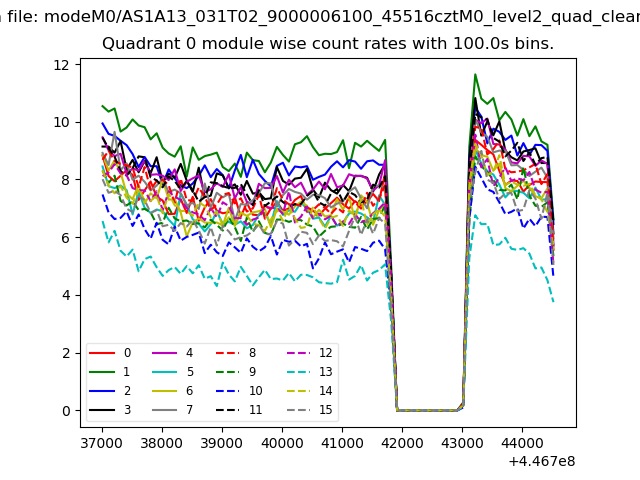
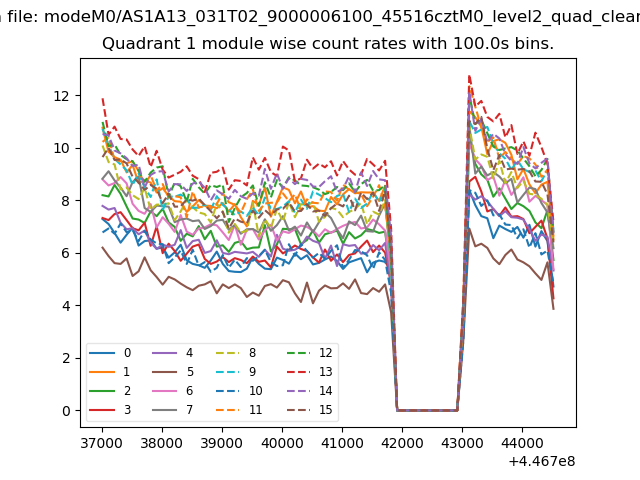
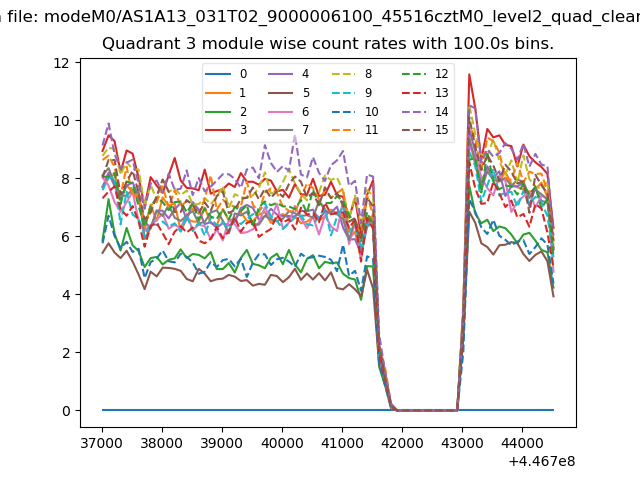
| Module-wise count rates for Quadrant A Data is divided into 100 sec bins |
 |
 |
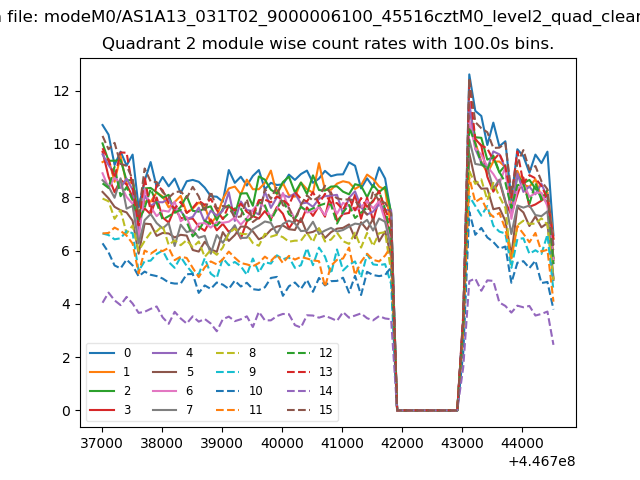
| Module-wise count rates for Quadrant B Data is divided into 100 sec bins |
 |
 |
| Module-wise count rates for Quadrant C Data is divided into 100 sec bins |
 |
 |
| Module-wise count rates for Quadrant D Data is divided into 100 sec bins |
 |
 |
| Parameter | Plot |
|---|---|
| CZT HV Monitor |  |
| D_VDD | 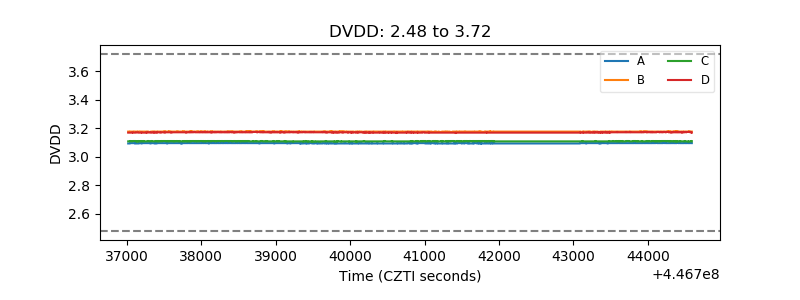 |
| Temperature 1 | 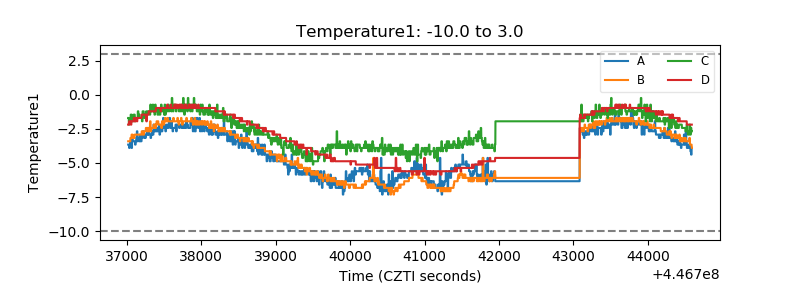 |
| Veto HV Monitor | 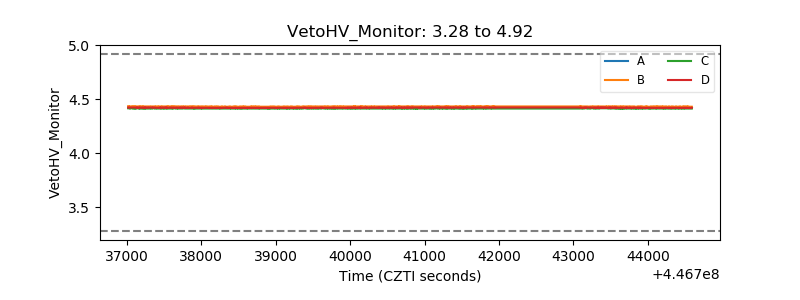 |
| Veto LLD | 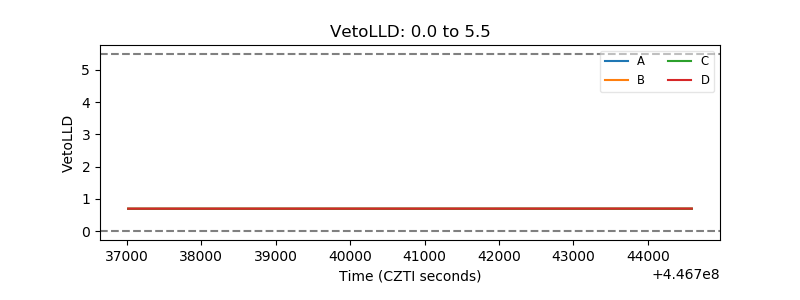 |
| Alpha Counter | 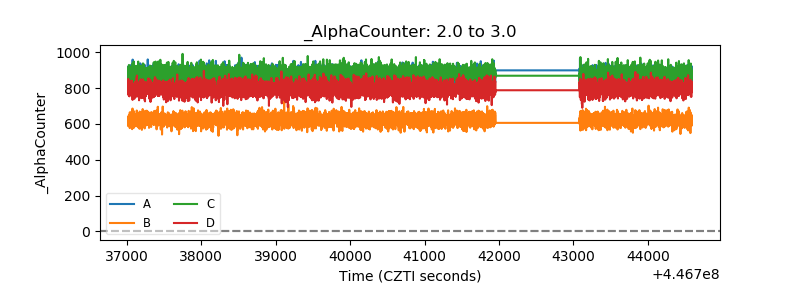 |
| _CPM_Rate | 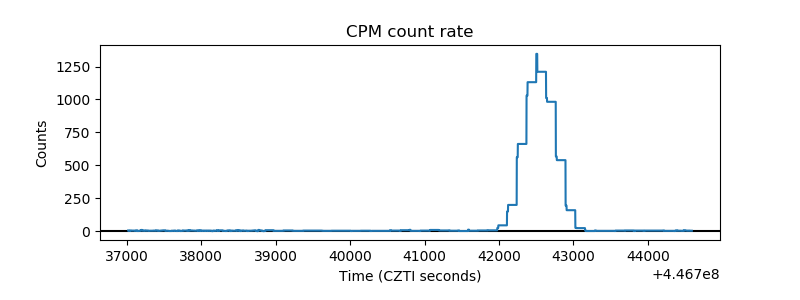 |
| CZT Counter | 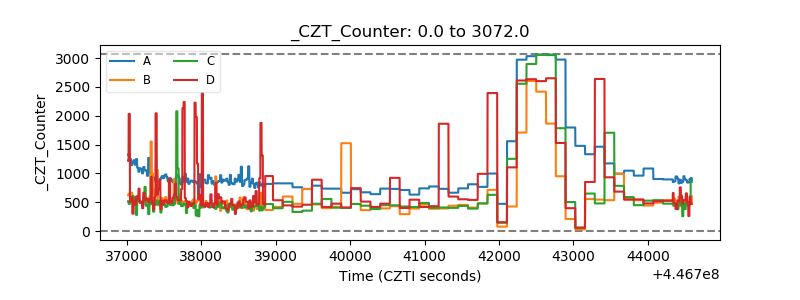 |
| +2.5 Volts monitor | 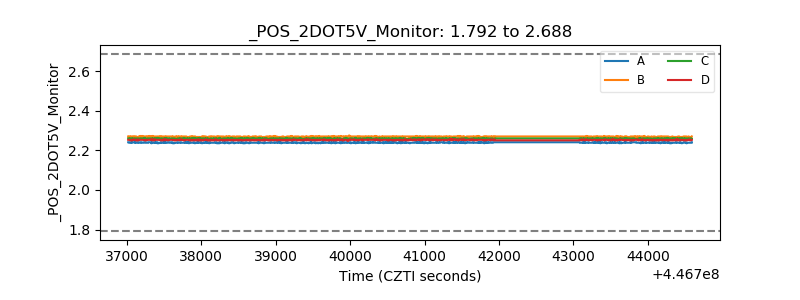 |
| +5 Volts monitor | 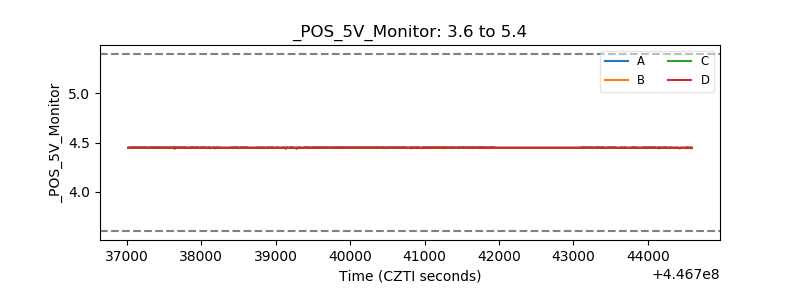 |
| _ROLL_ROT | 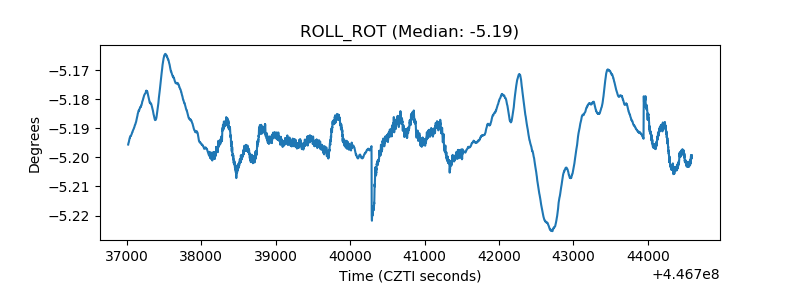 |
| _Roll_DEC | 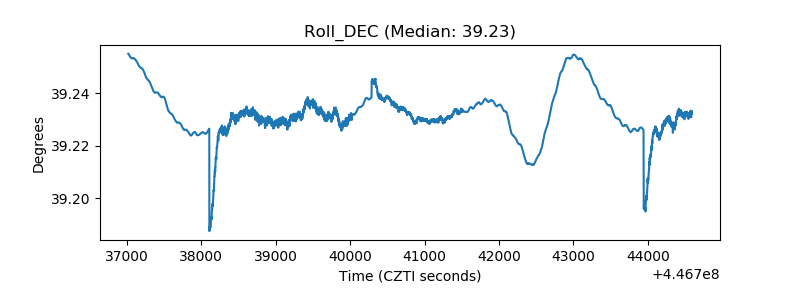 |
| _Roll_RA | 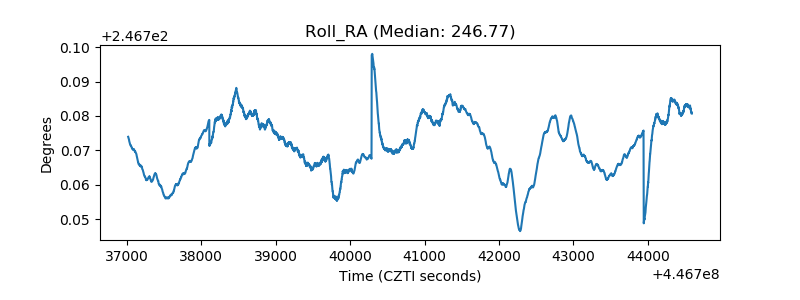 |
| Veto Counter | 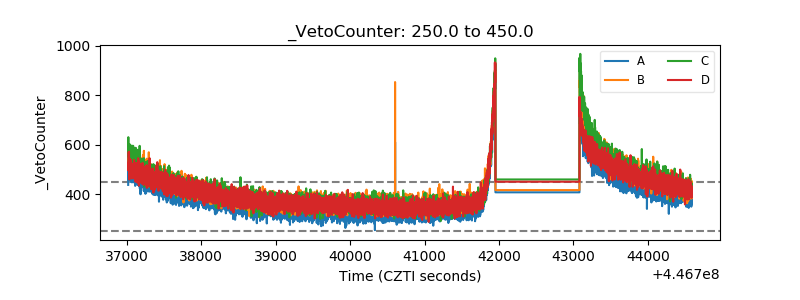 |