| Param | Original file | Final file |
|---|---|---|
| Filename | modeM0/AS1A13_031T02_9000006100_45517cztM0_level2.fits | modeM0/AS1A13_031T02_9000006100_45517cztM0_level2_quad_clean.evt |
| Size (bytes) | 457,692,480 | 115,983,360 |
| Size | 436.5 MB | 110.6 MB |
| Events in quadrant A | 5,907,657 | 770,144 |
| Events in quadrant B | 3,345,717 | 817,822 |
| Events in quadrant C | 3,334,595 | 776,002 |
| Events in quadrant D | 3,854,882 | 699,580 |
| Mode SS | |||
|---|---|---|---|
| Quadrant | BADHDUFLAG | Total packets | Discarded packets |
| A | 0 | 130 | 0 |
| B | 0 | 130 | 0 |
| C | 0 | 130 | 0 |
| D | 0 | 130 | 0 |
| Mode M0 | |||
|---|---|---|---|
| Quadrant | BADHDUFLAG | Total packets | Discarded packets |
| A | 0 | 22156 | 3 |
| B | 0 | 14117 | 2 |
| C | 0 | 14209 | 2 |
| D | 0 | 15738 | 2 |
| Mode M9 | |||
|---|---|---|---|
| Quadrant | BADHDUFLAG | Total packets | Discarded packets |
| A | 0 | 15 | 0 |
| B | 0 | 16 | 0 |
| C | 0 | 16 | 0 |
| D | 0 | 16 | 0 |
| Quadrant | Total seconds | Saturated seconds | Saturation percentage |
|---|---|---|---|
| A | 6434 | 271 | 4.211999% |
| B | 6434 | 114 | 1.771837% |
| C | 6434 | 109 | 1.694125% |
| D | 6434 | 170 | 2.642213% |
Noise dominated data is calculated using 1-second bins in cleaned event files. If a bin has >2000 counts, and if more than 50% of those come from <1% of pixels, then it is considered to be noise-dominated and hence unusable.
| Quadrant | # 1 sec bins | Bins with >0 counts | Bins with >2000 counts | High rate bins dominated by noise | Noise dominated (total time) | Noise dominated (detector-on time) | Marked lightcurve |
|---|---|---|---|---|---|---|---|
| A | 7624 | 6435 | 16 | 16 | 0.21% | 0.25% | 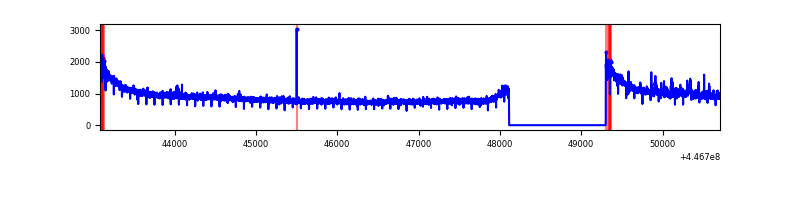 |
| B | 7624 | 6435 | 19 | 19 | 0.25% | 0.30% | 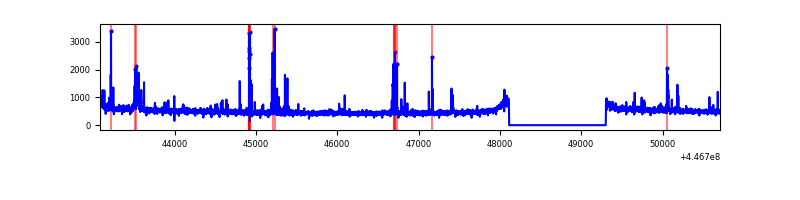 |
| C | 7624 | 6435 | 35 | 35 | 0.46% | 0.54% | 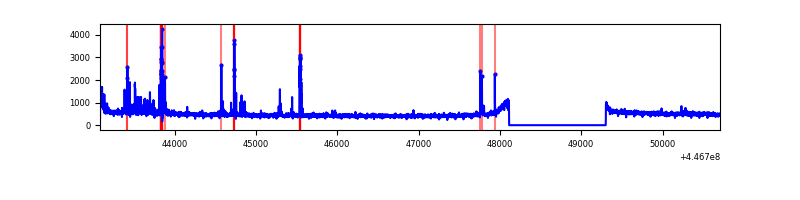 |
| D | 7624 | 6435 | 63 | 63 | 0.83% | 0.98% | 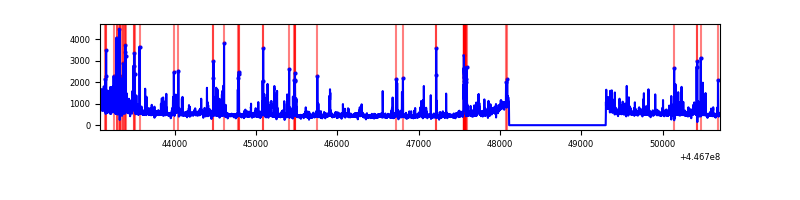 |
Top three noisy pixels from each quadrant. If the there are fewer than three noisy pixels in the level2.evt file, extra rows are filled as -1
| Pixel properties | Quadrant properties | ||||||
|---|---|---|---|---|---|---|---|
| Quadrant | DetID | PixID | Counts | Sigma | Mean | Median | Sigma |
| A | 10 | 83 | 2766673 | 17144.88 | 782 | 767 | 161.3 |
| A | 2 | 79 | 54822 | 335.07 | 782 | 767 | 161.3 |
| A | 7 | 3 | 34913 | 211.66 | 782 | 767 | 161.3 |
| B | 5 | 172 | 114978 | 742.35 | 790 | 768 | 153.8 |
| B | 15 | 201 | 51119 | 327.28 | 790 | 768 | 153.8 |
| B | 0 | 186 | 18960 | 118.25 | 790 | 768 | 153.8 |
| C | 14 | 254 | 258290 | 1415.18 | 782 | 788 | 182.0 |
| C | 3 | 233 | 16796 | 87.98 | 782 | 788 | 182.0 |
| C | 2 | 14 | 12661 | 65.25 | 782 | 788 | 182.0 |
| D | 13 | 249 | 218119 | 1126.08 | 775 | 751 | 193.0 |
| D | 1 | 52 | 213110 | 1100.13 | 775 | 751 | 193.0 |
| D | 2 | 249 | 207233 | 1069.68 | 775 | 751 | 193.0 |
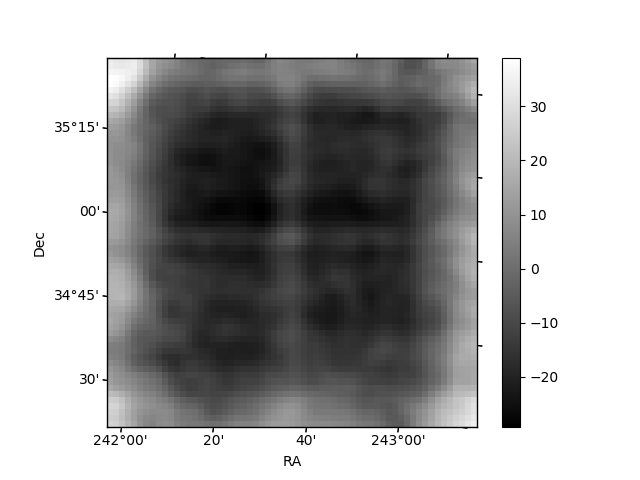
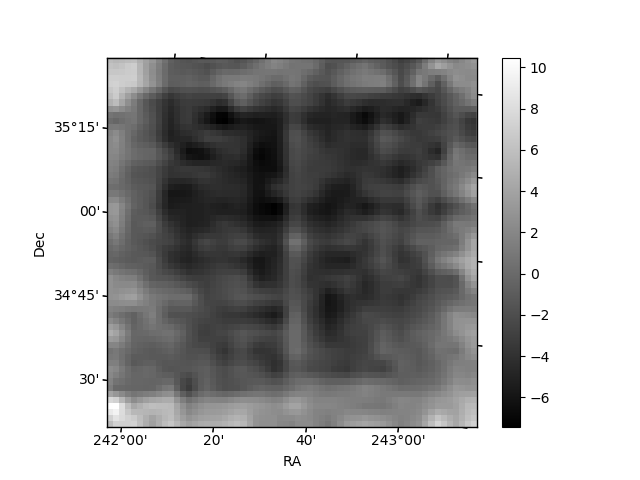
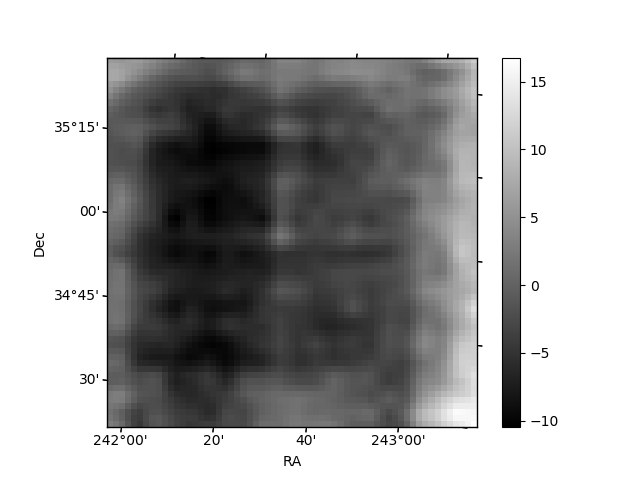
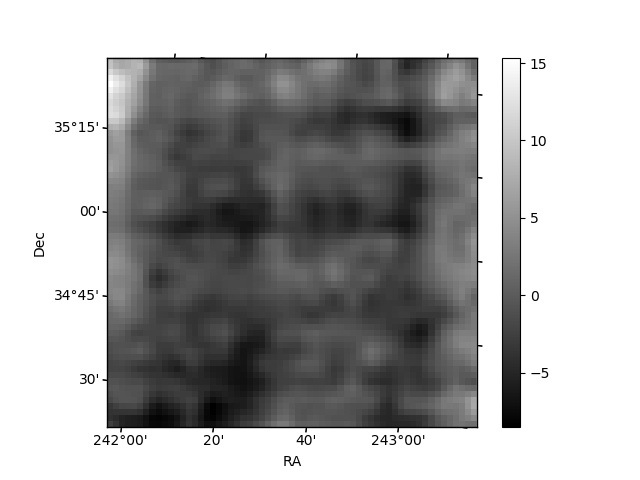
Histogram calculated using DETX and DETY for each event in the final _common_clean file
| Quadrant A | 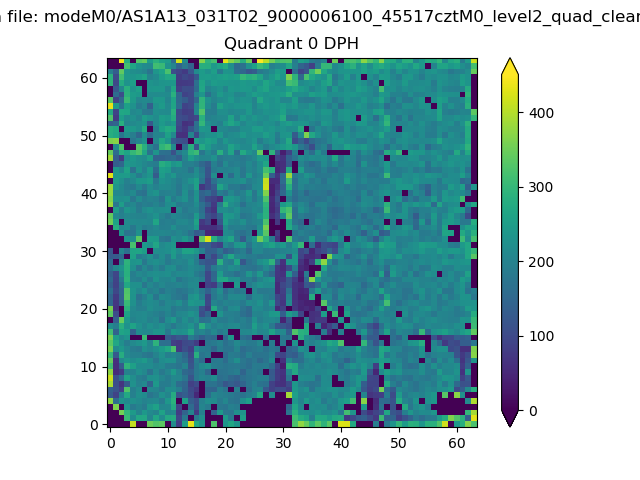 |
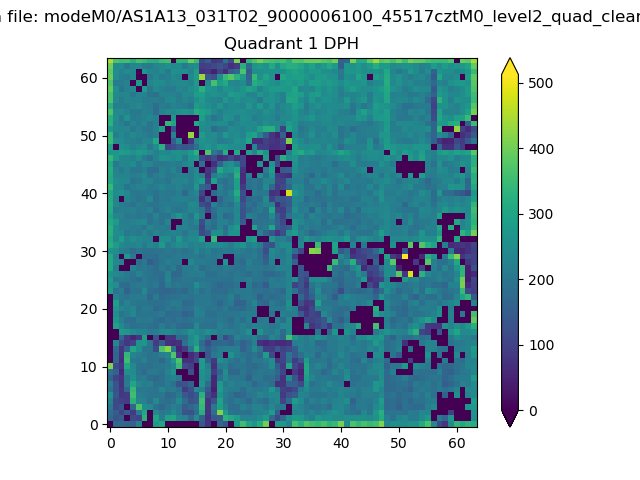 |
Quadrant B |
|---|---|---|---|
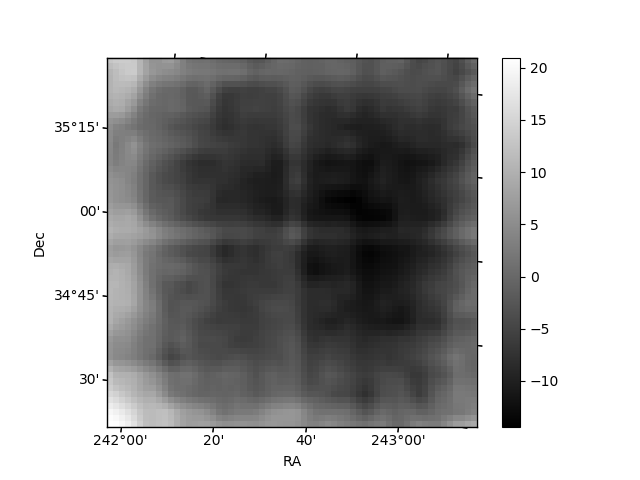
| Quadrant D | 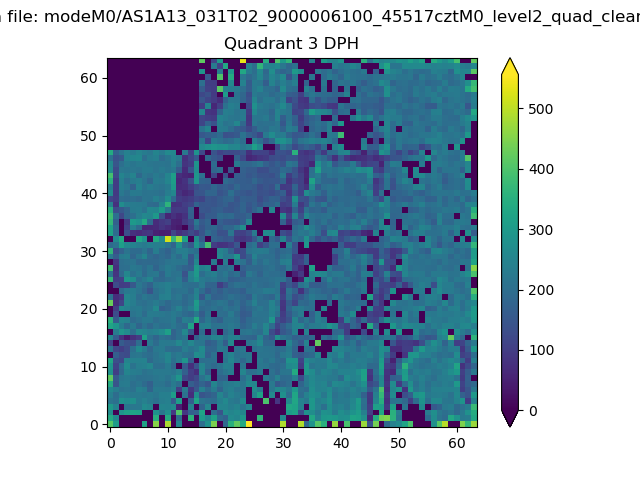 |
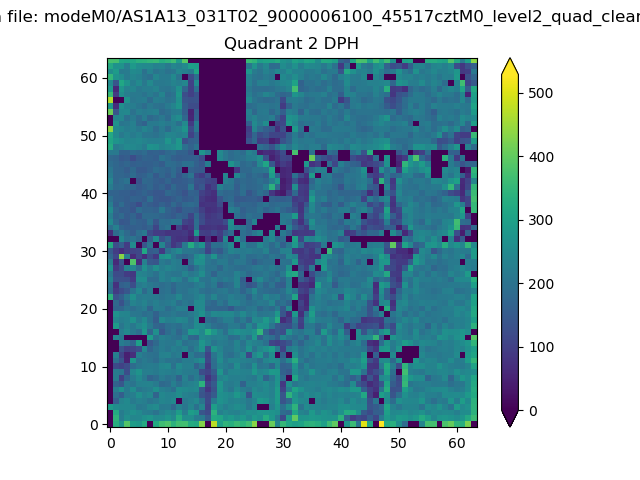 |
Quadrant C |
| Plot type | Count rate plots | Images |
|---|---|---|
| Comparison with Poisson distribution Blue bars denote a histogram of data divided into 1 sec bins. Red curve is a Poisson curve with rate = median count rate of data. |
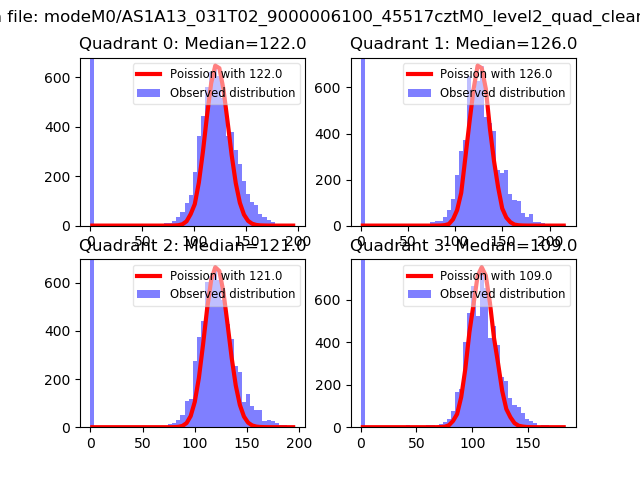 |
 |
| Quadrant-wise count rates Data is divided into 100 sec bins |
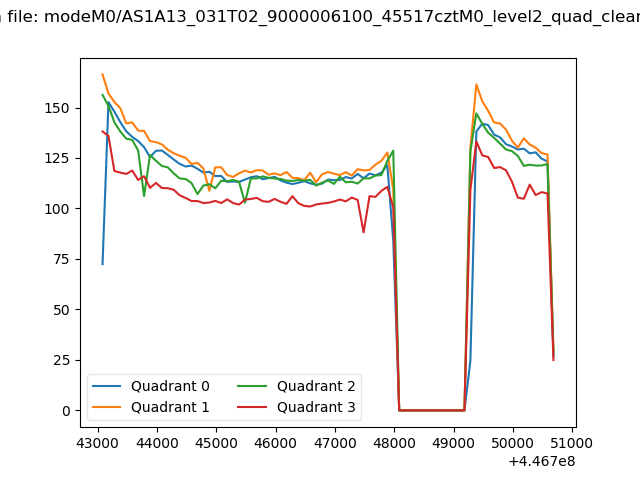 |
|
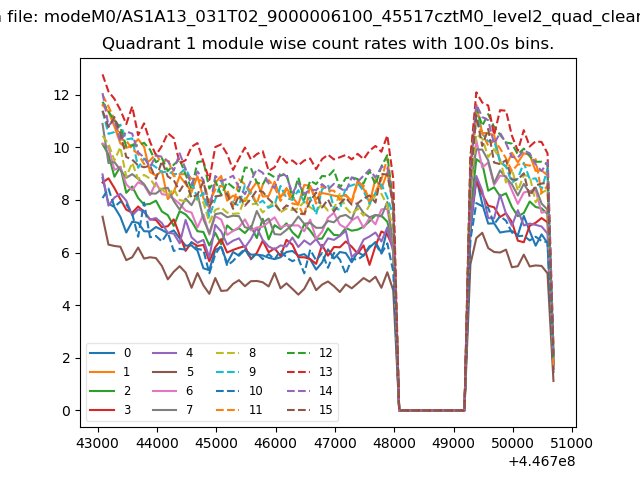
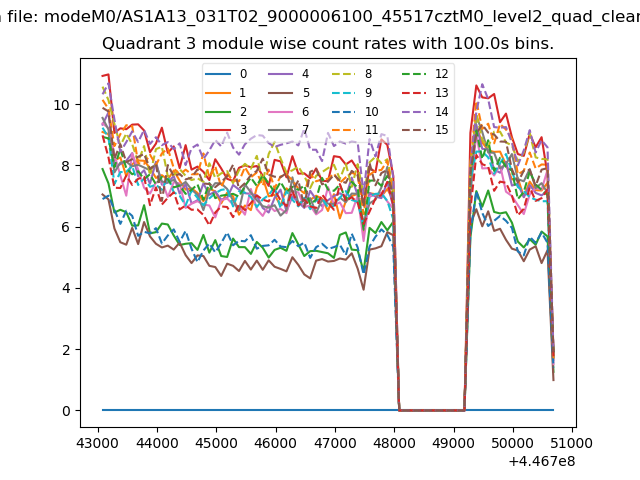
| Module-wise count rates for Quadrant A Data is divided into 100 sec bins |
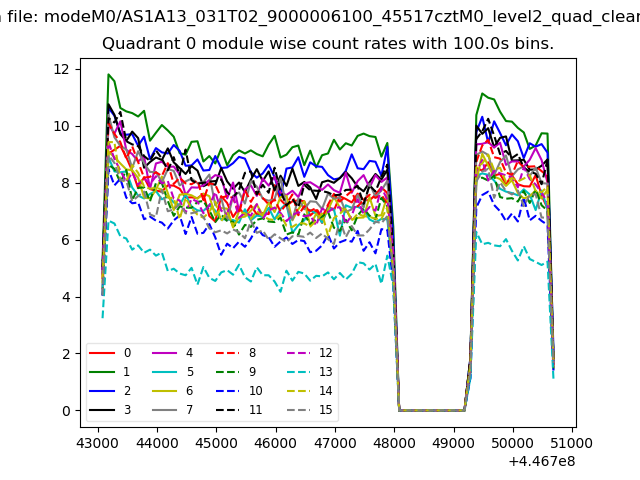 |
 |
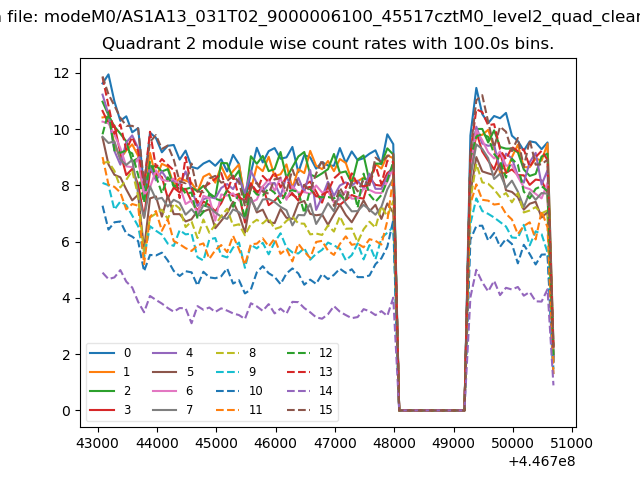
| Module-wise count rates for Quadrant B Data is divided into 100 sec bins |
 |
 |
| Module-wise count rates for Quadrant C Data is divided into 100 sec bins |
 |
 |
| Module-wise count rates for Quadrant D Data is divided into 100 sec bins |
 |
 |
| Parameter | Plot |
|---|---|
| CZT HV Monitor | 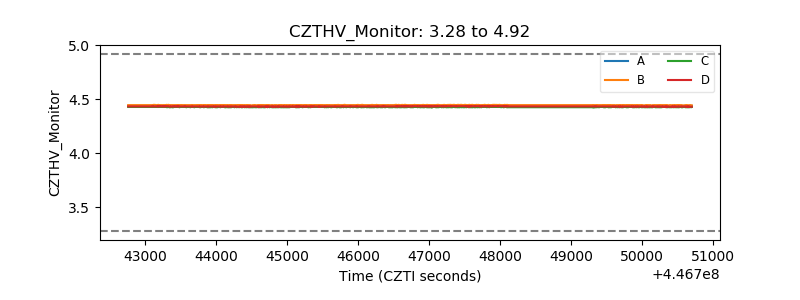 |
| D_VDD | 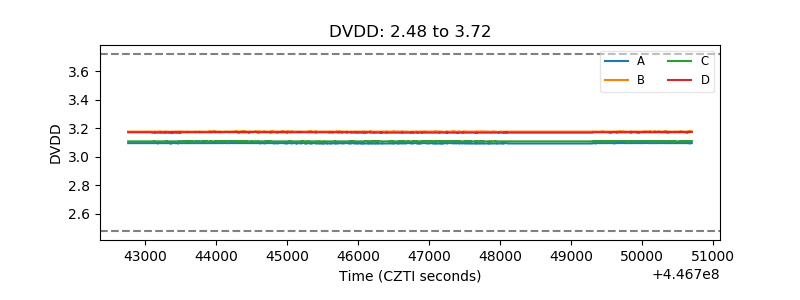 |
| Temperature 1 | 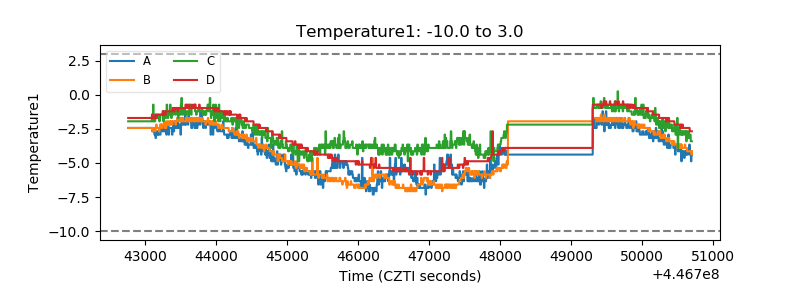 |
| Veto HV Monitor | 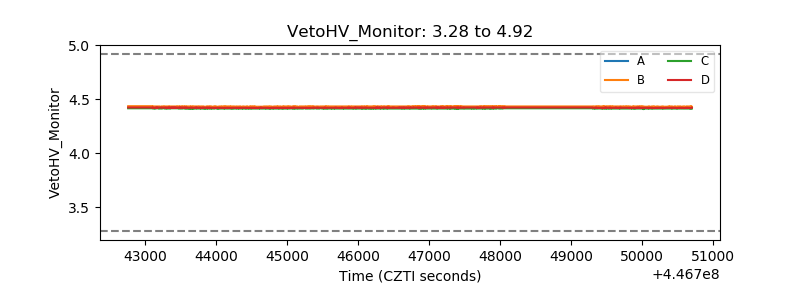 |
| Veto LLD | 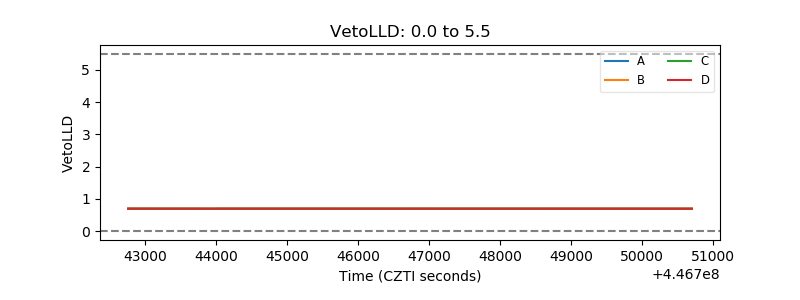 |
| Alpha Counter | 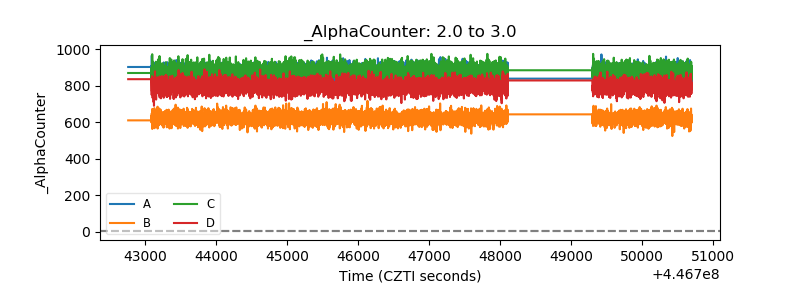 |
| _CPM_Rate | 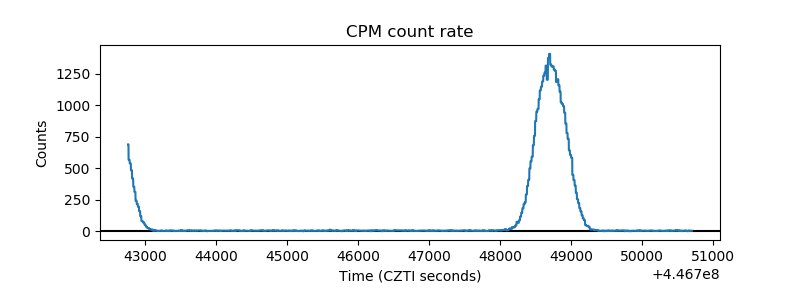 |
| CZT Counter | 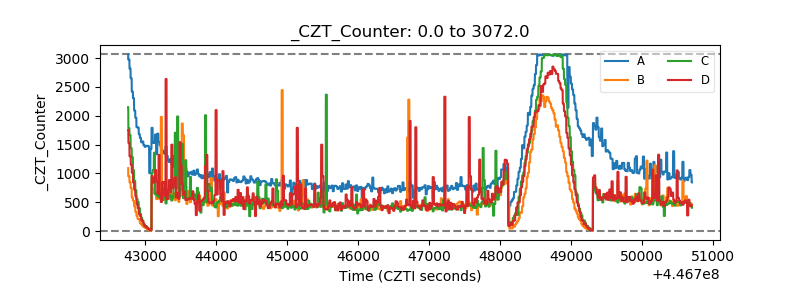 |
| +2.5 Volts monitor | 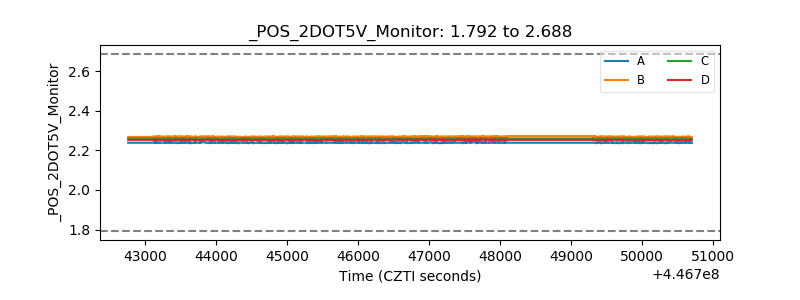 |
| +5 Volts monitor | 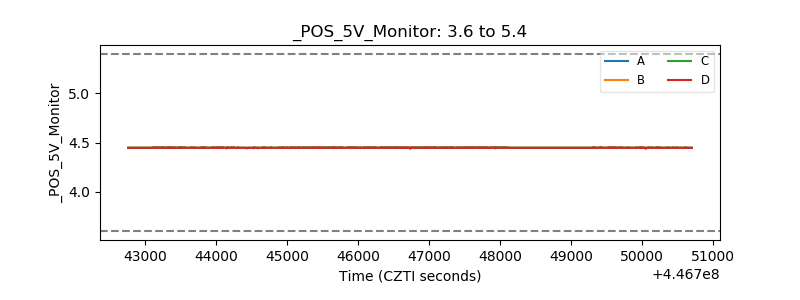 |
| _ROLL_ROT | 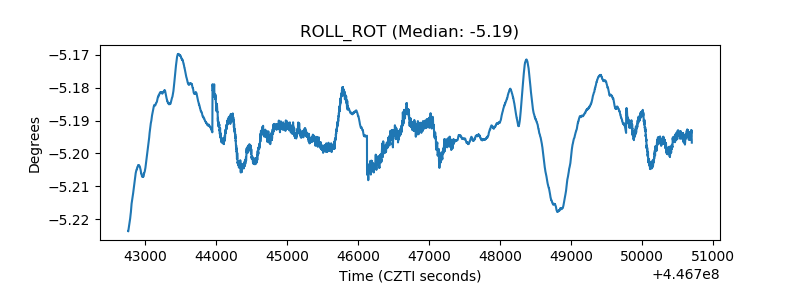 |
| _Roll_DEC | 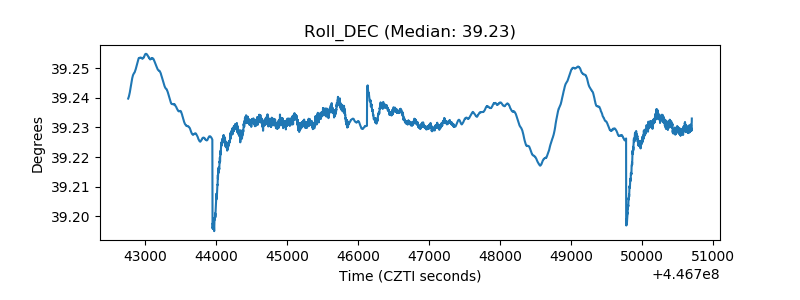 |
| _Roll_RA | 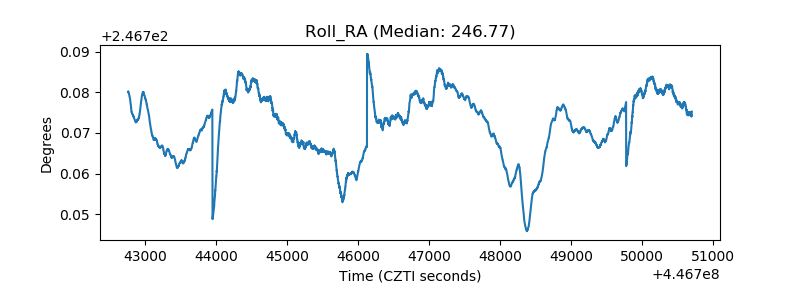 |
| Veto Counter | 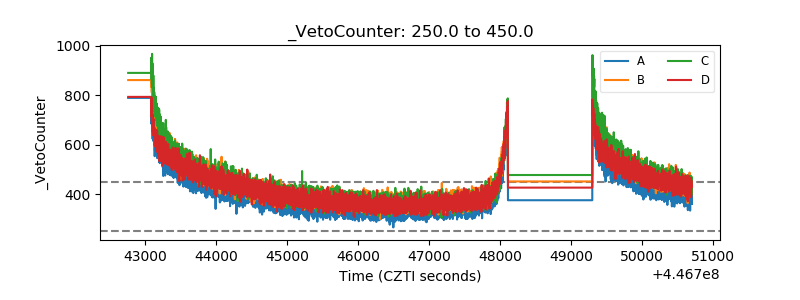 |