| Param | Original file | Final file |
|---|---|---|
| Filename | modeM0/AS1A13_031T02_9000006100_45518cztM0_level2.fits | modeM0/AS1A13_031T02_9000006100_45518cztM0_level2_quad_clean.evt |
| Size (bytes) | 194,745,600 | 50,529,600 |
| Size | 185.7 MB | 48.2 MB |
| Events in quadrant A | 2,627,167 | 334,272 |
| Events in quadrant B | 1,424,639 | 357,124 |
| Events in quadrant C | 1,319,430 | 338,595 |
| Events in quadrant D | 1,623,086 | 304,646 |
| Mode SS | |||
|---|---|---|---|
| Quadrant | BADHDUFLAG | Total packets | Discarded packets |
| A | 0 | 54 | 0 |
| B | 0 | 54 | 0 |
| C | 0 | 54 | 0 |
| D | 0 | 54 | 0 |
| Mode M0 | |||
|---|---|---|---|
| Quadrant | BADHDUFLAG | Total packets | Discarded packets |
| A | 0 | 9794 | 1 |
| B | 0 | 5983 | 1 |
| C | 0 | 5658 | 1 |
| D | 0 | 6607 | 1 |
| Mode M9 | |||
|---|---|---|---|
| Quadrant | BADHDUFLAG | Total packets | Discarded packets |
| A | 0 | 8 | 0 |
| B | 0 | 9 | 0 |
| C | 0 | 9 | 0 |
| D | 0 | 9 | 0 |
| Quadrant | Total seconds | Saturated seconds | Saturation percentage |
|---|---|---|---|
| A | 2736 | 109 | 3.983918% |
| B | 2736 | 23 | 0.840643% |
| C | 2736 | 8 | 0.292398% |
| D | 2736 | 54 | 1.973684% |
Noise dominated data is calculated using 1-second bins in cleaned event files. If a bin has >2000 counts, and if more than 50% of those come from <1% of pixels, then it is considered to be noise-dominated and hence unusable.
| Quadrant | # 1 sec bins | Bins with >0 counts | Bins with >2000 counts | High rate bins dominated by noise | Noise dominated (total time) | Noise dominated (detector-on time) | Marked lightcurve |
|---|---|---|---|---|---|---|---|
| A | 2736 | 2736 | 8 | 8 | 0.29% | 0.29% | 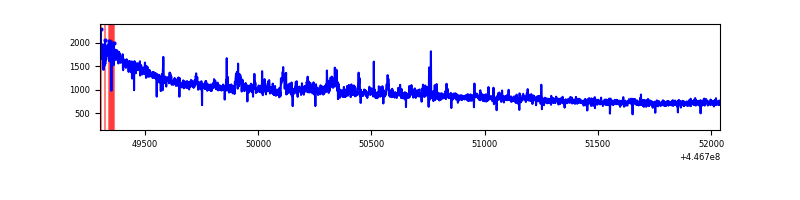 |
| B | 2736 | 2736 | 9 | 9 | 0.33% | 0.33% | 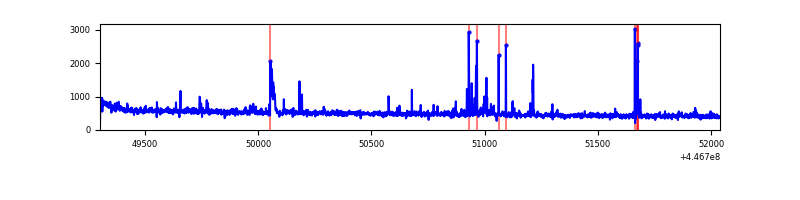 |
| C | 2736 | 2736 | 0 | 0 | 0.00% | 0.00% | 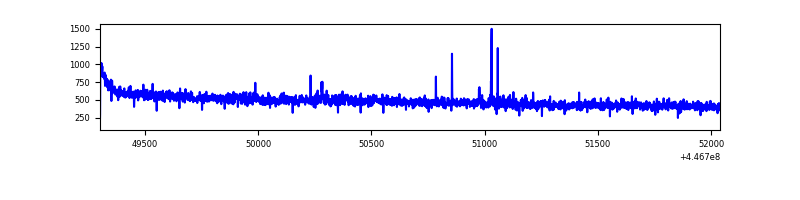 |
| D | 2736 | 2736 | 22 | 22 | 0.80% | 0.80% | 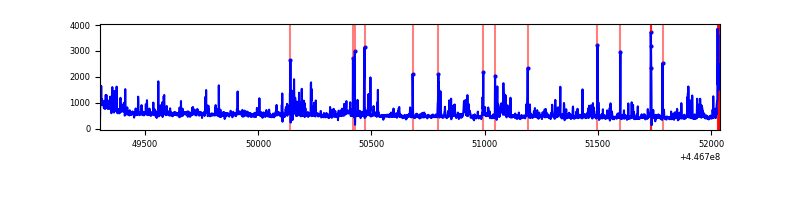 |
Top three noisy pixels from each quadrant. If the there are fewer than three noisy pixels in the level2.evt file, extra rows are filled as -1
| Pixel properties | Quadrant properties | ||||||
|---|---|---|---|---|---|---|---|
| Quadrant | DetID | PixID | Counts | Sigma | Mean | Median | Sigma |
| A | 10 | 83 | 1236911 | 17861.21 | 331 | 325 | 69.2 |
| A | 2 | 79 | 48474 | 695.46 | 331 | 325 | 69.2 |
| A | 7 | 3 | 38843 | 556.35 | 331 | 325 | 69.2 |
| B | 5 | 172 | 60836 | 916.37 | 335 | 326 | 66.0 |
| B | 15 | 201 | 24128 | 360.46 | 335 | 326 | 66.0 |
| B | 3 | 112 | 9378 | 137.08 | 335 | 326 | 66.0 |
| C | 14 | 254 | 6770 | 81.54 | 335 | 337 | 78.9 |
| C | 3 | 233 | 5599 | 66.7 | 335 | 337 | 78.9 |
| C | 13 | 61 | 2307 | 24.97 | 335 | 337 | 78.9 |
| D | 1 | 52 | 201797 | 2405.36 | 330 | 320 | 83.8 |
| D | 2 | 249 | 47146 | 559.04 | 330 | 320 | 83.8 |
| D | 11 | 241 | 26994 | 318.45 | 330 | 320 | 83.8 |
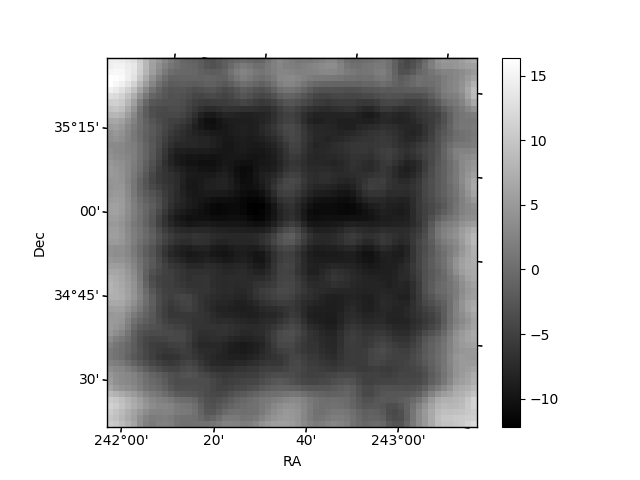
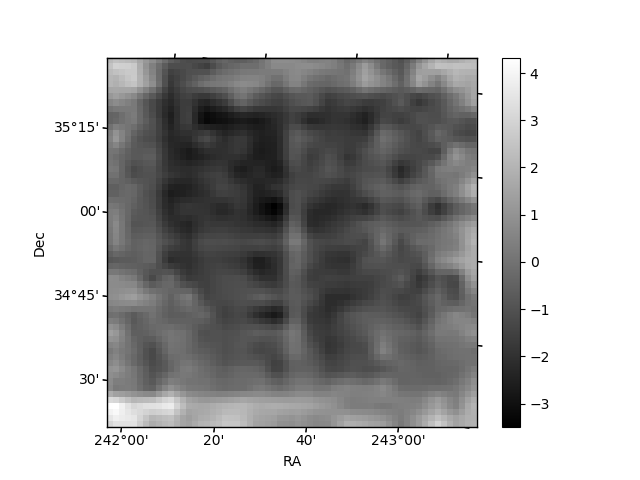
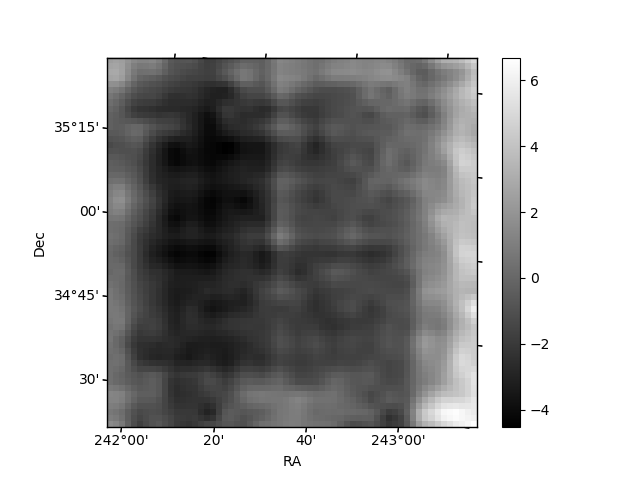
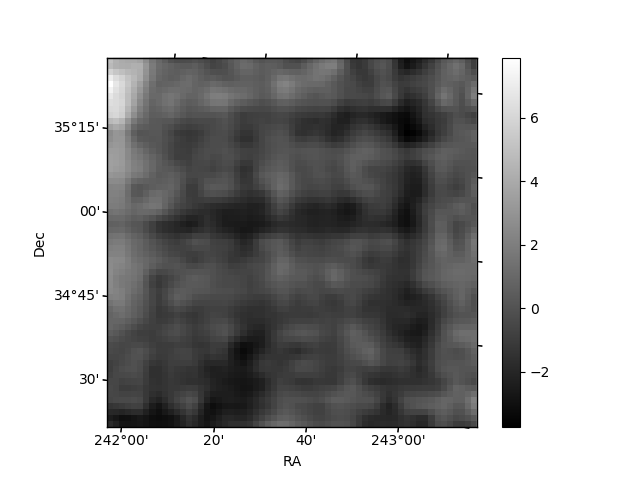
Histogram calculated using DETX and DETY for each event in the final _common_clean file
| Quadrant A | 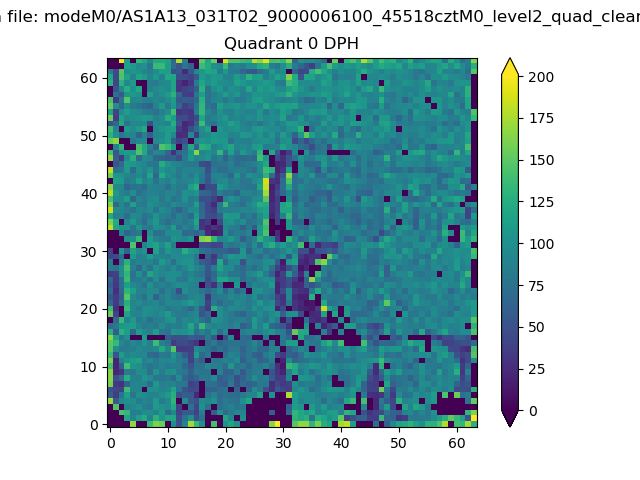 |
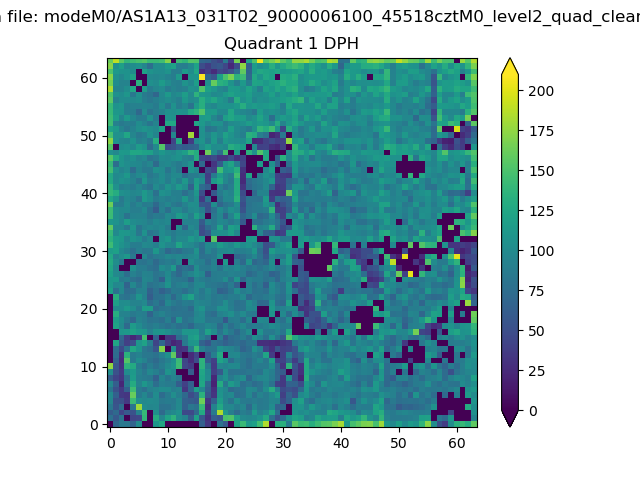 |
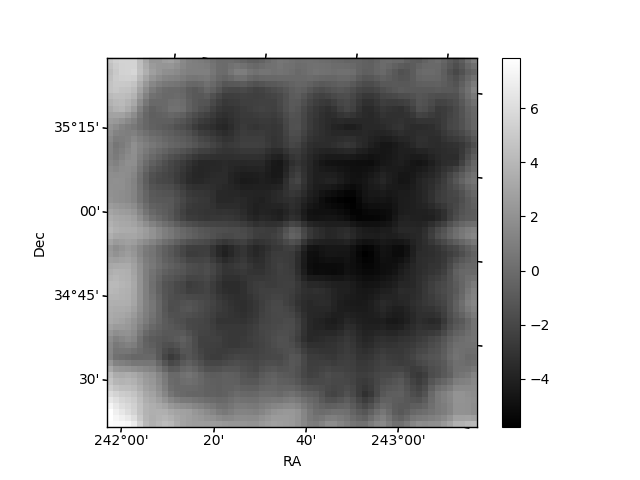
Quadrant B |
|---|---|---|---|
| Quadrant D | 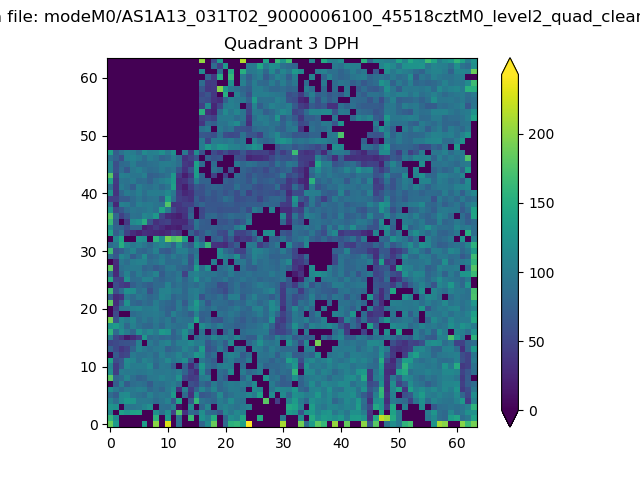 |
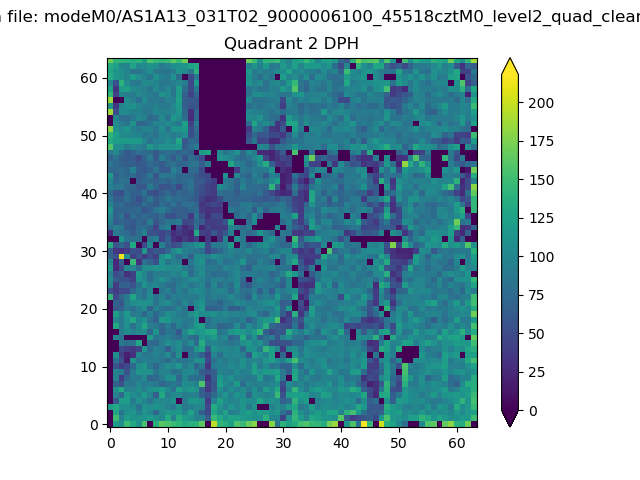 |
Quadrant C |
| Plot type | Count rate plots | Images |
|---|---|---|
| Comparison with Poisson distribution Blue bars denote a histogram of data divided into 1 sec bins. Red curve is a Poisson curve with rate = median count rate of data. |
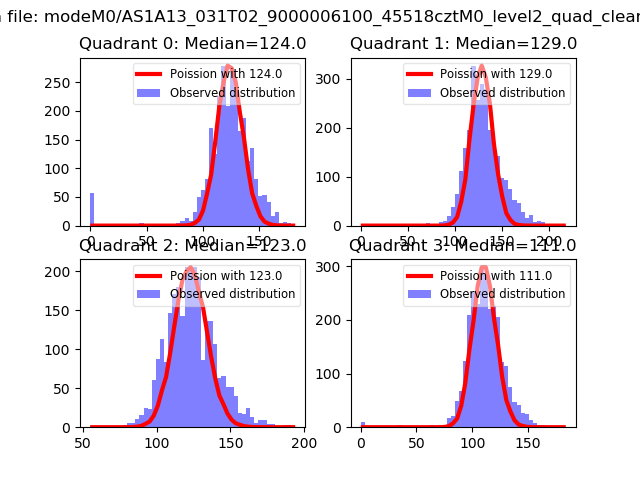 |
 |
| Quadrant-wise count rates Data is divided into 100 sec bins |
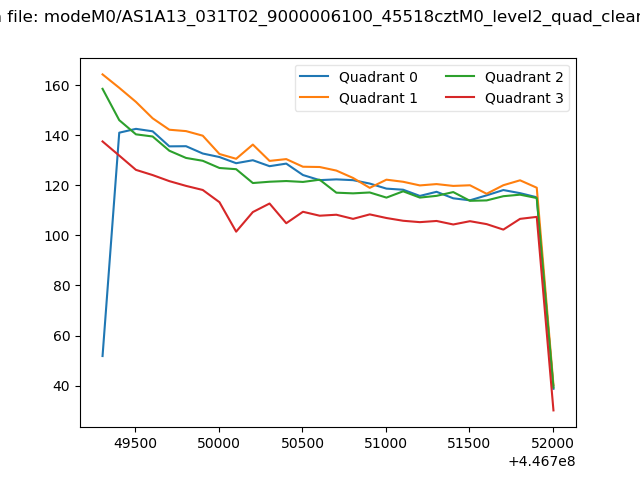 |
|
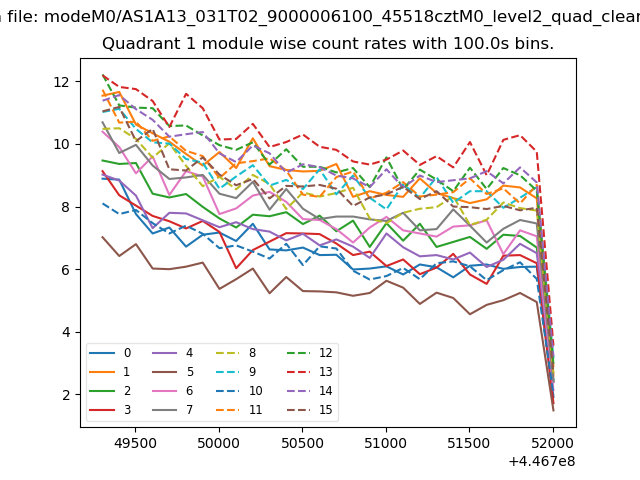
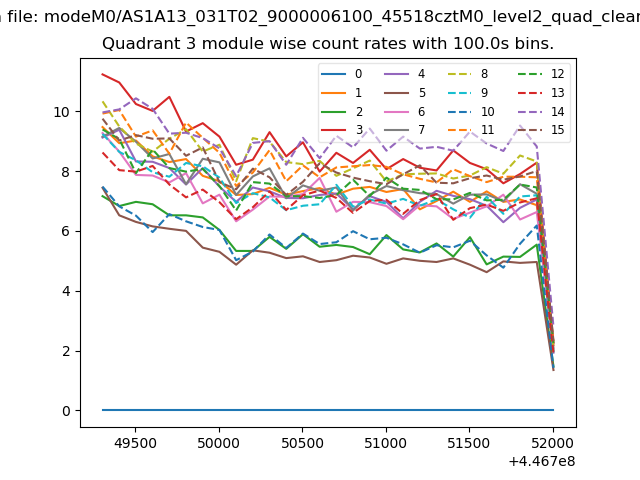
| Module-wise count rates for Quadrant A Data is divided into 100 sec bins |
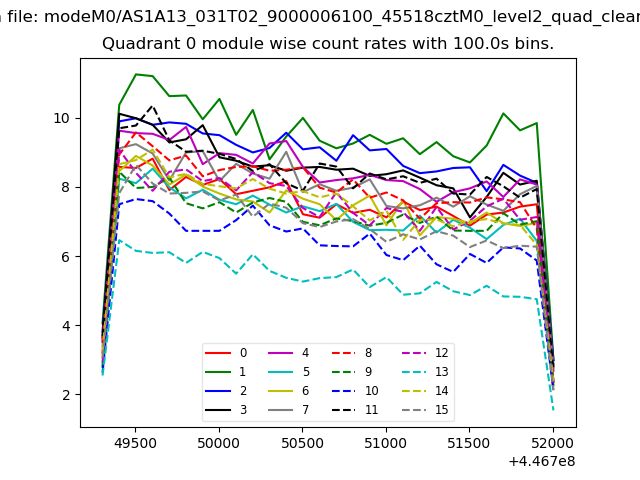 |
 |
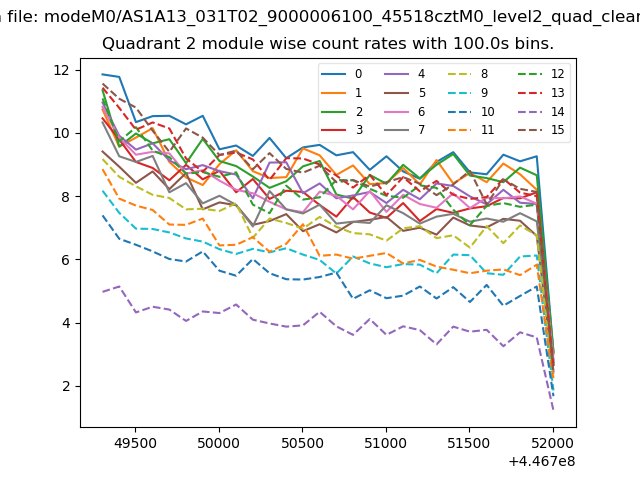
| Module-wise count rates for Quadrant B Data is divided into 100 sec bins |
 |
 |
| Module-wise count rates for Quadrant C Data is divided into 100 sec bins |
 |
 |
| Module-wise count rates for Quadrant D Data is divided into 100 sec bins |
 |
 |
| Parameter | Plot |
|---|---|
| CZT HV Monitor | 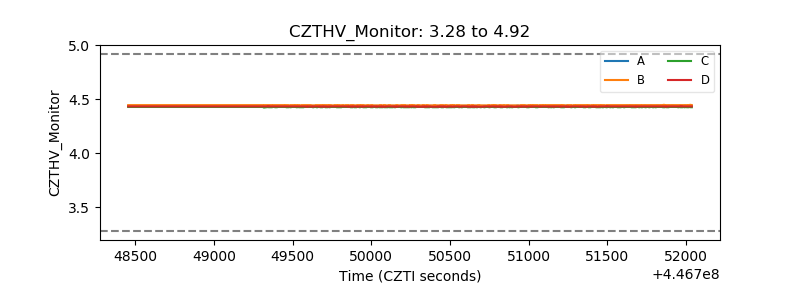 |
| D_VDD | 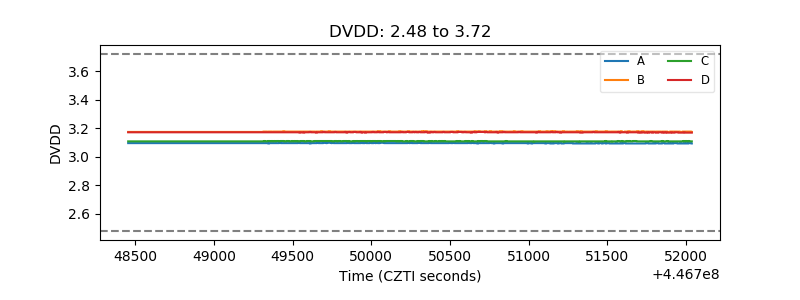 |
| Temperature 1 | 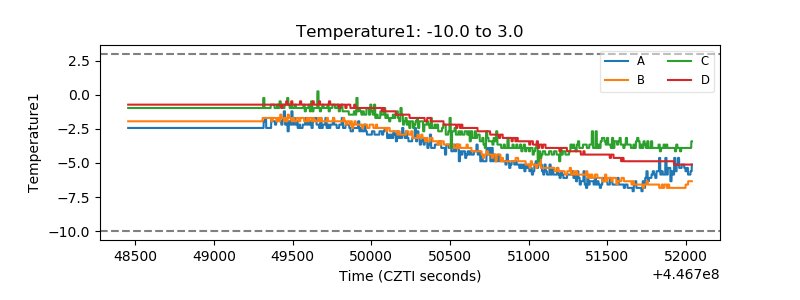 |
| Veto HV Monitor | 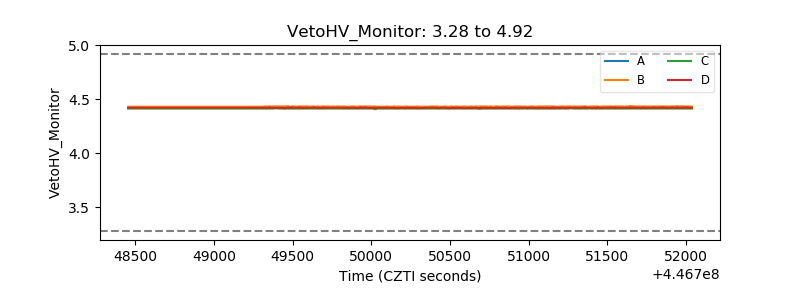 |
| Veto LLD | 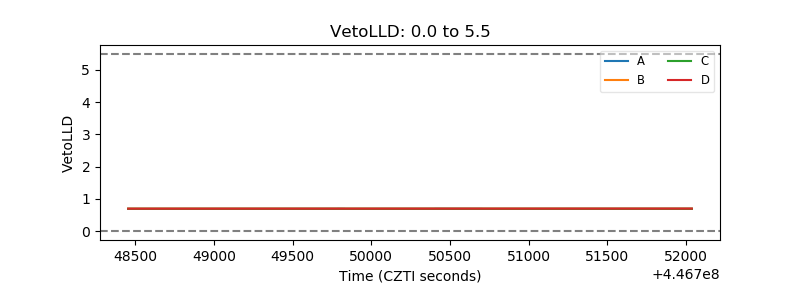 |
| Alpha Counter | 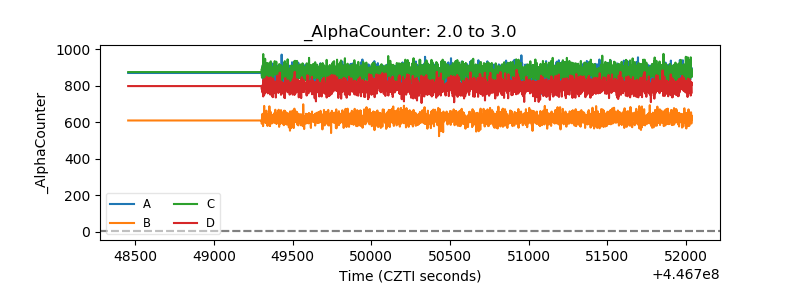 |
| _CPM_Rate | 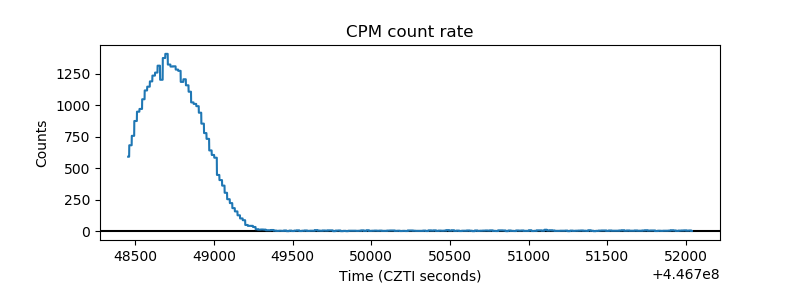 |
| CZT Counter | 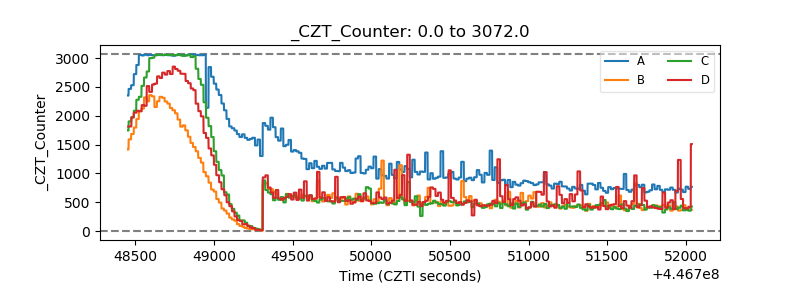 |
| +2.5 Volts monitor | 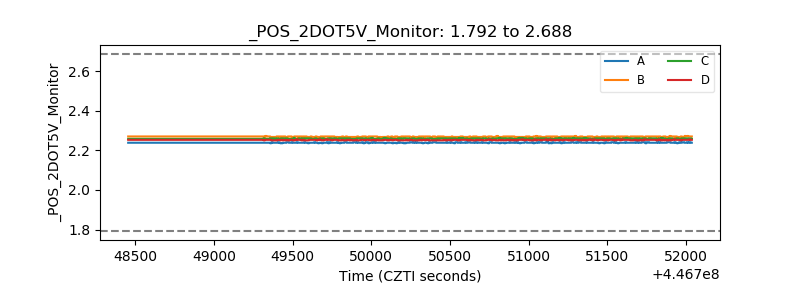 |
| +5 Volts monitor | 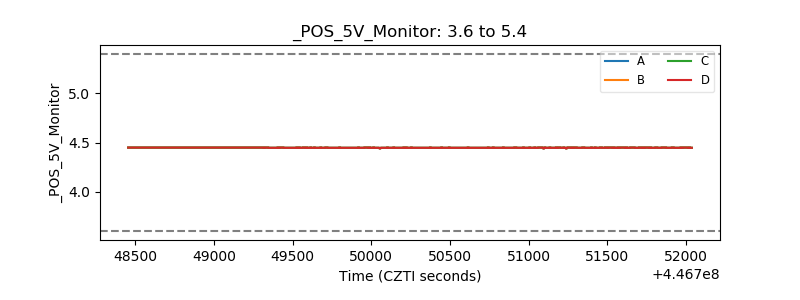 |
| _ROLL_ROT | 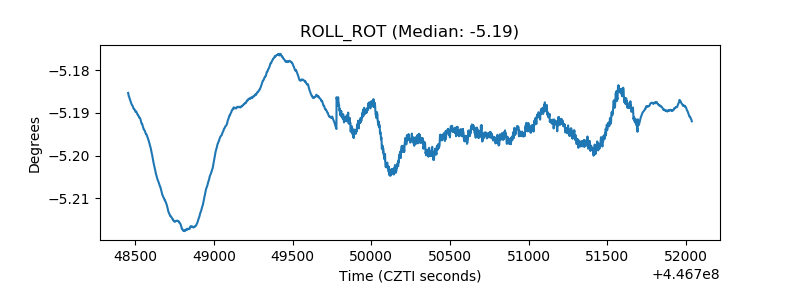 |
| _Roll_DEC | 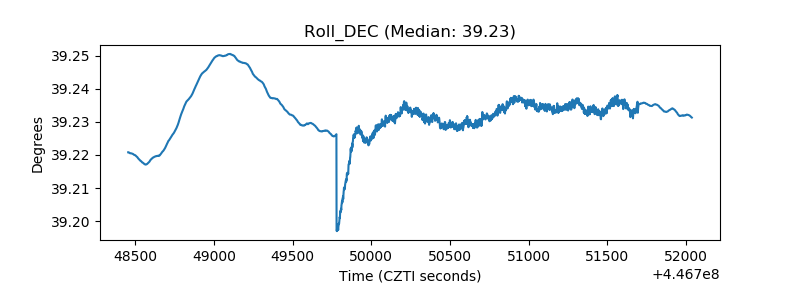 |
| _Roll_RA | 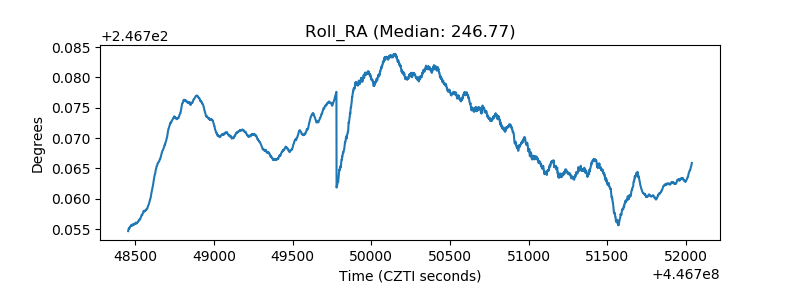 |
| Veto Counter | 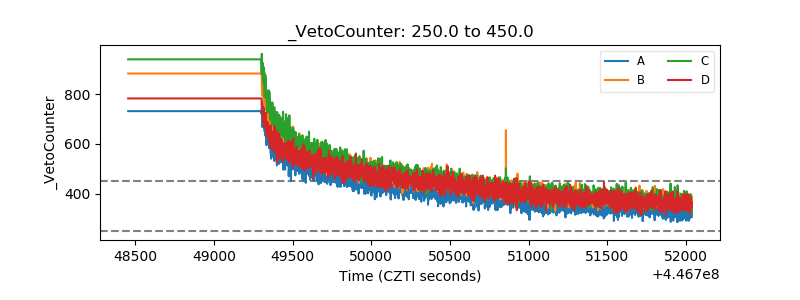 |