| Param | Original file | Final file |
|---|---|---|
| Filename | modeM0/AS1A13_071T01_9000006104_45526cztM0_level2.fits | modeM0/AS1A13_071T01_9000006104_45526cztM0_level2_quad_clean.evt |
| Size (bytes) | 72,936,000 | 17,772,480 |
| Size | 69.6 MB | 16.9 MB |
| Events in quadrant A | 864,399 | 117,425 |
| Events in quadrant B | 527,390 | 121,758 |
| Events in quadrant C | 516,622 | 114,276 |
| Events in quadrant D | 703,813 | 102,033 |
| Mode SS | |||
|---|---|---|---|
| Quadrant | BADHDUFLAG | Total packets | Discarded packets |
| A | 0 | 22 | 0 |
| B | 0 | 22 | 0 |
| C | 0 | 22 | 0 |
| D | 0 | 22 | 0 |
| Mode M0 | |||
|---|---|---|---|
| Quadrant | BADHDUFLAG | Total packets | Discarded packets |
| A | 0 | 3289 | 0 |
| B | 0 | 2264 | 0 |
| C | 0 | 2261 | 1 |
| D | 0 | 2817 | 0 |
| Quadrant | Total seconds | Saturated seconds | Saturation percentage |
|---|---|---|---|
| A | 1086 | 5 | 0.460405% |
| B | 1086 | 8 | 0.736648% |
| C | 1085 | 8 | 0.737327% |
| D | 1085 | 38 | 3.502304% |
Noise dominated data is calculated using 1-second bins in cleaned event files. If a bin has >2000 counts, and if more than 50% of those come from <1% of pixels, then it is considered to be noise-dominated and hence unusable.
| Quadrant | # 1 sec bins | Bins with >0 counts | Bins with >2000 counts | High rate bins dominated by noise | Noise dominated (total time) | Noise dominated (detector-on time) | Marked lightcurve |
|---|---|---|---|---|---|---|---|
| A | 1086 | 1086 | 0 | 0 | 0.00% | 0.00% | 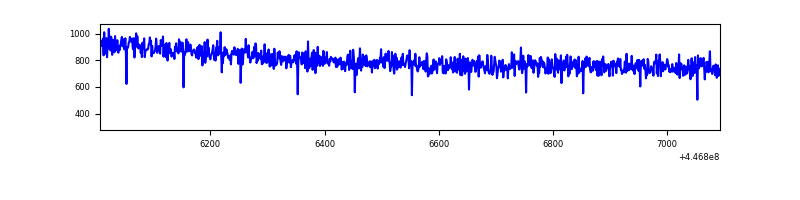 |
| B | 1086 | 1086 | 4 | 4 | 0.37% | 0.37% | 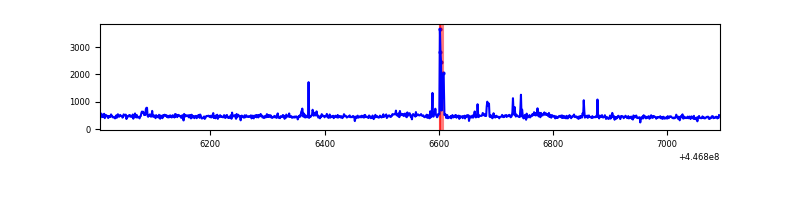 |
| C | 1085 | 1085 | 4 | 4 | 0.37% | 0.37% | 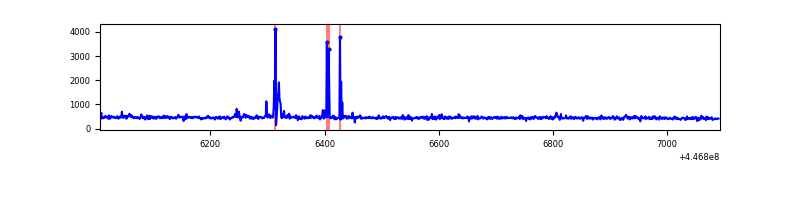 |
| D | 1085 | 1085 | 24 | 24 | 2.21% | 2.21% | 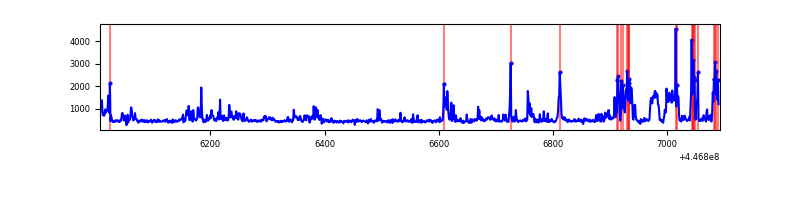 |
Top three noisy pixels from each quadrant. If the there are fewer than three noisy pixels in the level2.evt file, extra rows are filled as -1
| Pixel properties | Quadrant properties | ||||||
|---|---|---|---|---|---|---|---|
| Quadrant | DetID | PixID | Counts | Sigma | Mean | Median | Sigma |
| A | 10 | 83 | 388544 | 14201.37 | 122 | 120 | 27.4 |
| A | 7 | 3 | 1454 | 48.77 | 122 | 120 | 27.4 |
| A | 3 | 137 | 1432 | 47.97 | 122 | 120 | 27.4 |
| B | 5 | 172 | 25992 | 993.46 | 121 | 117 | 26.0 |
| B | 15 | 201 | 11767 | 447.3 | 121 | 117 | 26.0 |
| B | 0 | 155 | 8515 | 322.44 | 121 | 117 | 26.0 |
| C | 14 | 254 | 33190 | 1076.49 | 123 | 123 | 30.7 |
| C | 12 | 249 | 1336 | 39.49 | 123 | 123 | 30.7 |
| C | 12 | 2 | 887 | 24.87 | 123 | 123 | 30.7 |
| D | 13 | 249 | 153299 | 4780.93 | 121 | 117 | 32.0 |
| D | 5 | 222 | 52185 | 1625.08 | 121 | 117 | 32.0 |
| D | 1 | 52 | 15334 | 474.93 | 121 | 117 | 32.0 |
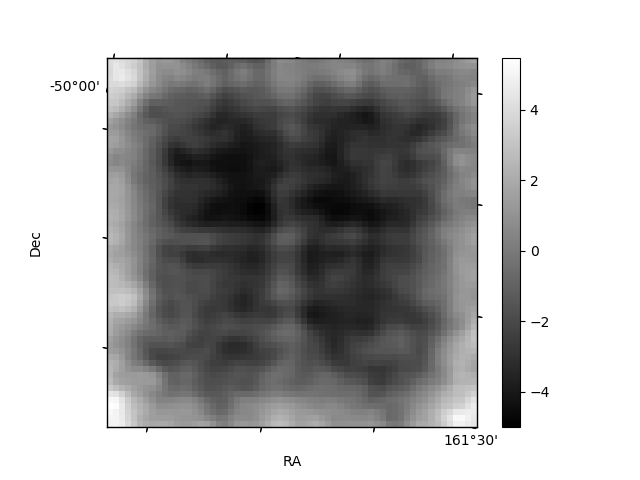
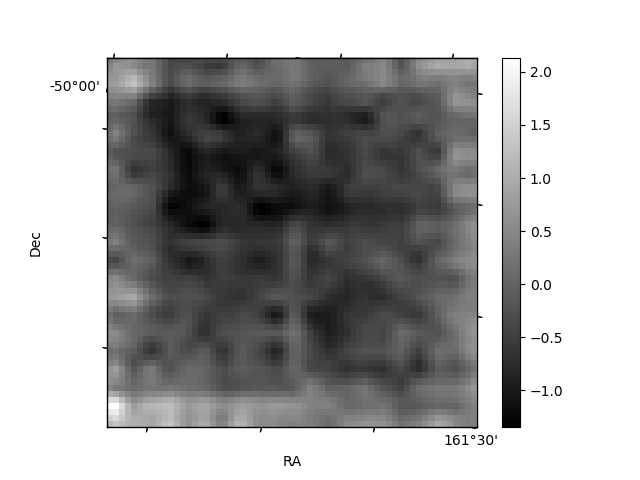
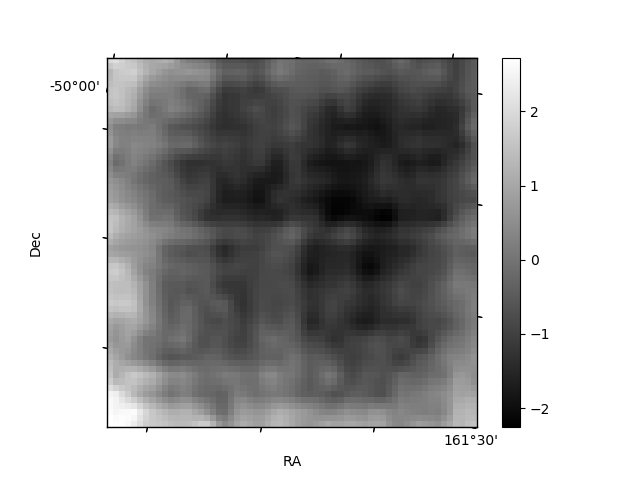
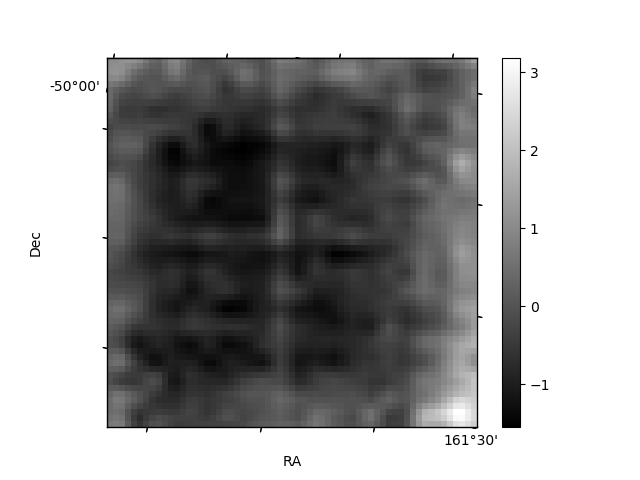
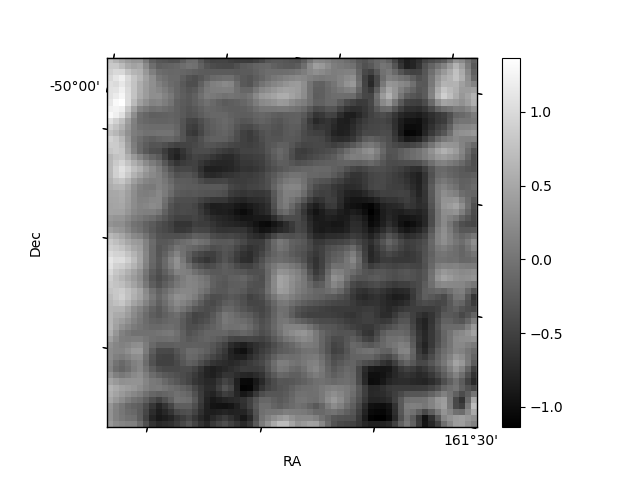
Histogram calculated using DETX and DETY for each event in the final _common_clean file
| Quadrant A | 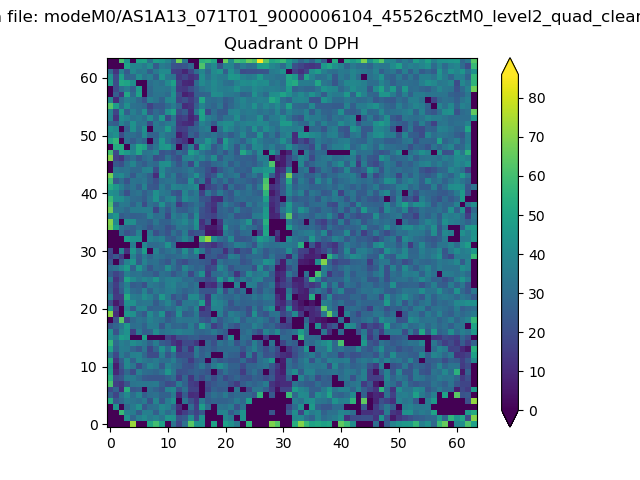 |
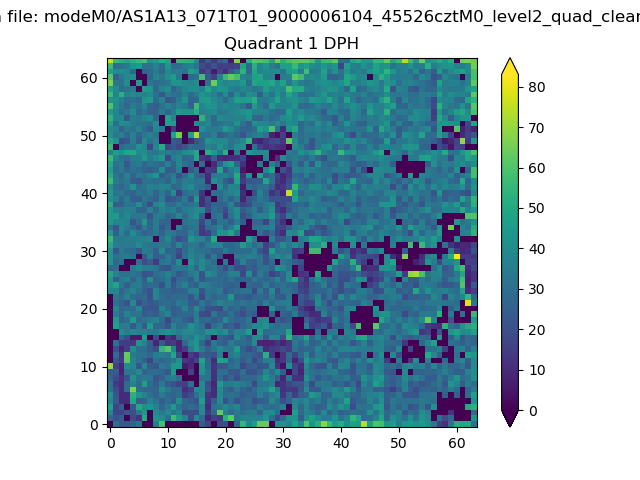 |
Quadrant B |
|---|---|---|---|
| Quadrant D | 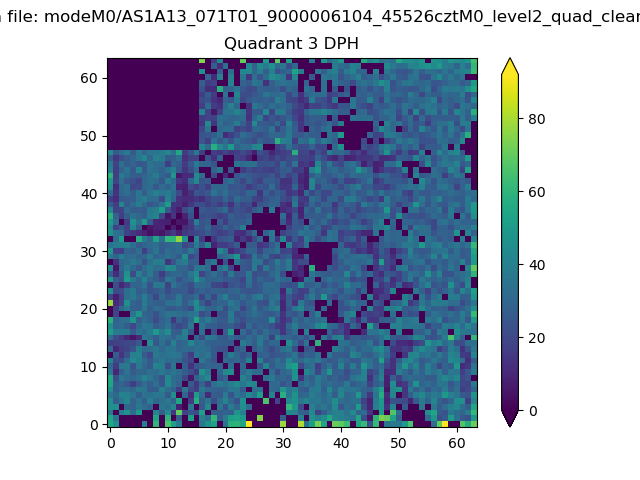 |
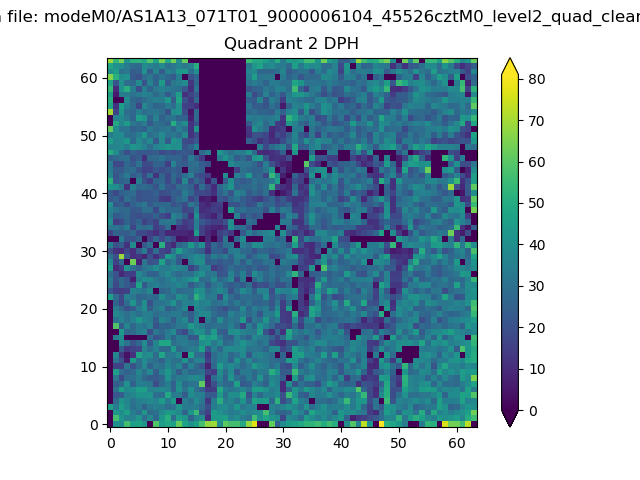 |
Quadrant C |
| Plot type | Count rate plots | Images |
|---|---|---|
| Comparison with Poisson distribution Blue bars denote a histogram of data divided into 1 sec bins. Red curve is a Poisson curve with rate = median count rate of data. |
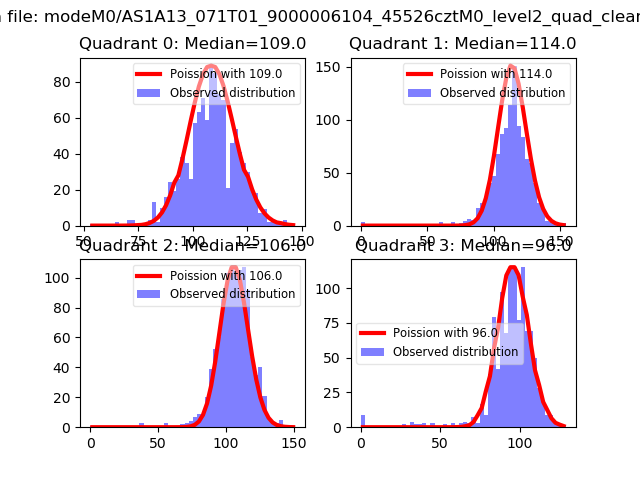 |
 |
| Quadrant-wise count rates Data is divided into 100 sec bins |
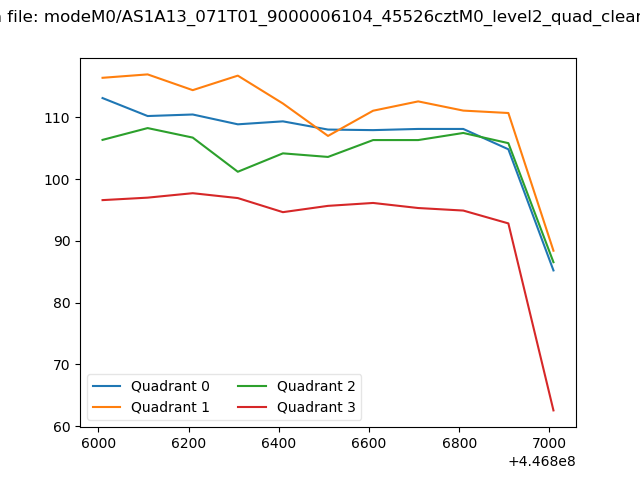 |
|
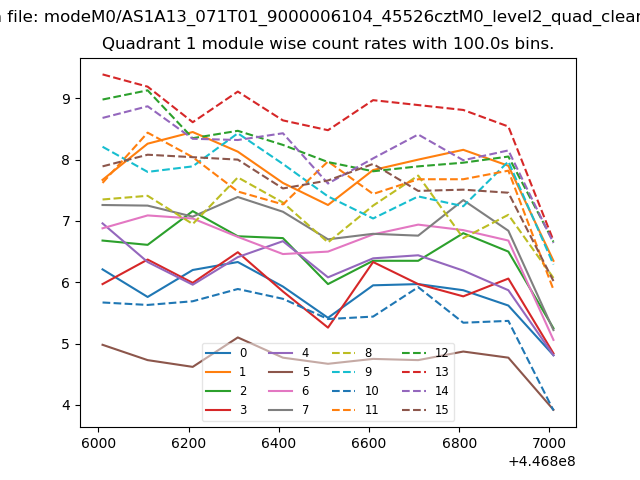
| Module-wise count rates for Quadrant A Data is divided into 100 sec bins |
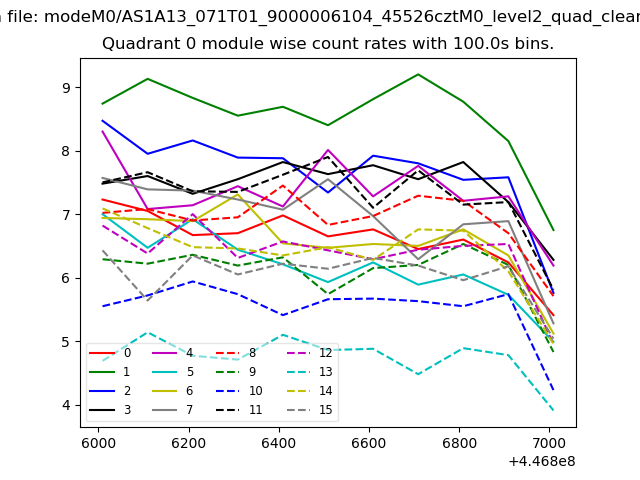 |
 |
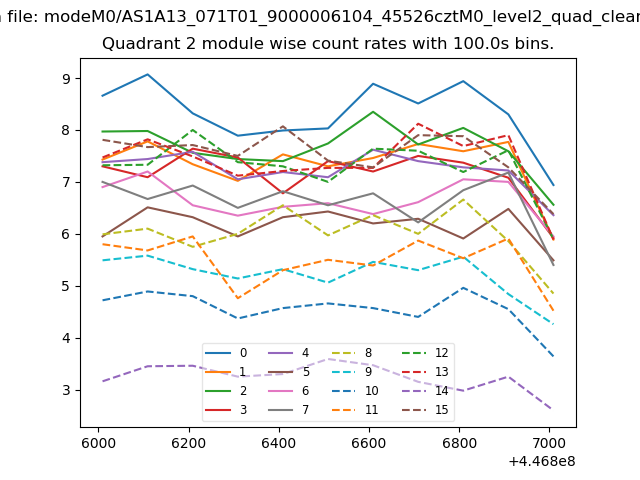
| Module-wise count rates for Quadrant B Data is divided into 100 sec bins |
 |
 |
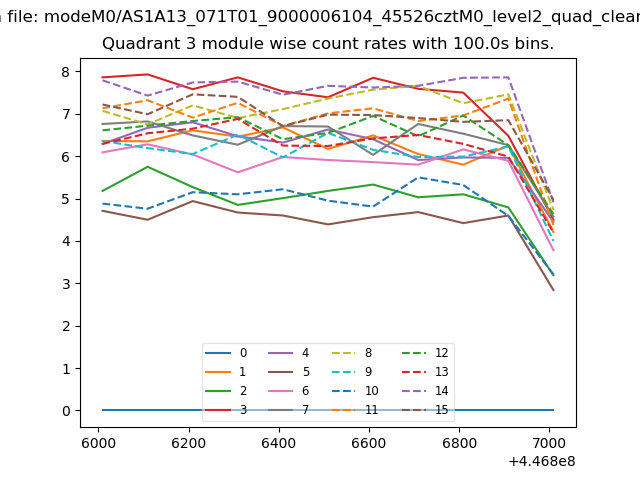
| Module-wise count rates for Quadrant C Data is divided into 100 sec bins |
 |
 |
| Module-wise count rates for Quadrant D Data is divided into 100 sec bins |
 |
 |
| Parameter | Plot |
|---|---|
| CZT HV Monitor | 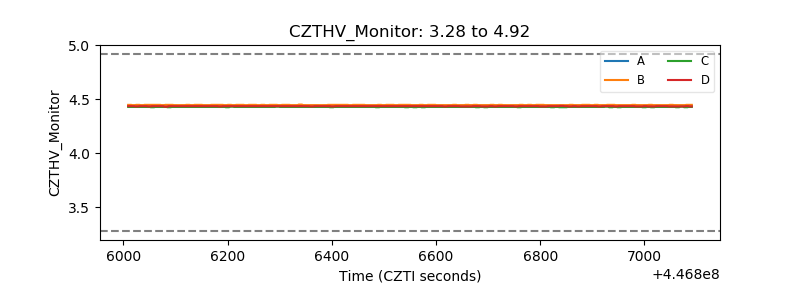 |
| D_VDD | 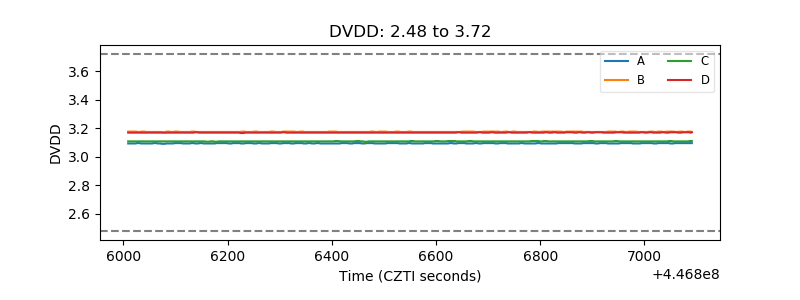 |
| Temperature 1 | 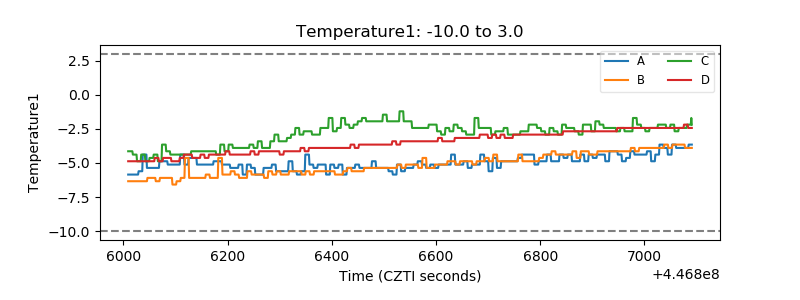 |
| Veto HV Monitor | 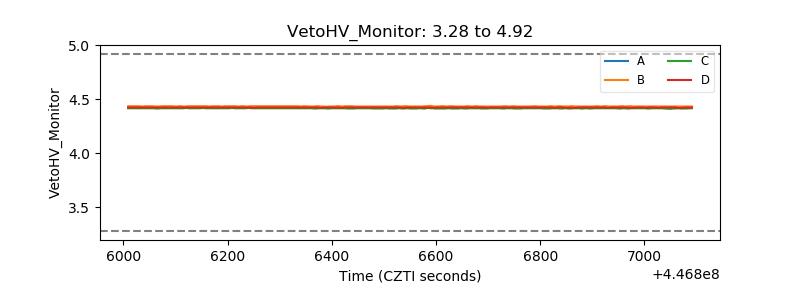 |
| Veto LLD | 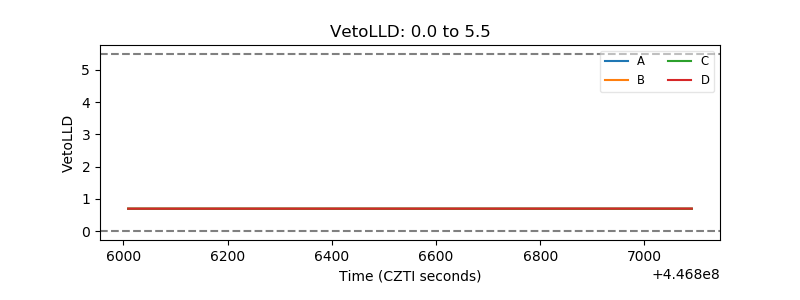 |
| Alpha Counter | 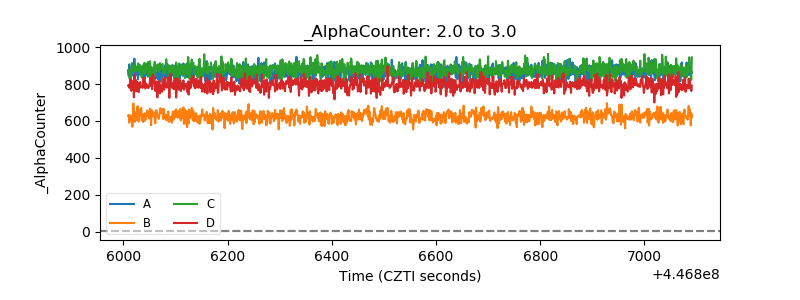 |
| _CPM_Rate | 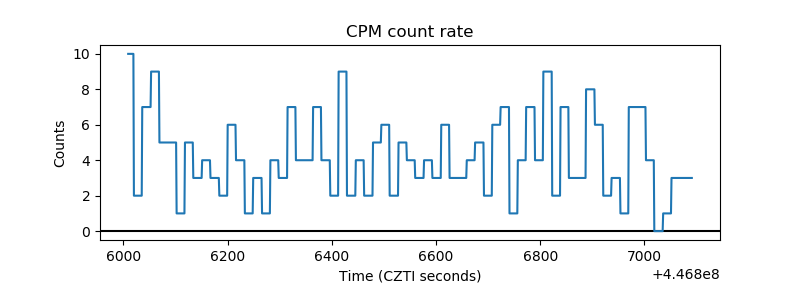 |
| CZT Counter | 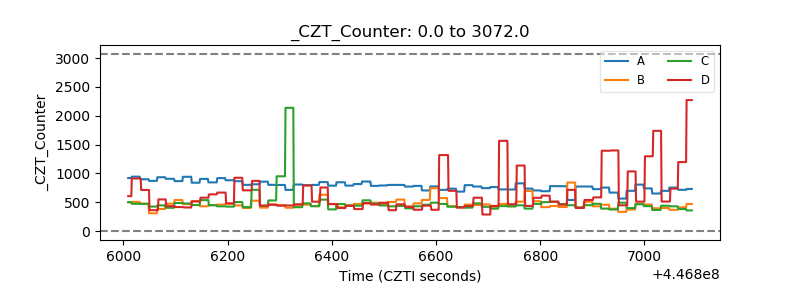 |
| +2.5 Volts monitor | 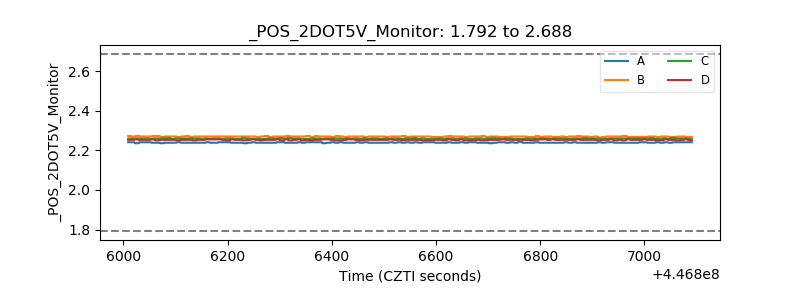 |
| +5 Volts monitor | 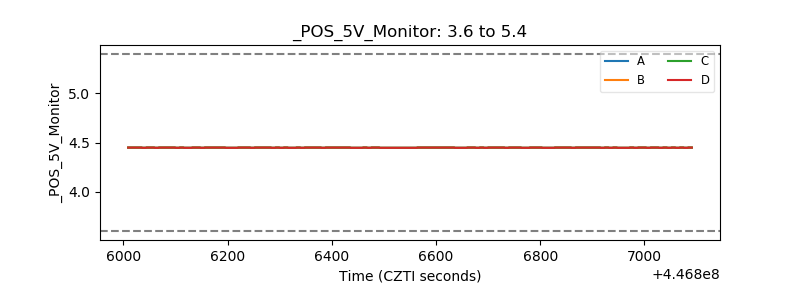 |
| _ROLL_ROT | 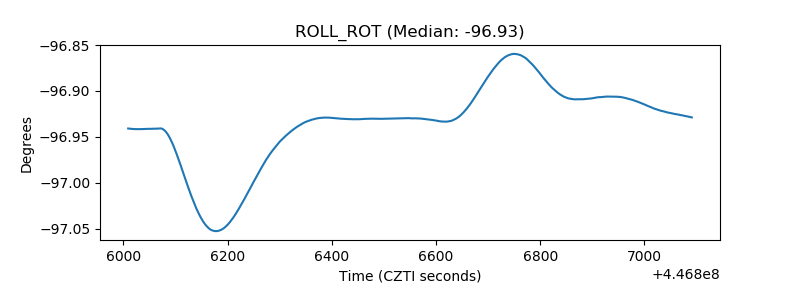 |
| _Roll_DEC | 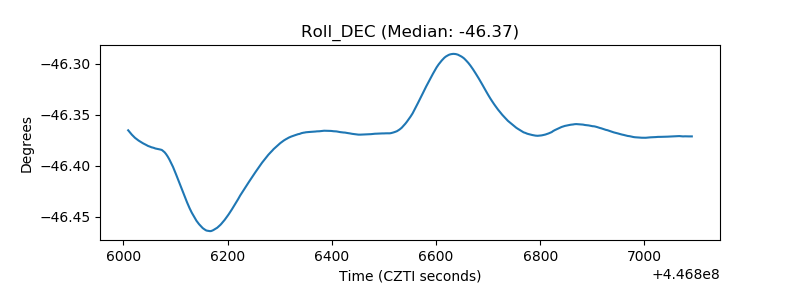 |
| _Roll_RA | 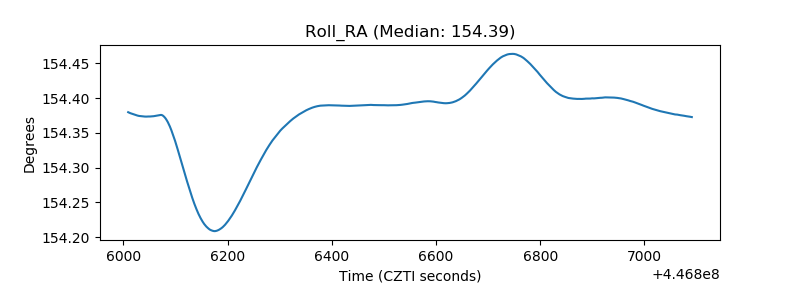 |
| Veto Counter | 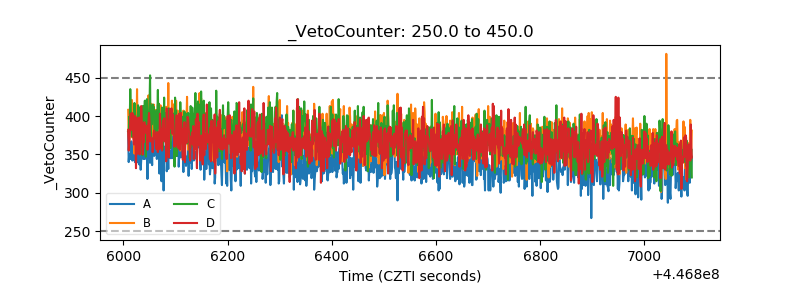 |