| Param | Original file | Final file |
|---|---|---|
| Filename | modeM0/AS1A13_071T01_9000006104_45527cztM0_level2.fits | modeM0/AS1A13_071T01_9000006104_45527cztM0_level2_quad_clean.evt |
| Size (bytes) | 432,282,240 | 103,996,800 |
| Size | 412.3 MB | 99.2 MB |
| Events in quadrant A | 5,318,972 | 682,690 |
| Events in quadrant B | 3,162,981 | 708,880 |
| Events in quadrant C | 3,079,645 | 683,604 |
| Events in quadrant D | 3,929,973 | 615,926 |
| Mode SS | |||
|---|---|---|---|
| Quadrant | BADHDUFLAG | Total packets | Discarded packets |
| A | 0 | 134 | 0 |
| B | 0 | 134 | 0 |
| C | 0 | 134 | 0 |
| D | 0 | 134 | 0 |
| Mode M9 | |||
|---|---|---|---|
| Quadrant | BADHDUFLAG | Total packets | Discarded packets |
| A | 0 | 8 | 0 |
| B | 0 | 8 | 0 |
| C | 0 | 8 | 0 |
| D | 0 | 8 | 0 |
| Mode M0 | |||
|---|---|---|---|
| Quadrant | BADHDUFLAG | Total packets | Discarded packets |
| A | 0 | 20599 | 1 |
| B | 0 | 14060 | 1 |
| C | 0 | 14020 | 1 |
| D | 0 | 16206 | 1 |
| Quadrant | Total seconds | Saturated seconds | Saturation percentage |
|---|---|---|---|
| A | 6563 | 164 | 2.498857% |
| B | 6563 | 155 | 2.361725% |
| C | 6562 | 122 | 1.859189% |
| D | 6562 | 218 | 3.322158% |
Noise dominated data is calculated using 1-second bins in cleaned event files. If a bin has >2000 counts, and if more than 50% of those come from <1% of pixels, then it is considered to be noise-dominated and hence unusable.
| Quadrant | # 1 sec bins | Bins with >0 counts | Bins with >2000 counts | High rate bins dominated by noise | Noise dominated (total time) | Noise dominated (detector-on time) | Marked lightcurve |
|---|---|---|---|---|---|---|---|
| A | 7393 | 6564 | 3 | 3 | 0.04% | 0.05% | 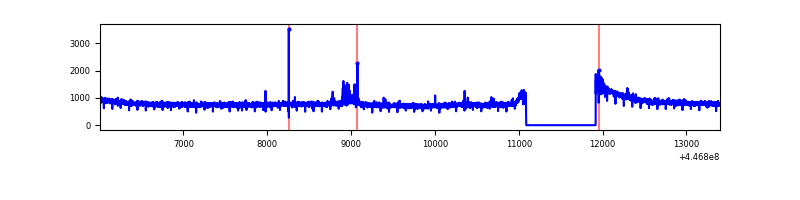 |
| B | 7393 | 6563 | 19 | 19 | 0.26% | 0.29% | 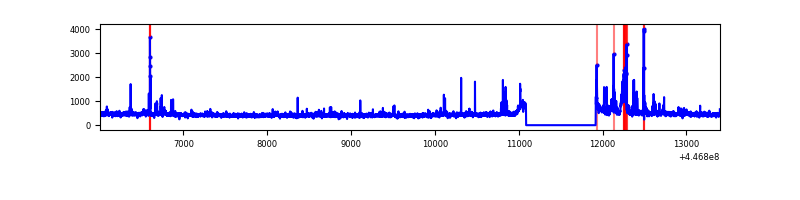 |
| C | 7391 | 6562 | 31 | 31 | 0.42% | 0.47% | 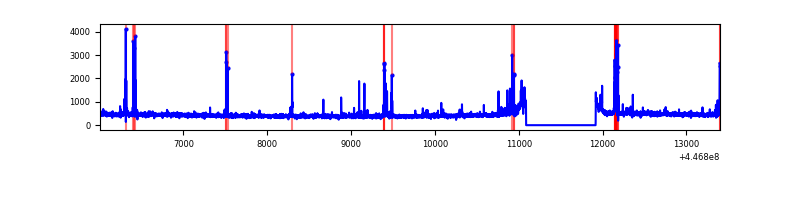 |
| D | 7392 | 6562 | 87 | 87 | 1.18% | 1.33% | 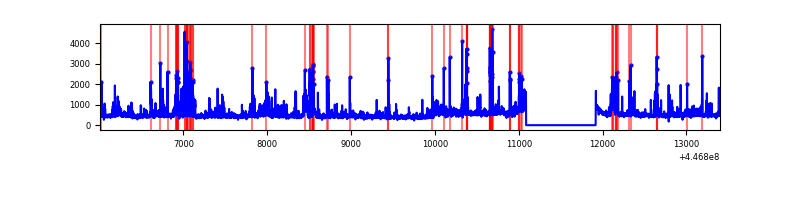 |
Top three noisy pixels from each quadrant. If the there are fewer than three noisy pixels in the level2.evt file, extra rows are filled as -1
| Pixel properties | Quadrant properties | ||||||
|---|---|---|---|---|---|---|---|
| Quadrant | DetID | PixID | Counts | Sigma | Mean | Median | Sigma |
| A | 10 | 83 | 2454381 | 16242.65 | 724 | 707 | 151.1 |
| A | 7 | 3 | 57072 | 373.12 | 724 | 707 | 151.1 |
| A | 15 | 174 | 14464 | 91.07 | 724 | 707 | 151.1 |
| B | 5 | 172 | 209384 | 1457.21 | 722 | 698 | 143.2 |
| B | 15 | 201 | 33697 | 230.42 | 722 | 698 | 143.2 |
| B | 0 | 155 | 33223 | 227.11 | 722 | 698 | 143.2 |
| C | 12 | 2 | 130851 | 765.6 | 719 | 722 | 170.0 |
| C | 14 | 254 | 103200 | 602.92 | 719 | 722 | 170.0 |
| C | 2 | 14 | 28705 | 164.64 | 719 | 722 | 170.0 |
| D | 13 | 249 | 495034 | 2787.3 | 710 | 686 | 177.4 |
| D | 5 | 222 | 351371 | 1977.28 | 710 | 686 | 177.4 |
| D | 1 | 52 | 117973 | 661.3 | 710 | 686 | 177.4 |
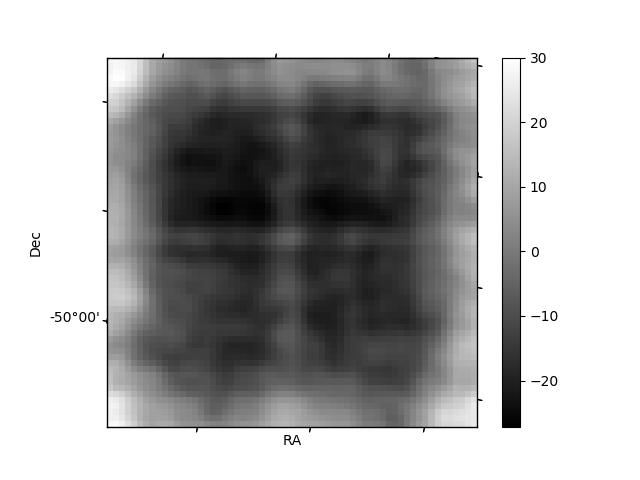
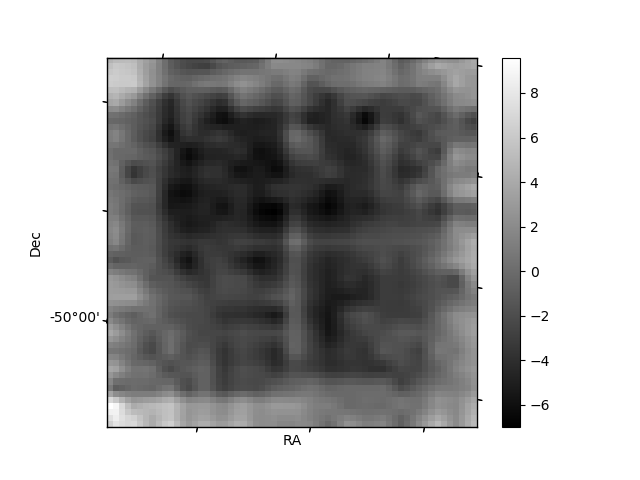
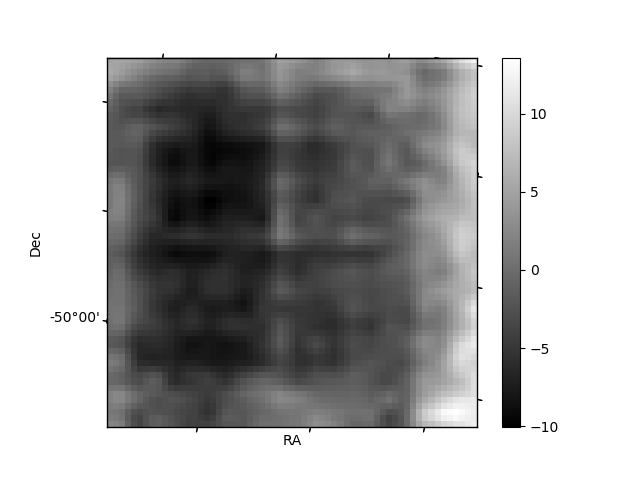
Histogram calculated using DETX and DETY for each event in the final _common_clean file
| Quadrant A | 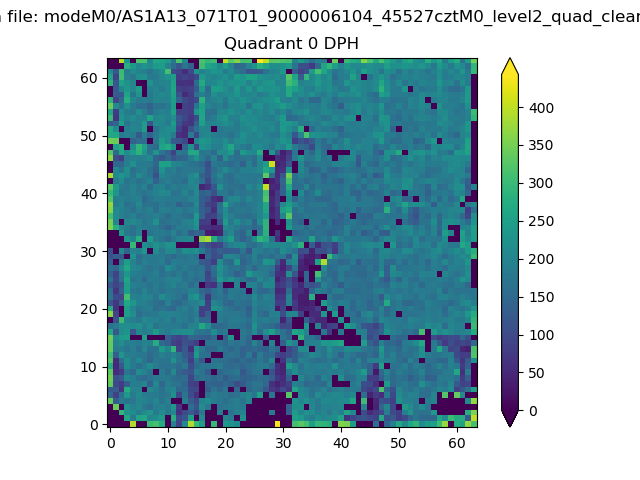 |
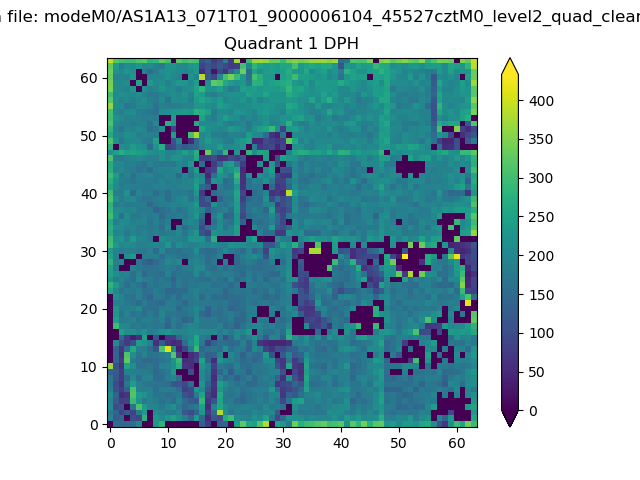 |
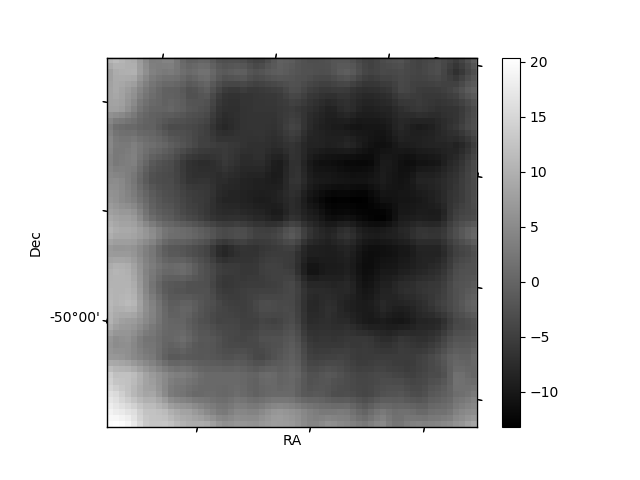
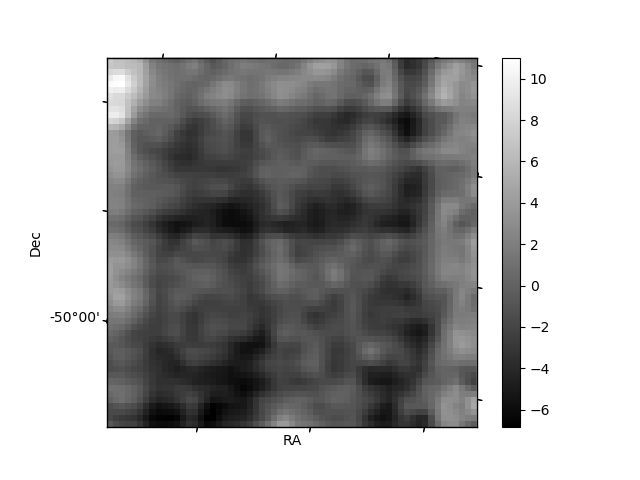
Quadrant B |
|---|---|---|---|
| Quadrant D | 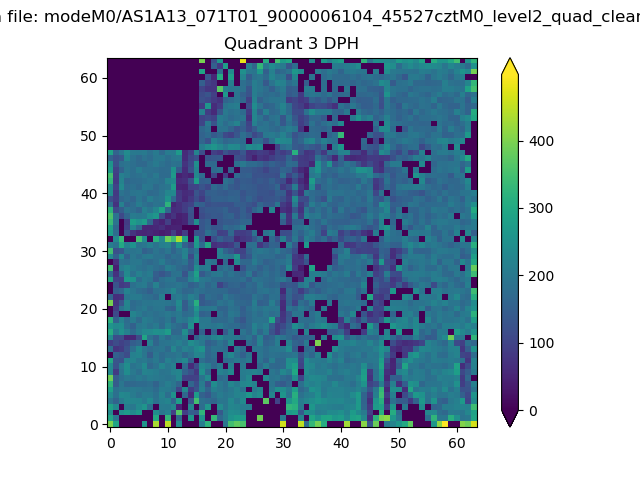 |
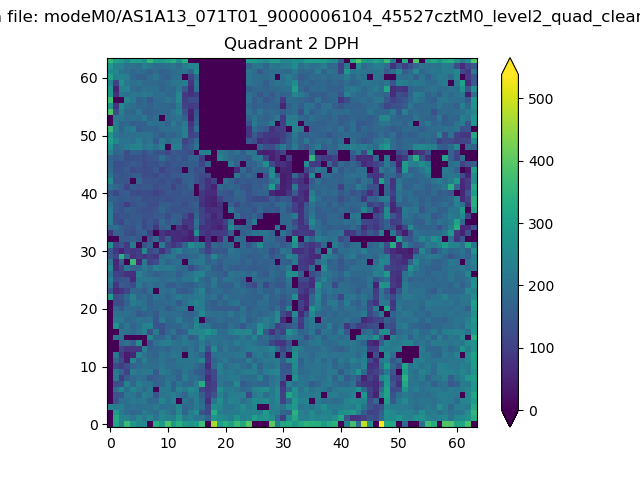 |
Quadrant C |
| Plot type | Count rate plots | Images |
|---|---|---|
| Comparison with Poisson distribution Blue bars denote a histogram of data divided into 1 sec bins. Red curve is a Poisson curve with rate = median count rate of data. |
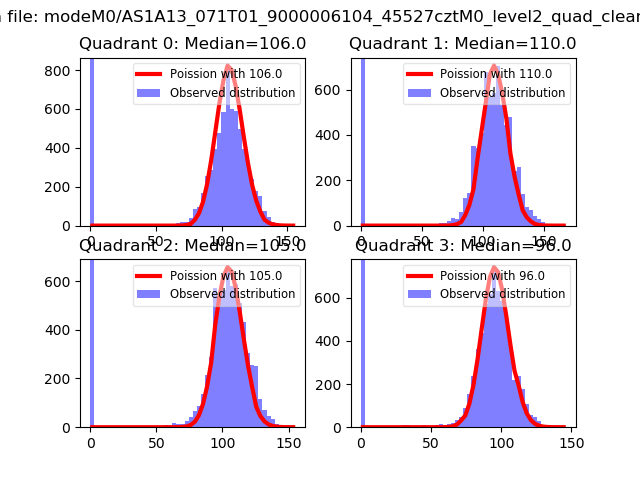 |
 |
| Quadrant-wise count rates Data is divided into 100 sec bins |
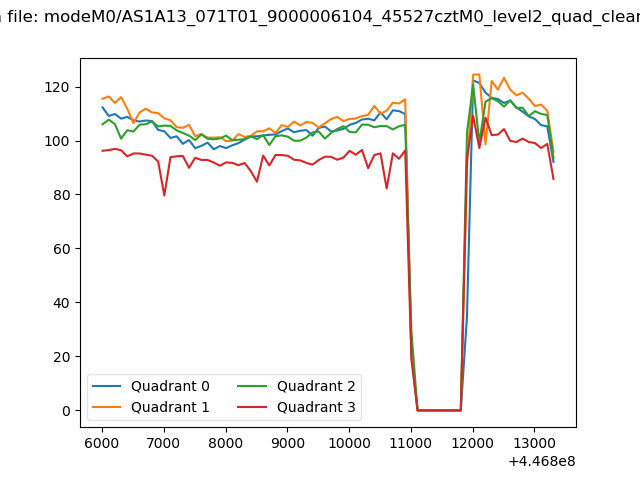 |
|
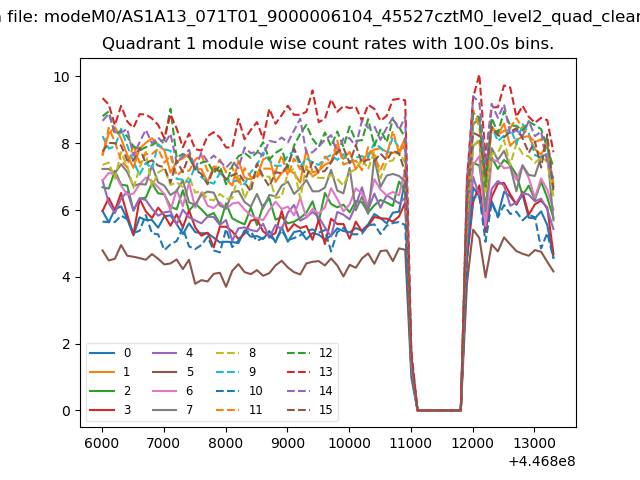
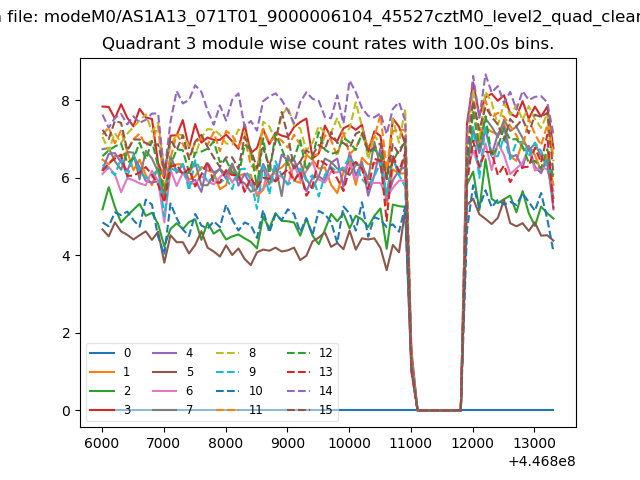
| Module-wise count rates for Quadrant A Data is divided into 100 sec bins |
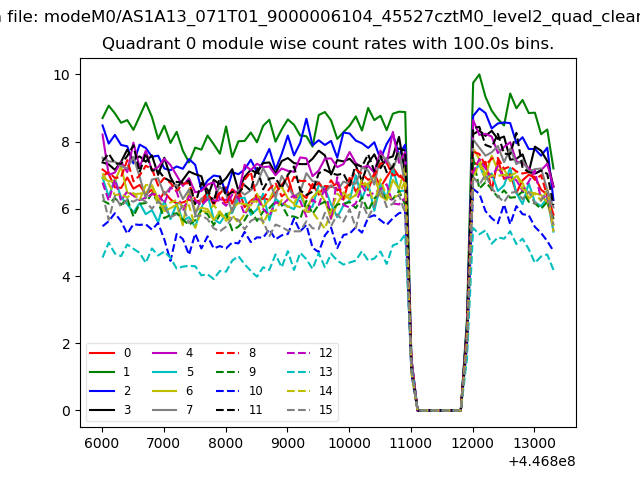 |
 |
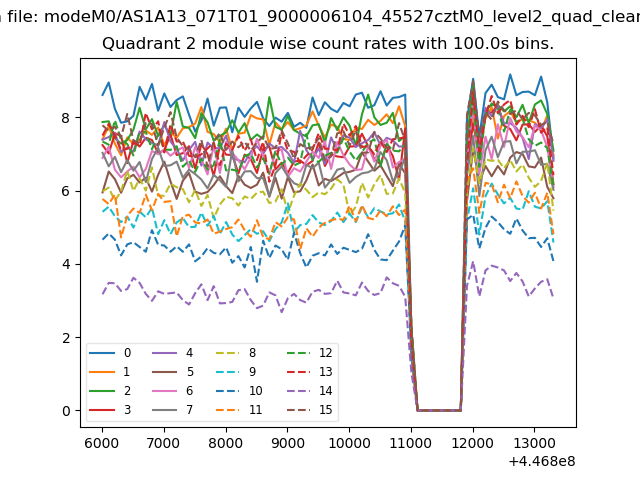
| Module-wise count rates for Quadrant B Data is divided into 100 sec bins |
 |
 |
| Module-wise count rates for Quadrant C Data is divided into 100 sec bins |
 |
 |
| Module-wise count rates for Quadrant D Data is divided into 100 sec bins |
 |
 |
| Parameter | Plot |
|---|---|
| CZT HV Monitor |  |
| D_VDD |  |
| Temperature 1 | 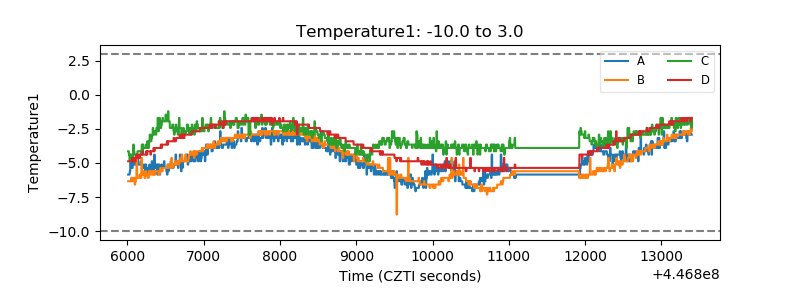 |
| Veto HV Monitor | 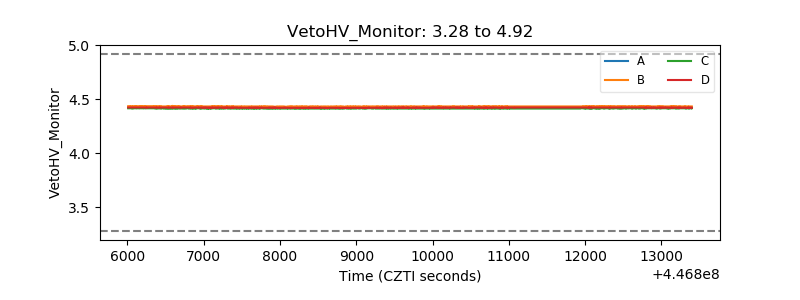 |
| Veto LLD | 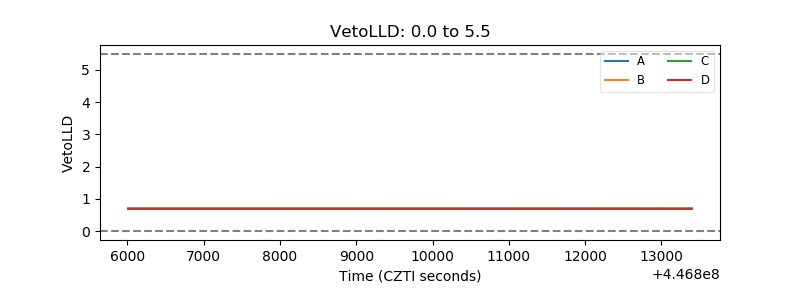 |
| Alpha Counter | 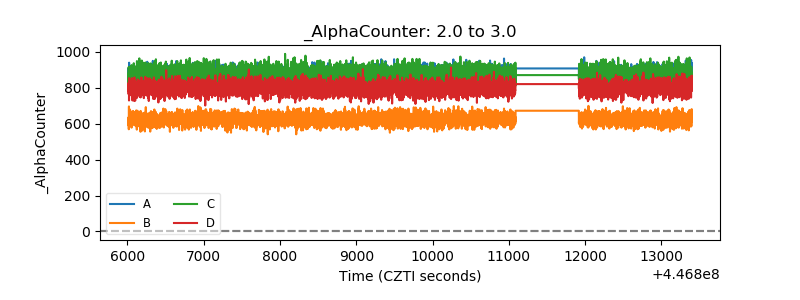 |
| _CPM_Rate | 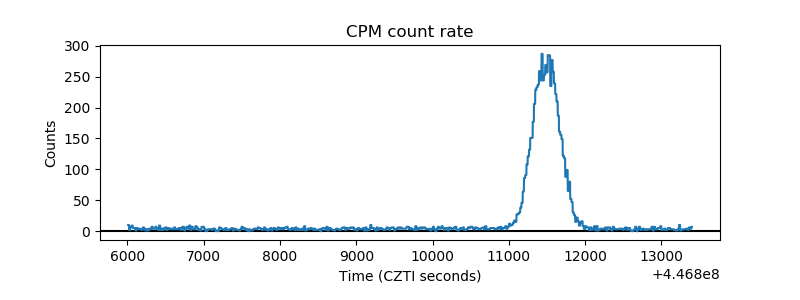 |
| CZT Counter | 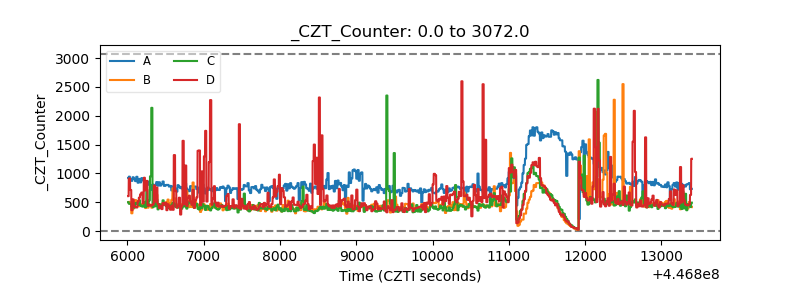 |
| +2.5 Volts monitor | 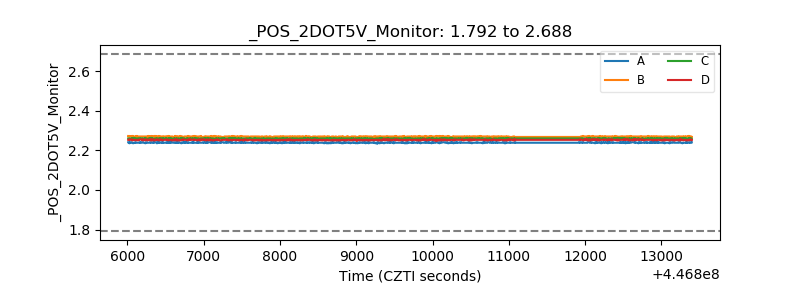 |
| +5 Volts monitor | 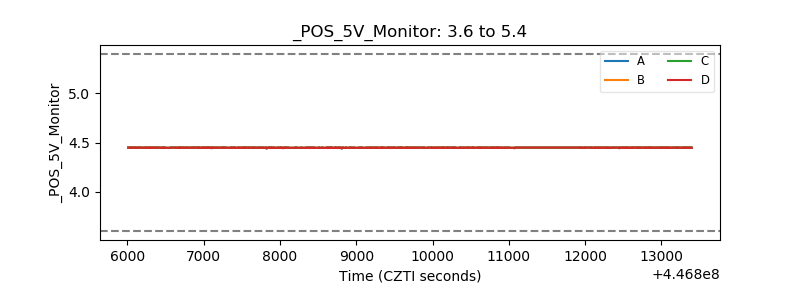 |
| _ROLL_ROT | 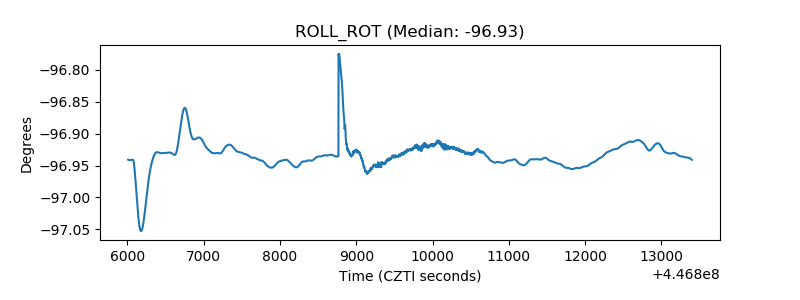 |
| _Roll_DEC | 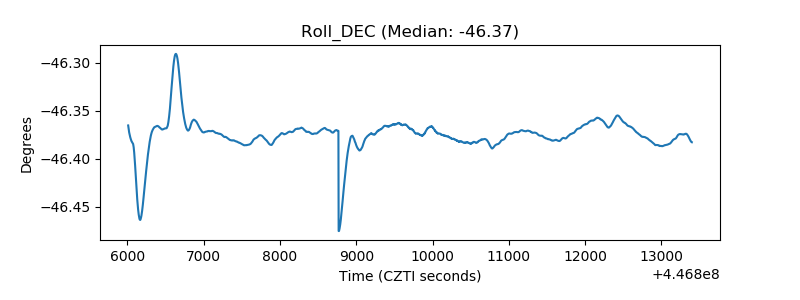 |
| _Roll_RA | 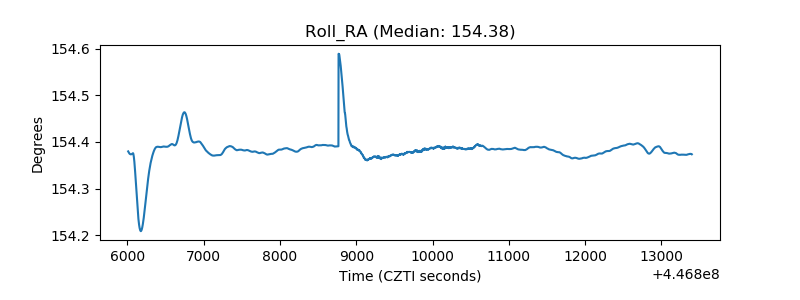 |
| Veto Counter |  |