| Param | Original file | Final file |
|---|---|---|
| Filename | modeM0/AS1A13_071T01_9000006104_45530cztM0_level2.fits | modeM0/AS1A13_071T01_9000006104_45530cztM0_level2_quad_clean.evt |
| Size (bytes) | 532,440,000 | 113,034,240 |
| Size | 507.8 MB | 107.8 MB |
| Events in quadrant A | 6,256,037 | 766,245 |
| Events in quadrant B | 4,572,446 | 751,531 |
| Events in quadrant C | 3,672,196 | 755,492 |
| Events in quadrant D | 4,679,513 | 673,944 |
| Mode SS | |||
|---|---|---|---|
| Quadrant | BADHDUFLAG | Total packets | Discarded packets |
| A | 0 | 140 | 0 |
| B | 0 | 140 | 0 |
| C | 0 | 140 | 0 |
| D | 0 | 140 | 0 |
| Mode M9 | |||
|---|---|---|---|
| Quadrant | BADHDUFLAG | Total packets | Discarded packets |
| A | 0 | 11 | 0 |
| B | 0 | 11 | 0 |
| C | 0 | 11 | 0 |
| D | 0 | 11 | 0 |
| Mode M0 | |||
|---|---|---|---|
| Quadrant | BADHDUFLAG | Total packets | Discarded packets |
| A | 0 | 23396 | 2 |
| B | 0 | 18342 | 2 |
| C | 0 | 15845 | 2 |
| D | 0 | 18682 | 2 |
| Quadrant | Total seconds | Saturated seconds | Saturation percentage |
|---|---|---|---|
| A | 6818 | 305 | 4.473453% |
| B | 6818 | 639 | 9.372250% |
| C | 6819 | 246 | 3.607567% |
| D | 6819 | 349 | 5.118053% |
Noise dominated data is calculated using 1-second bins in cleaned event files. If a bin has >2000 counts, and if more than 50% of those come from <1% of pixels, then it is considered to be noise-dominated and hence unusable.
| Quadrant | # 1 sec bins | Bins with >0 counts | Bins with >2000 counts | High rate bins dominated by noise | Noise dominated (total time) | Noise dominated (detector-on time) | Marked lightcurve |
|---|---|---|---|---|---|---|---|
| A | 7918 | 6819 | 61 | 61 | 0.77% | 0.89% | 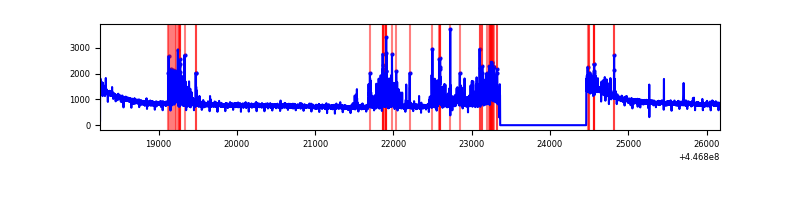 |
| B | 7918 | 6819 | 394 | 394 | 4.98% | 5.78% | 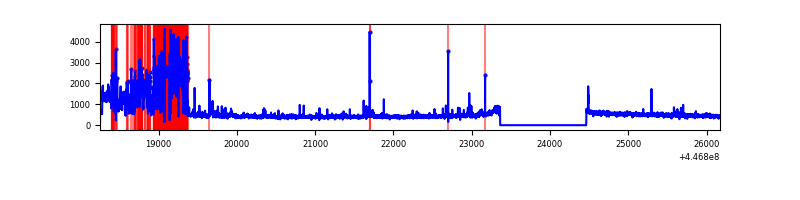 |
| C | 7919 | 6819 | 147 | 147 | 1.86% | 2.16% | 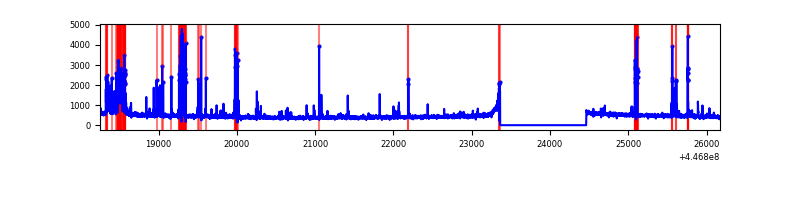 |
| D | 7919 | 6819 | 194 | 194 | 2.45% | 2.84% | 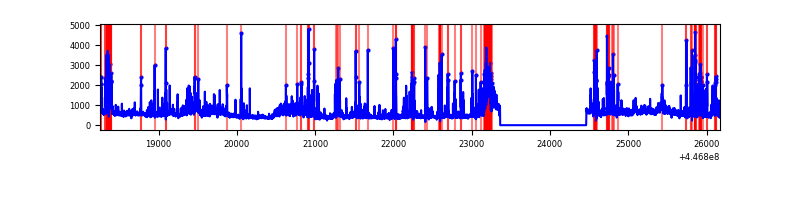 |
Top three noisy pixels from each quadrant. If the there are fewer than three noisy pixels in the level2.evt file, extra rows are filled as -1
| Pixel properties | Quadrant properties | ||||||
|---|---|---|---|---|---|---|---|
| Quadrant | DetID | PixID | Counts | Sigma | Mean | Median | Sigma |
| A | 10 | 83 | 2676908 | 16583.74 | 781 | 766 | 161.4 |
| A | 13 | 248 | 558415 | 3455.69 | 781 | 766 | 161.4 |
| A | 3 | 137 | 8745 | 49.44 | 781 | 766 | 161.4 |
| B | 15 | 201 | 1485284 | 10163.6 | 751 | 728 | 146.1 |
| B | 0 | 155 | 49593 | 334.54 | 751 | 728 | 146.1 |
| B | 5 | 172 | 38118 | 255.98 | 751 | 728 | 146.1 |
| C | 12 | 2 | 378847 | 2126.82 | 759 | 763 | 177.8 |
| C | 14 | 254 | 320747 | 1799.99 | 759 | 763 | 177.8 |
| C | 12 | 249 | 7282 | 36.67 | 759 | 763 | 177.8 |
| D | 13 | 249 | 889679 | 4709.03 | 754 | 733 | 188.8 |
| D | 5 | 171 | 317319 | 1677.06 | 754 | 733 | 188.8 |
| D | 1 | 52 | 272635 | 1440.35 | 754 | 733 | 188.8 |
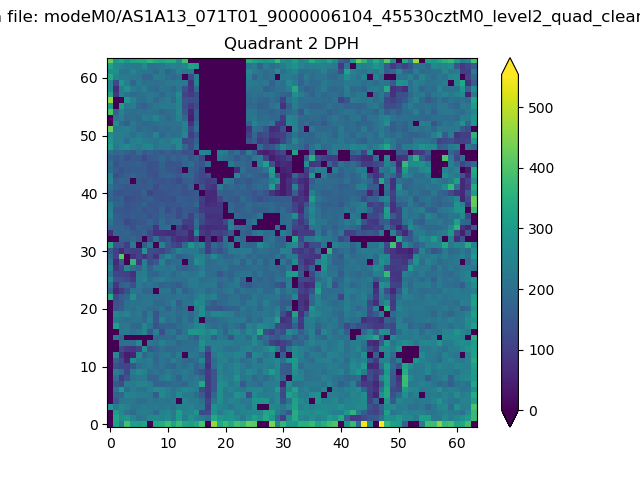
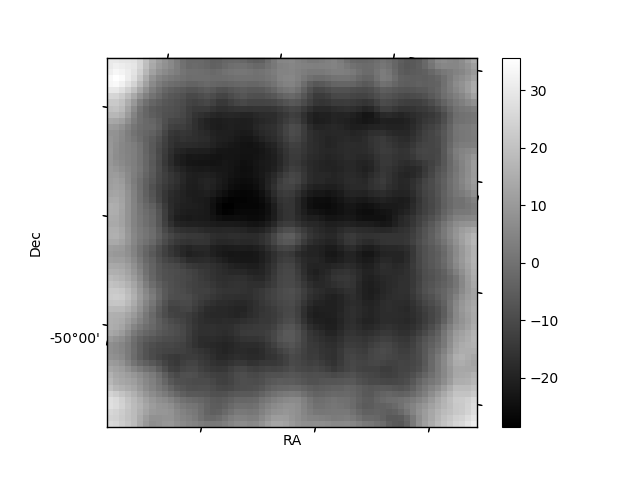
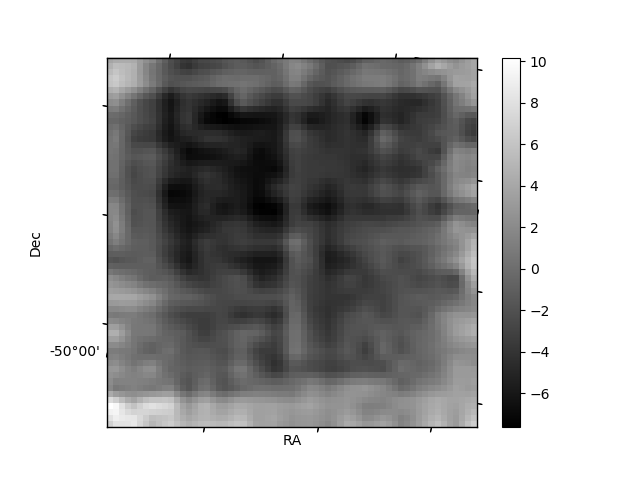
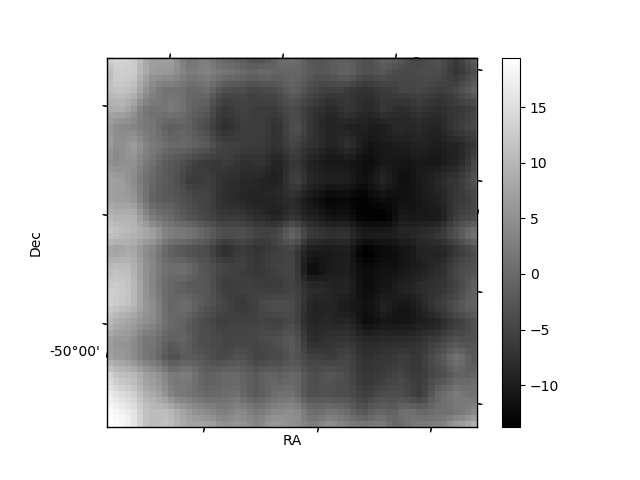
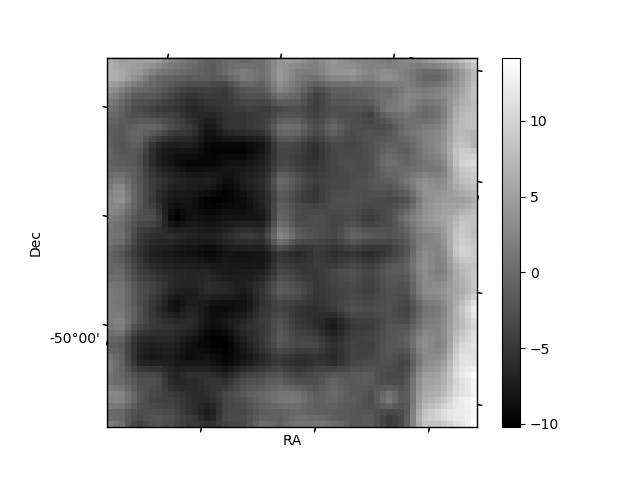
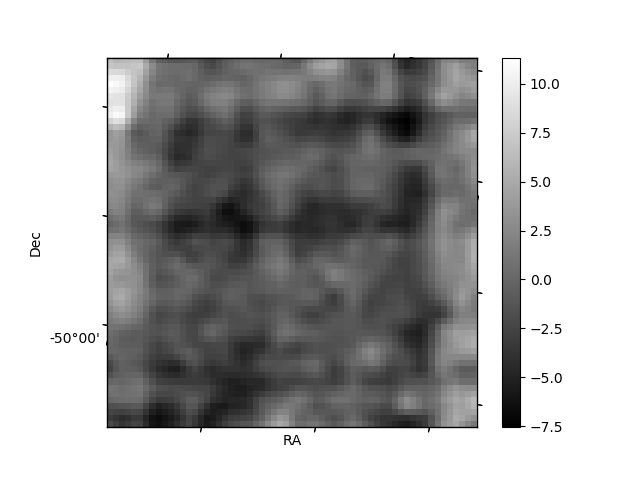
Histogram calculated using DETX and DETY for each event in the final _common_clean file
| Quadrant A | 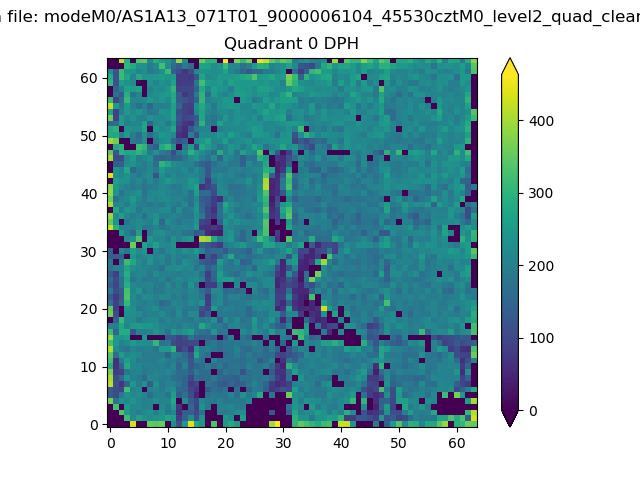 |
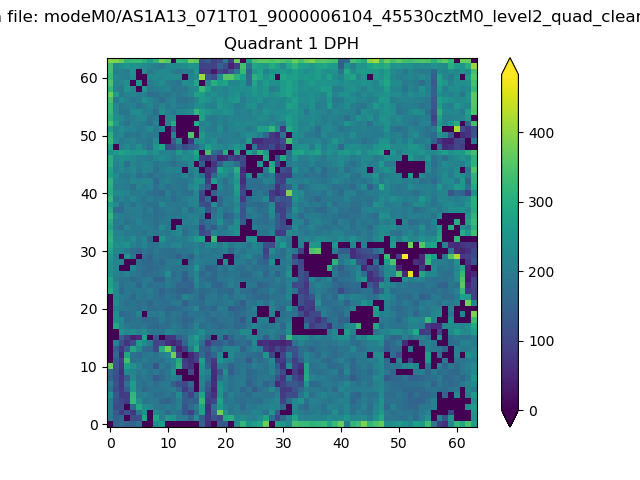 |
Quadrant B |
|---|---|---|---|
| Quadrant D | 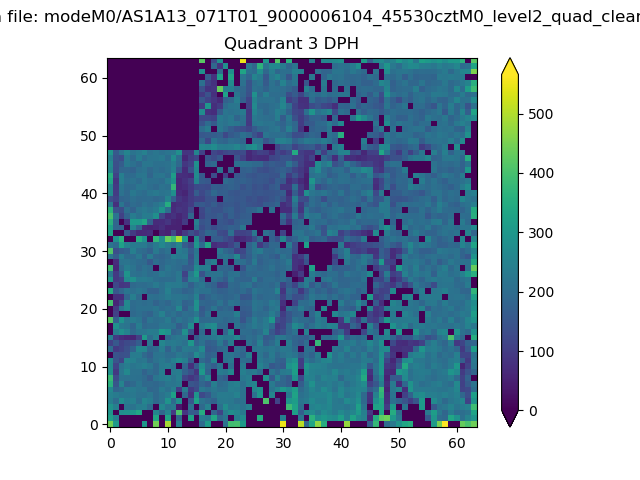 |
 |
Quadrant C |
| Plot type | Count rate plots | Images |
|---|---|---|
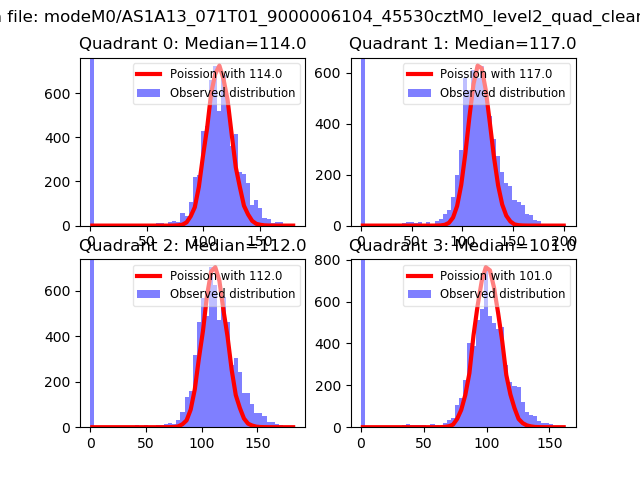
| Comparison with Poisson distribution Blue bars denote a histogram of data divided into 1 sec bins. Red curve is a Poisson curve with rate = median count rate of data. |
 |
 |
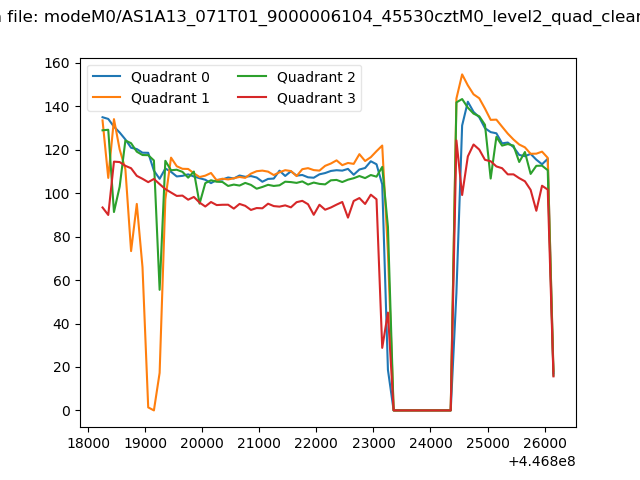
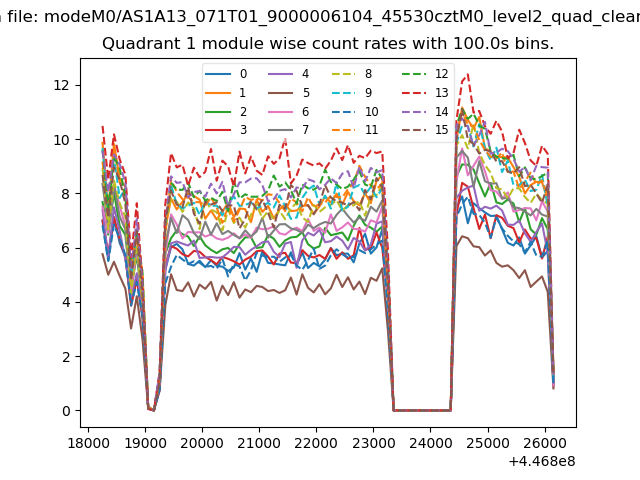
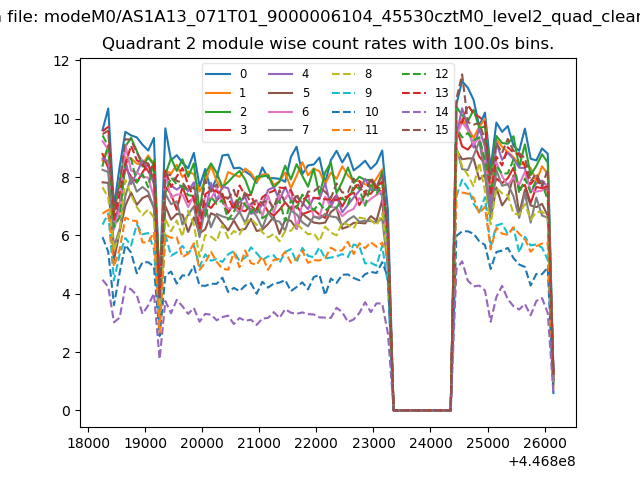
| Quadrant-wise count rates Data is divided into 100 sec bins |
 |
|
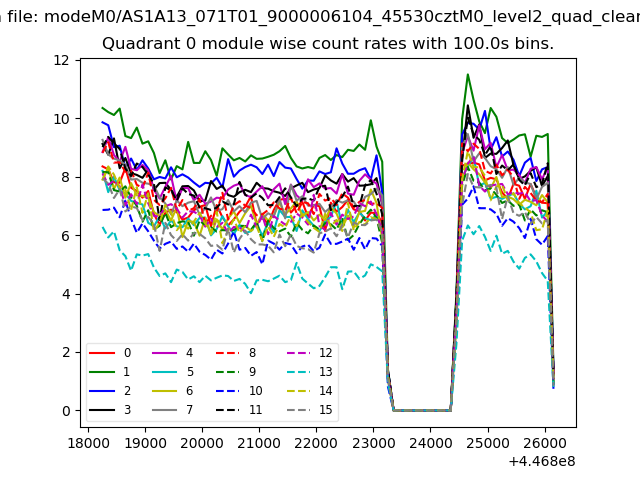
| Module-wise count rates for Quadrant A Data is divided into 100 sec bins |
 |
 |
| Module-wise count rates for Quadrant B Data is divided into 100 sec bins |
 |
 |
| Module-wise count rates for Quadrant C Data is divided into 100 sec bins |
 |
 |
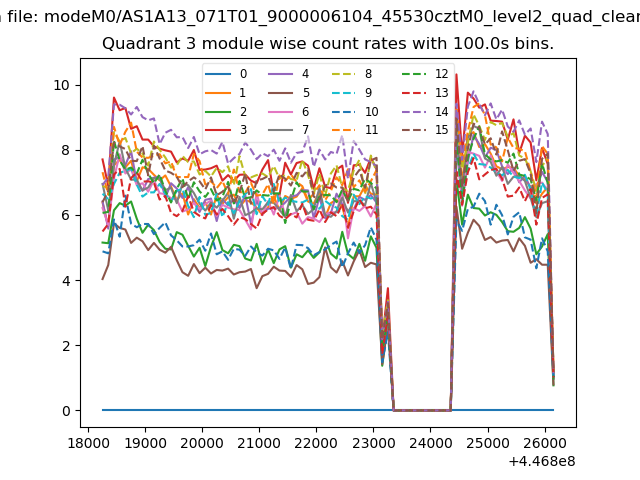
| Module-wise count rates for Quadrant D Data is divided into 100 sec bins |
 |
 |
| Parameter | Plot |
|---|---|
| CZT HV Monitor | 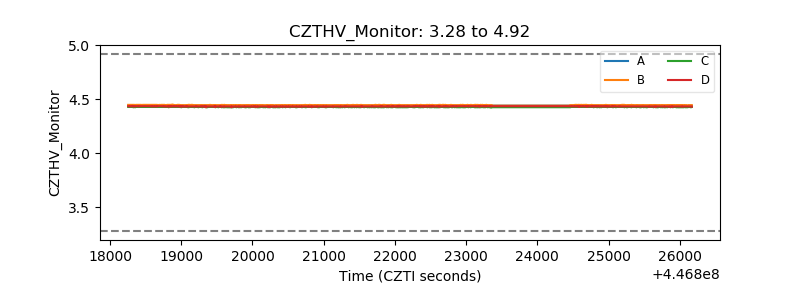 |
| D_VDD | 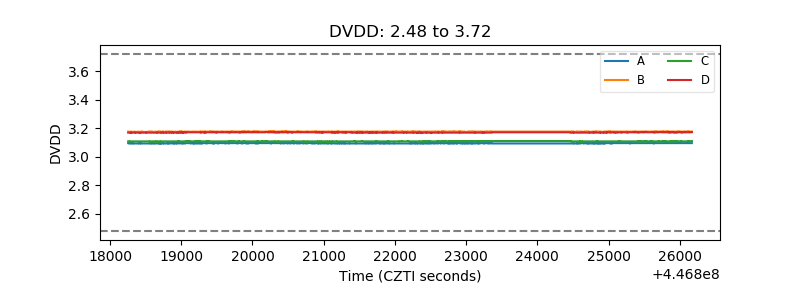 |
| Temperature 1 | 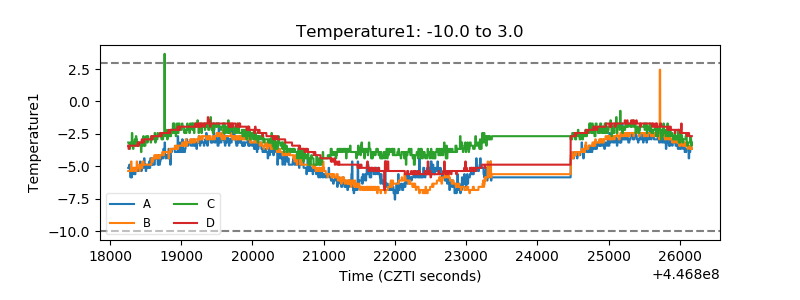 |
| Veto HV Monitor | 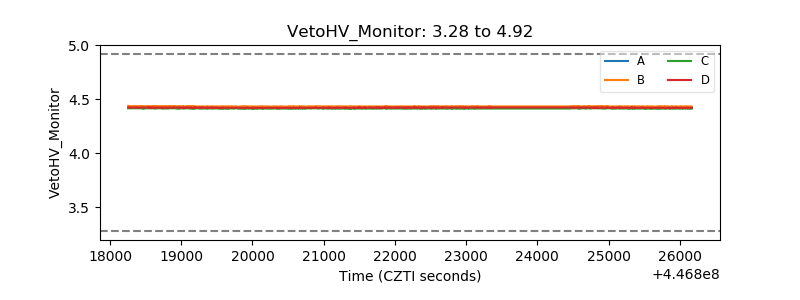 |
| Veto LLD | 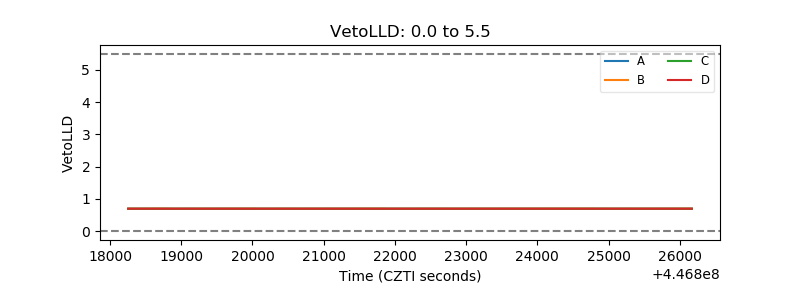 |
| Alpha Counter | 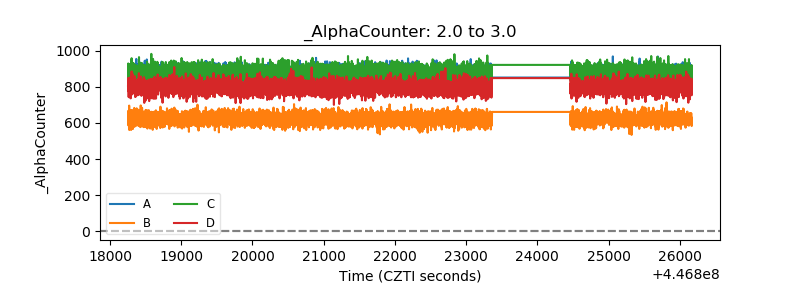 |
| _CPM_Rate | 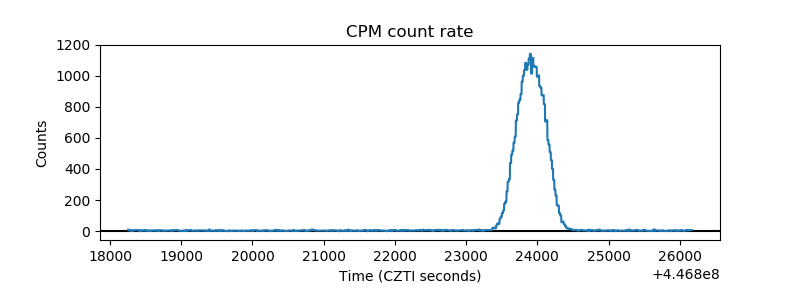 |
| CZT Counter | 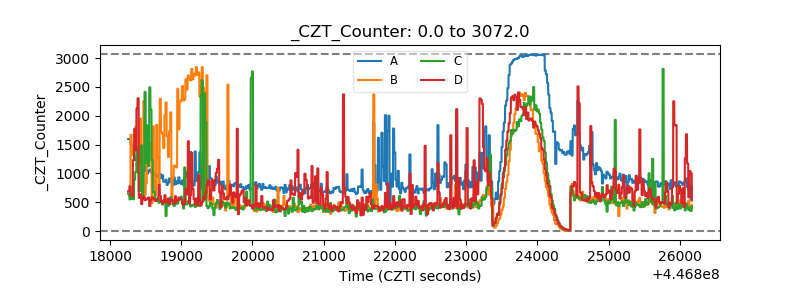 |
| +2.5 Volts monitor | 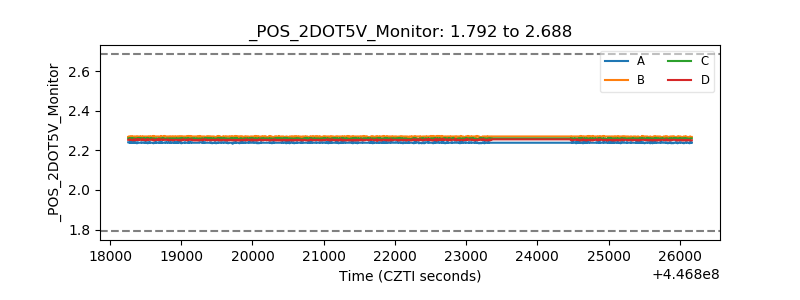 |
| +5 Volts monitor | 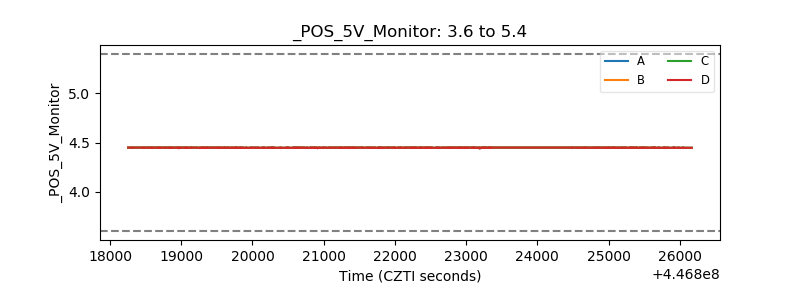 |
| _ROLL_ROT | 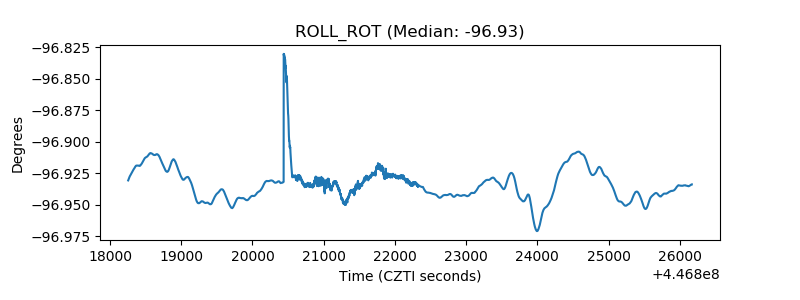 |
| _Roll_DEC | 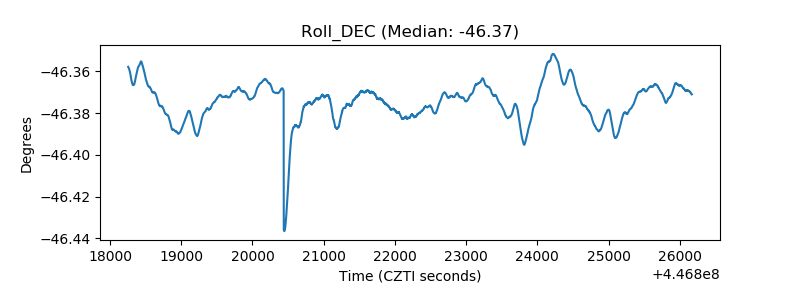 |
| _Roll_RA | 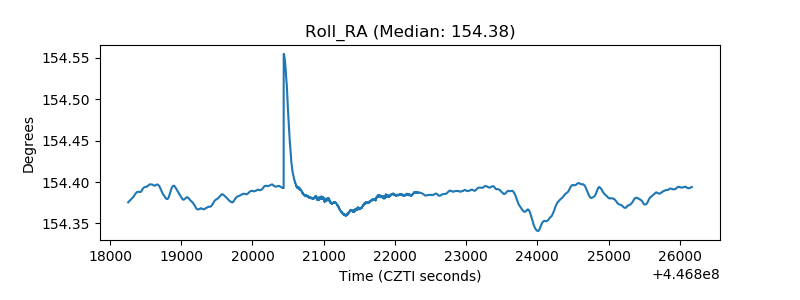 |
| Veto Counter | 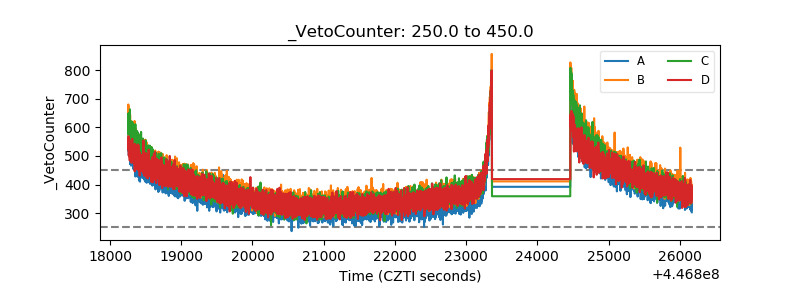 |