| Param | Original file | Final file |
|---|---|---|
| Filename | modeM0/AS1A13_071T01_9000006104_45531cztM0_level2.fits | modeM0/AS1A13_071T01_9000006104_45531cztM0_level2_quad_clean.evt |
| Size (bytes) | 489,337,920 | 108,938,880 |
| Size | 466.7 MB | 103.9 MB |
| Events in quadrant A | 5,432,874 | 739,298 |
| Events in quadrant B | 3,149,916 | 776,041 |
| Events in quadrant C | 3,393,260 | 718,154 |
| Events in quadrant D | 5,644,019 | 621,711 |
| Mode SS | |||
|---|---|---|---|
| Quadrant | BADHDUFLAG | Total packets | Discarded packets |
| A | 0 | 128 | 0 |
| B | 0 | 128 | 0 |
| C | 0 | 128 | 0 |
| D | 0 | 128 | 0 |
| Mode M9 | |||
|---|---|---|---|
| Quadrant | BADHDUFLAG | Total packets | Discarded packets |
| A | 0 | 12 | 0 |
| B | 0 | 12 | 0 |
| C | 0 | 12 | 0 |
| D | 0 | 12 | 0 |
| Mode M0 | |||
|---|---|---|---|
| Quadrant | BADHDUFLAG | Total packets | Discarded packets |
| A | 0 | 20558 | 1 |
| B | 0 | 13578 | 1 |
| C | 0 | 14633 | 1 |
| D | 0 | 21246 | 1 |
| Quadrant | Total seconds | Saturated seconds | Saturation percentage |
|---|---|---|---|
| A | 6359 | 225 | 3.538292% |
| B | 6360 | 122 | 1.918239% |
| C | 6360 | 215 | 3.380503% |
| D | 6360 | 574 | 9.025157% |
Noise dominated data is calculated using 1-second bins in cleaned event files. If a bin has >2000 counts, and if more than 50% of those come from <1% of pixels, then it is considered to be noise-dominated and hence unusable.
| Quadrant | # 1 sec bins | Bins with >0 counts | Bins with >2000 counts | High rate bins dominated by noise | Noise dominated (total time) | Noise dominated (detector-on time) | Marked lightcurve |
|---|---|---|---|---|---|---|---|
| A | 7534 | 6360 | 28 | 28 | 0.37% | 0.44% | 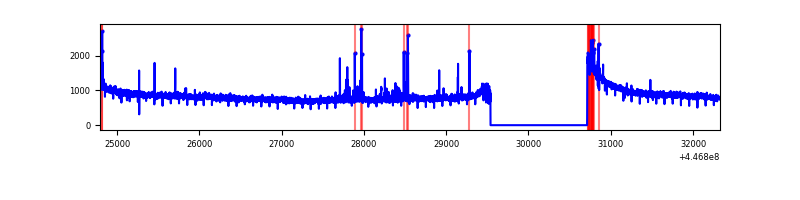 |
| B | 7535 | 6361 | 22 | 22 | 0.29% | 0.35% | 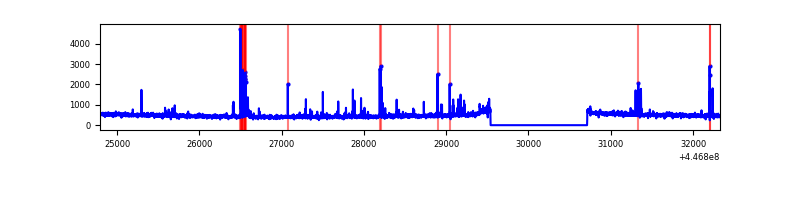 |
| C | 7535 | 6361 | 125 | 125 | 1.66% | 1.97% | 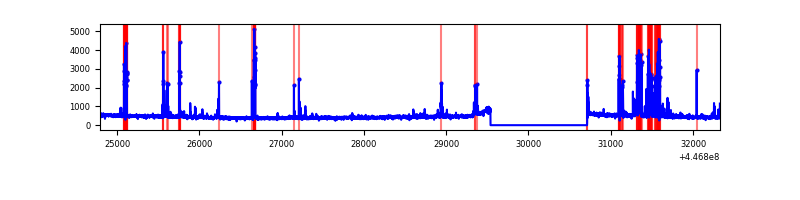 |
| D | 7535 | 6361 | 459 | 459 | 6.09% | 7.22% | 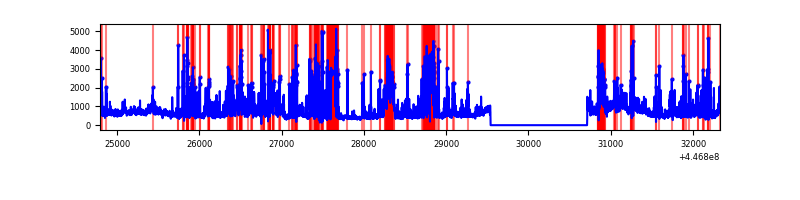 |
Top three noisy pixels from each quadrant. If the there are fewer than three noisy pixels in the level2.evt file, extra rows are filled as -1
| Pixel properties | Quadrant properties | ||||||
|---|---|---|---|---|---|---|---|
| Quadrant | DetID | PixID | Counts | Sigma | Mean | Median | Sigma |
| A | 10 | 83 | 2482332 | 16431.19 | 736 | 723 | 151.0 |
| A | 13 | 248 | 104447 | 686.78 | 736 | 723 | 151.0 |
| A | 3 | 137 | 8257 | 49.88 | 736 | 723 | 151.0 |
| B | 5 | 172 | 162260 | 1130.33 | 738 | 716 | 142.9 |
| B | 0 | 155 | 30684 | 209.69 | 738 | 716 | 142.9 |
| B | 0 | 183 | 23426 | 158.9 | 738 | 716 | 142.9 |
| C | 12 | 2 | 423717 | 2542.14 | 709 | 713 | 166.4 |
| C | 14 | 254 | 142218 | 850.41 | 709 | 713 | 166.4 |
| C | 2 | 14 | 60894 | 361.67 | 709 | 713 | 166.4 |
| D | 1 | 52 | 1793091 | 10432.99 | 687 | 667 | 171.8 |
| D | 13 | 249 | 401307 | 2331.97 | 687 | 667 | 171.8 |
| D | 5 | 171 | 362460 | 2105.85 | 687 | 667 | 171.8 |
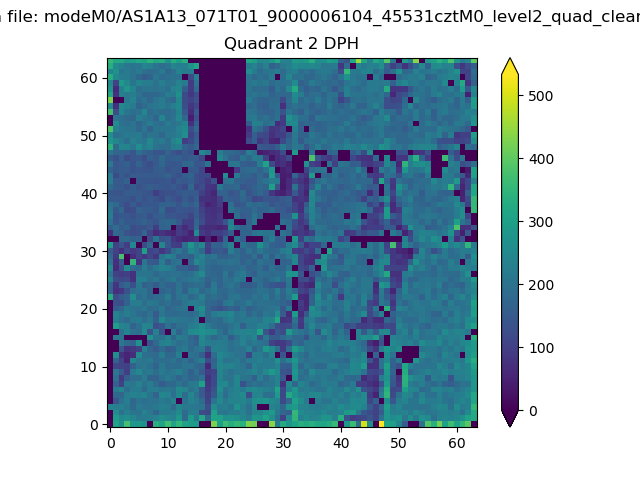
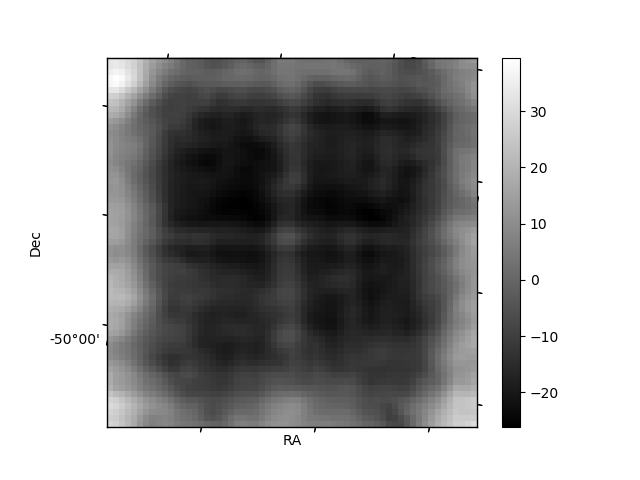
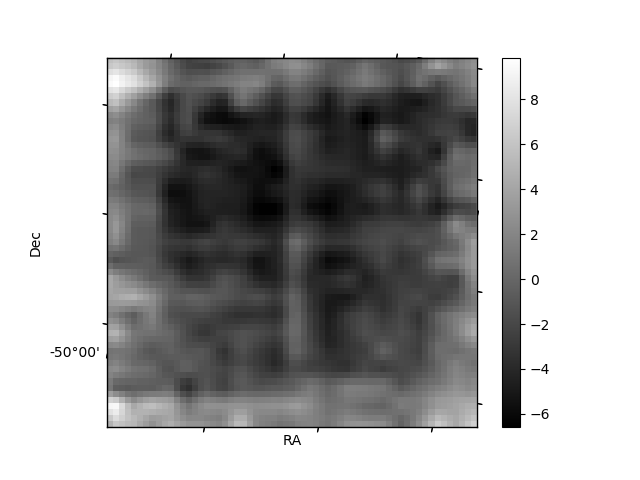
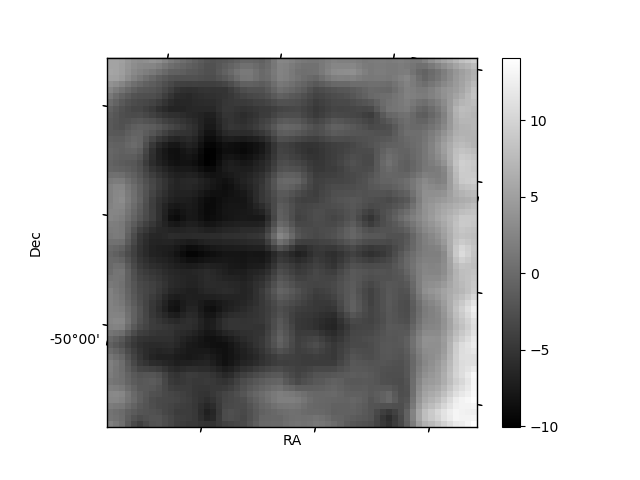
Histogram calculated using DETX and DETY for each event in the final _common_clean file
| Quadrant A | 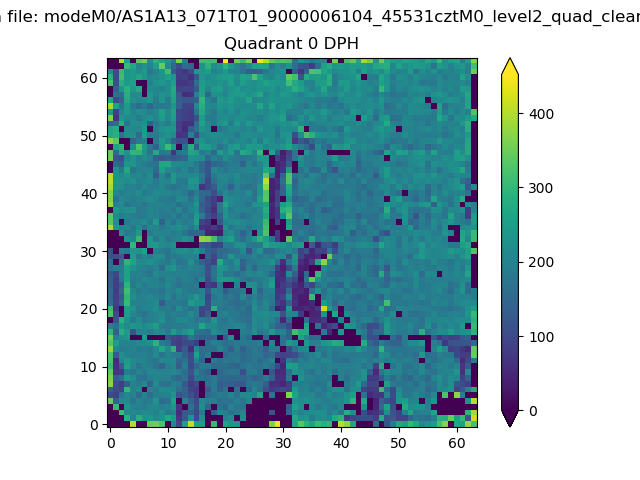 |
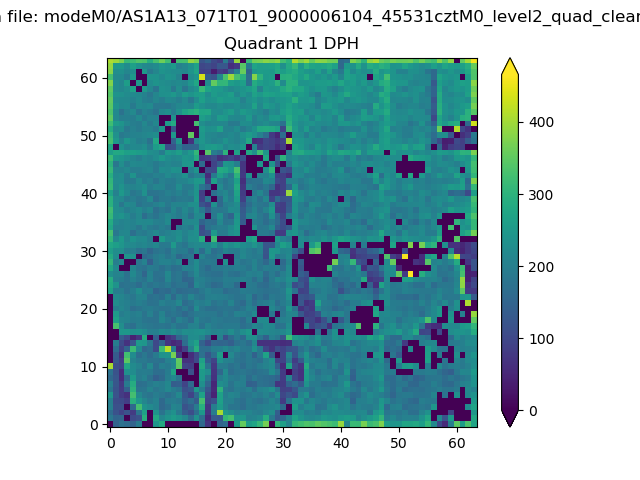 |
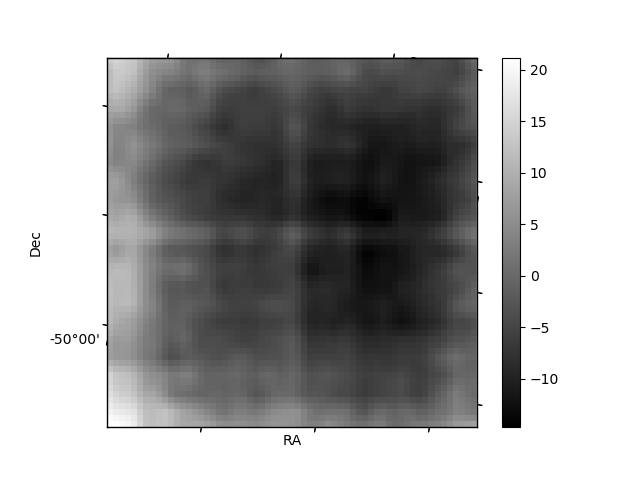
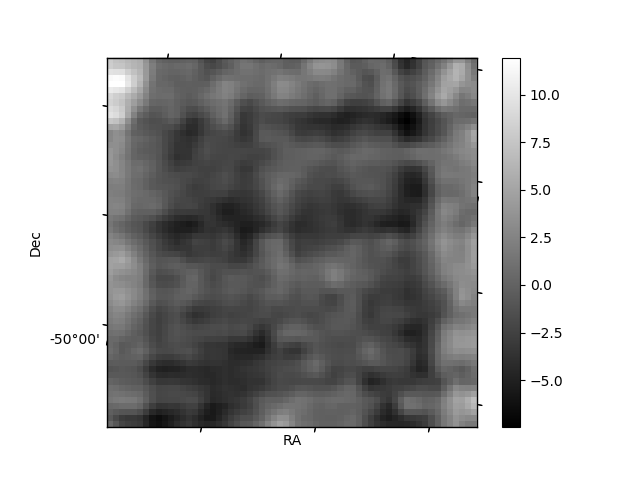
Quadrant B |
|---|---|---|---|
| Quadrant D | 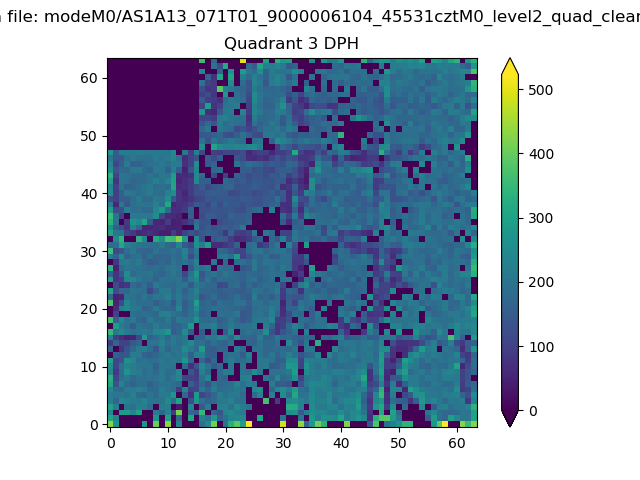 |
 |
Quadrant C |
| Plot type | Count rate plots | Images |
|---|---|---|
| Comparison with Poisson distribution Blue bars denote a histogram of data divided into 1 sec bins. Red curve is a Poisson curve with rate = median count rate of data. |
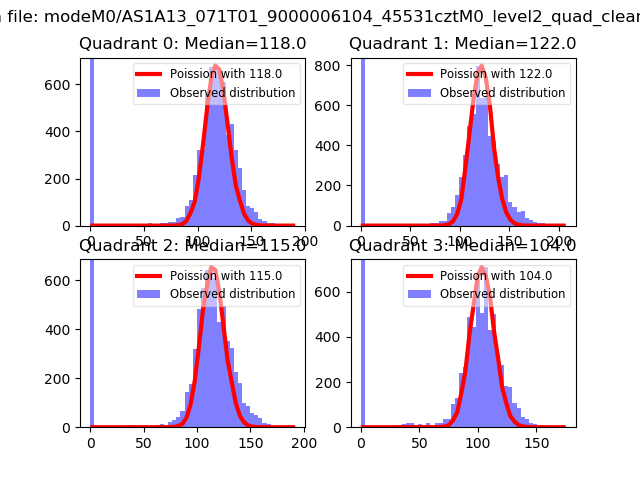 |
 |
| Quadrant-wise count rates Data is divided into 100 sec bins |
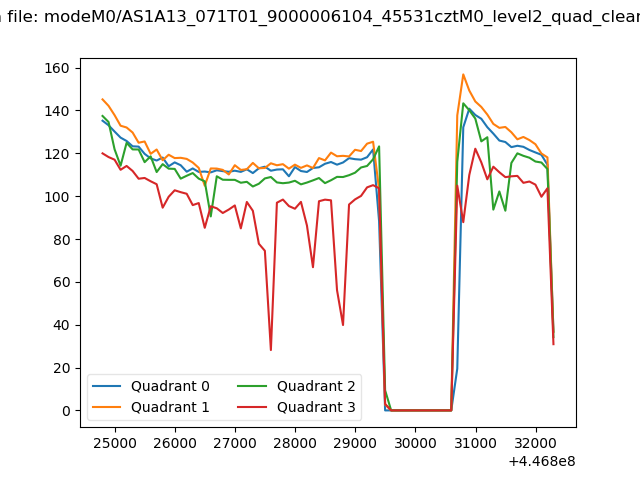 |
|
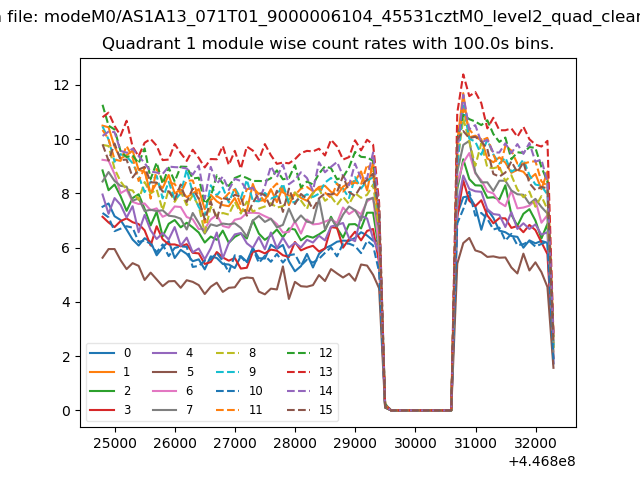
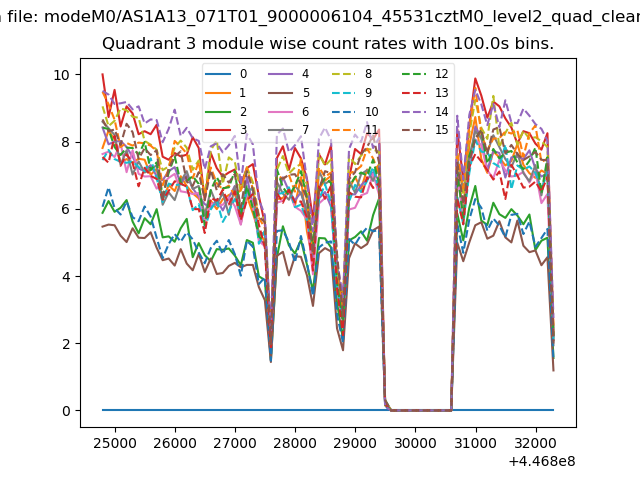
| Module-wise count rates for Quadrant A Data is divided into 100 sec bins |
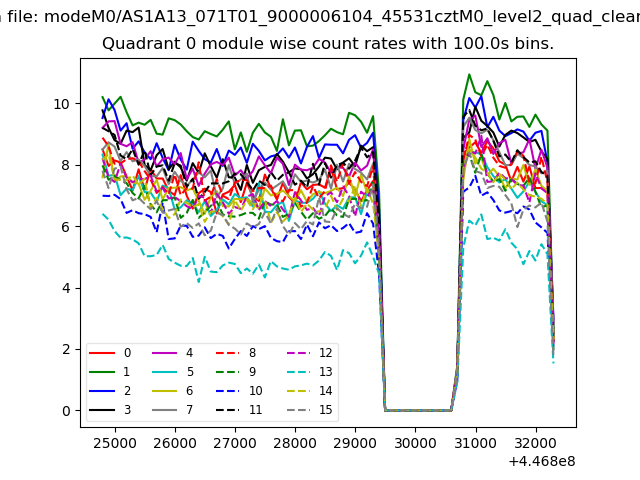 |
 |
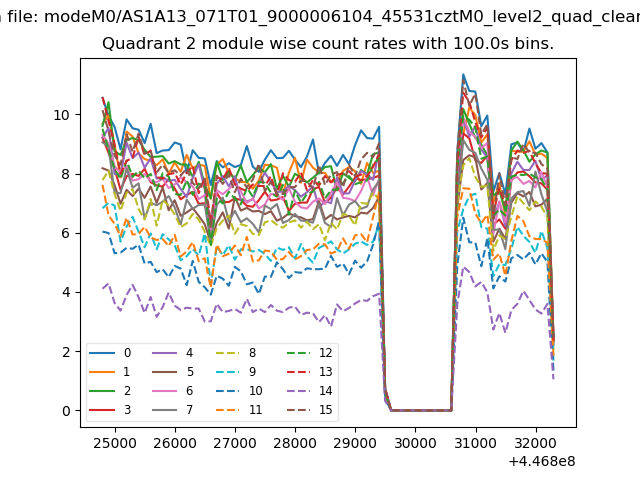
| Module-wise count rates for Quadrant B Data is divided into 100 sec bins |
 |
 |
| Module-wise count rates for Quadrant C Data is divided into 100 sec bins |
 |
 |
| Module-wise count rates for Quadrant D Data is divided into 100 sec bins |
 |
 |
| Parameter | Plot |
|---|---|
| CZT HV Monitor | 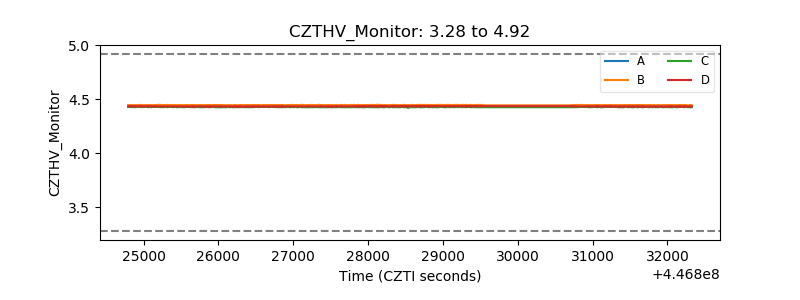 |
| D_VDD | 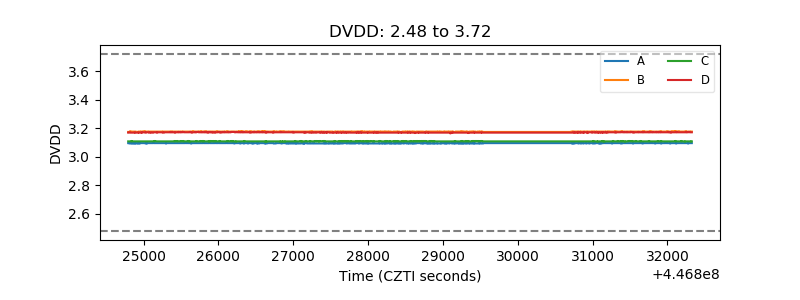 |
| Temperature 1 | 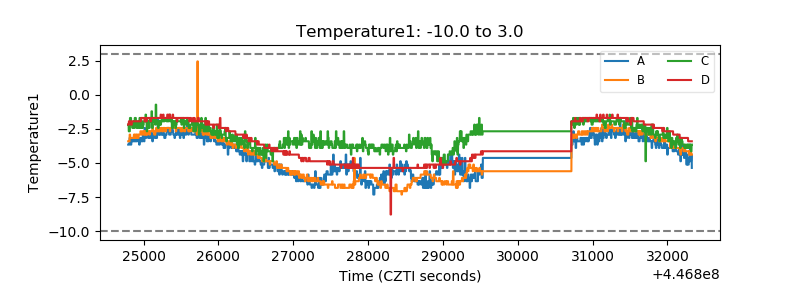 |
| Veto HV Monitor | 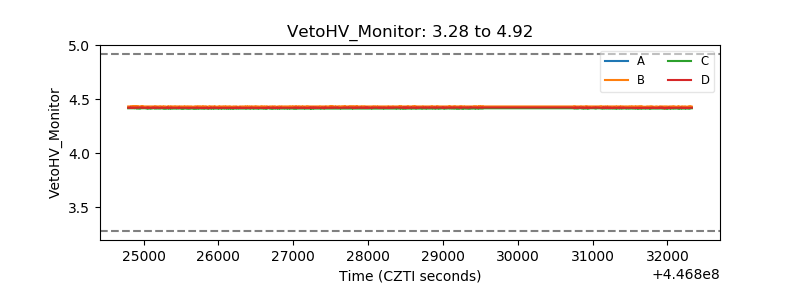 |
| Veto LLD | 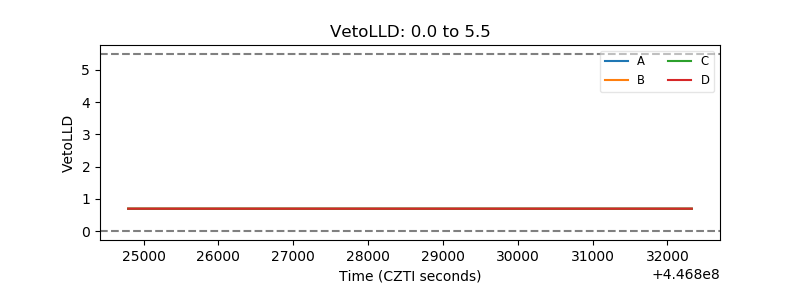 |
| Alpha Counter | 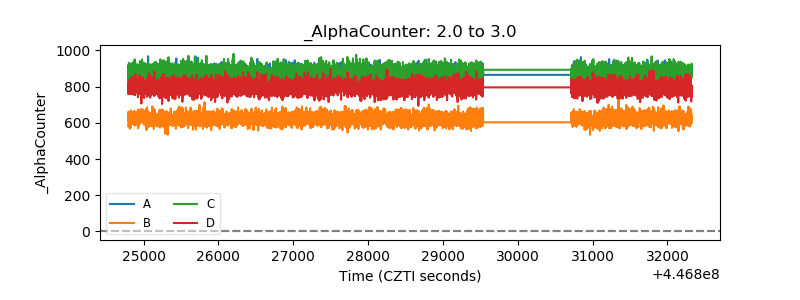 |
| _CPM_Rate | 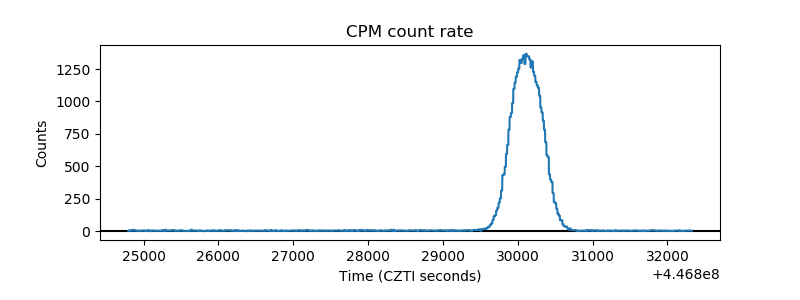 |
| CZT Counter | 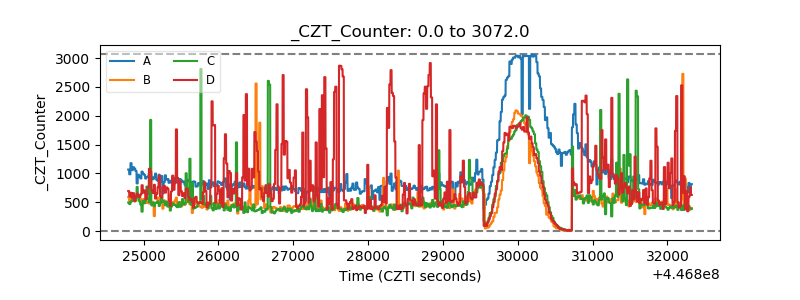 |
| +2.5 Volts monitor | 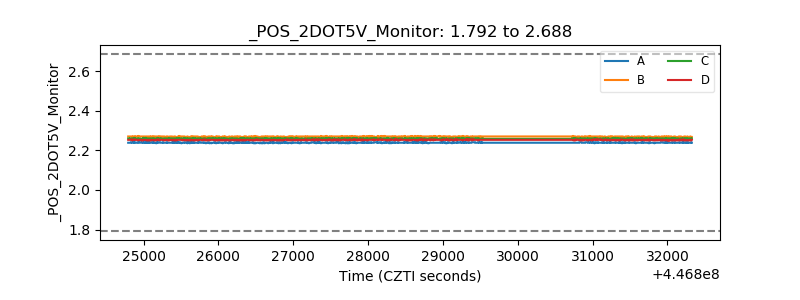 |
| +5 Volts monitor | 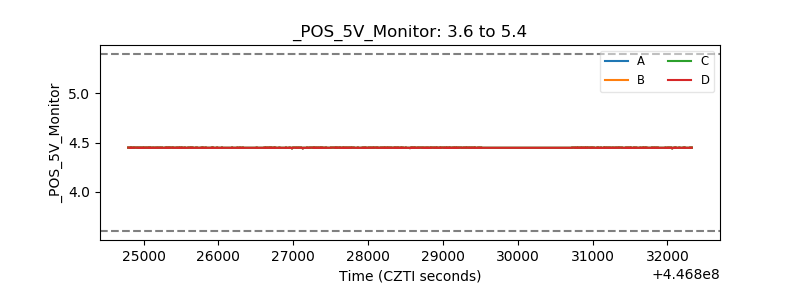 |
| _ROLL_ROT | 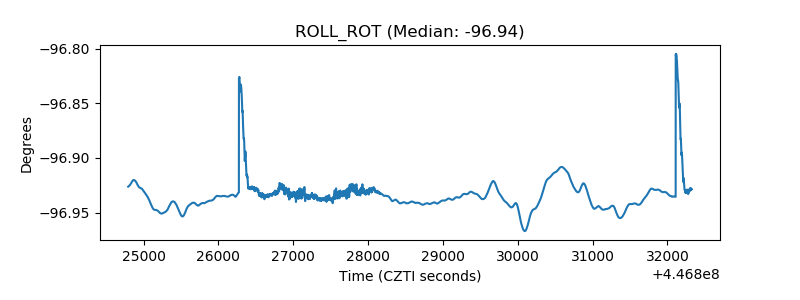 |
| _Roll_DEC | 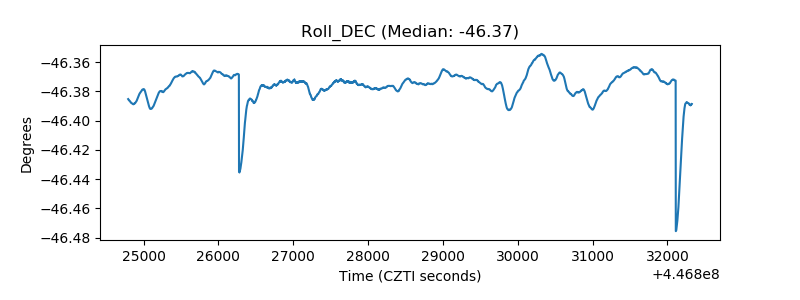 |
| _Roll_RA | 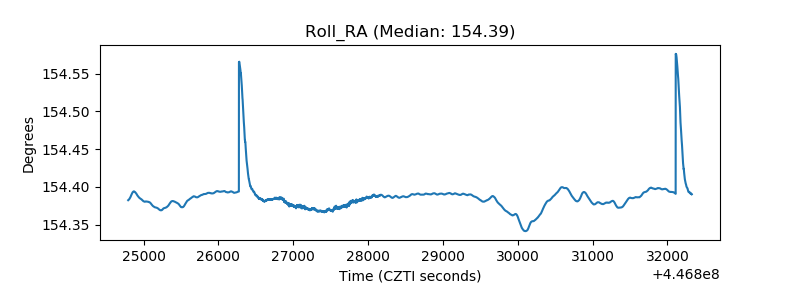 |
| Veto Counter |  |