| Param | Original file | Final file |
|---|---|---|
| Filename | modeM0/AS1A13_071T01_9000006104_45533cztM0_level2.fits | modeM0/AS1A13_071T01_9000006104_45533cztM0_level2_quad_clean.evt |
| Size (bytes) | 436,567,680 | 102,130,560 |
| Size | 416.3 MB | 97.4 MB |
| Events in quadrant A | 5,186,801 | 688,985 |
| Events in quadrant B | 3,015,543 | 715,622 |
| Events in quadrant C | 2,812,397 | 674,275 |
| Events in quadrant D | 4,675,256 | 591,025 |
| Mode SS | |||
|---|---|---|---|
| Quadrant | BADHDUFLAG | Total packets | Discarded packets |
| A | 0 | 122 | 0 |
| B | 0 | 122 | 0 |
| C | 0 | 122 | 0 |
| D | 0 | 122 | 0 |
| Mode M9 | |||
|---|---|---|---|
| Quadrant | BADHDUFLAG | Total packets | Discarded packets |
| A | 0 | 12 | 0 |
| B | 0 | 12 | 0 |
| C | 0 | 12 | 0 |
| D | 0 | 12 | 0 |
| Mode M0 | |||
|---|---|---|---|
| Quadrant | BADHDUFLAG | Total packets | Discarded packets |
| A | 0 | 19705 | 1 |
| B | 0 | 13195 | 1 |
| C | 0 | 12950 | 1 |
| D | 0 | 18196 | 1 |
| Quadrant | Total seconds | Saturated seconds | Saturation percentage |
|---|---|---|---|
| A | 6054 | 149 | 2.461183% |
| B | 6054 | 114 | 1.883053% |
| C | 6054 | 48 | 0.792864% |
| D | 6054 | 306 | 5.054509% |
Noise dominated data is calculated using 1-second bins in cleaned event files. If a bin has >2000 counts, and if more than 50% of those come from <1% of pixels, then it is considered to be noise-dominated and hence unusable.
| Quadrant | # 1 sec bins | Bins with >0 counts | Bins with >2000 counts | High rate bins dominated by noise | Noise dominated (total time) | Noise dominated (detector-on time) | Marked lightcurve |
|---|---|---|---|---|---|---|---|
| A | 7249 | 6055 | 30 | 30 | 0.41% | 0.50% | 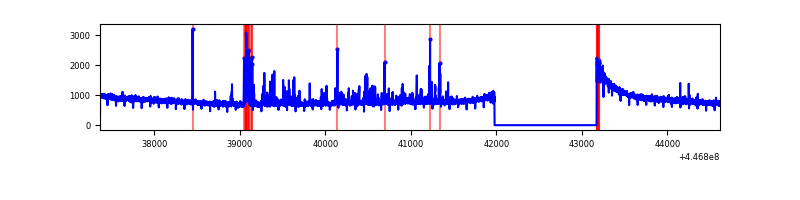 |
| B | 7249 | 6055 | 59 | 59 | 0.81% | 0.97% | 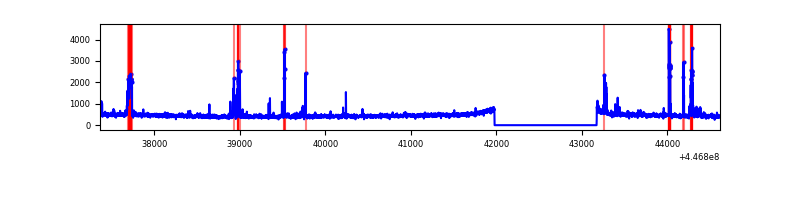 |
| C | 7249 | 6055 | 19 | 19 | 0.26% | 0.31% | 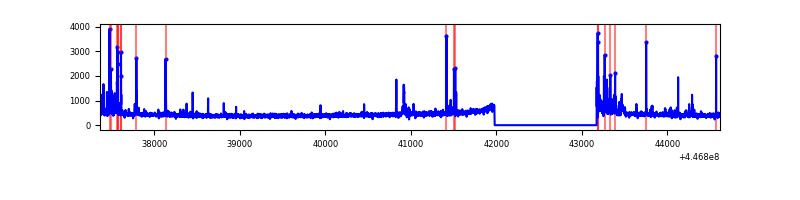 |
| D | 7249 | 6055 | 239 | 239 | 3.30% | 3.95% | 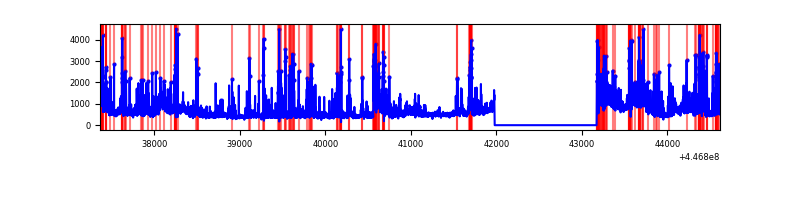 |
Top three noisy pixels from each quadrant. If the there are fewer than three noisy pixels in the level2.evt file, extra rows are filled as -1
| Pixel properties | Quadrant properties | ||||||
|---|---|---|---|---|---|---|---|
| Quadrant | DetID | PixID | Counts | Sigma | Mean | Median | Sigma |
| A | 10 | 83 | 2322528 | 16744.48 | 673 | 660 | 138.7 |
| A | 13 | 248 | 255394 | 1837.05 | 673 | 660 | 138.7 |
| A | 3 | 137 | 7665 | 50.52 | 673 | 660 | 138.7 |
| B | 5 | 172 | 139989 | 1056.86 | 679 | 661 | 131.8 |
| B | 15 | 201 | 82277 | 619.09 | 679 | 661 | 131.8 |
| B | 10 | 3 | 60838 | 456.47 | 679 | 661 | 131.8 |
| C | 12 | 2 | 199644 | 1295.57 | 658 | 662 | 153.6 |
| C | 14 | 254 | 39663 | 253.94 | 658 | 662 | 153.6 |
| C | 12 | 249 | 4925 | 27.76 | 658 | 662 | 153.6 |
| D | 1 | 52 | 863499 | 5376.35 | 637 | 617 | 160.5 |
| D | 13 | 249 | 482784 | 3004.23 | 637 | 617 | 160.5 |
| D | 5 | 171 | 460875 | 2867.73 | 637 | 617 | 160.5 |
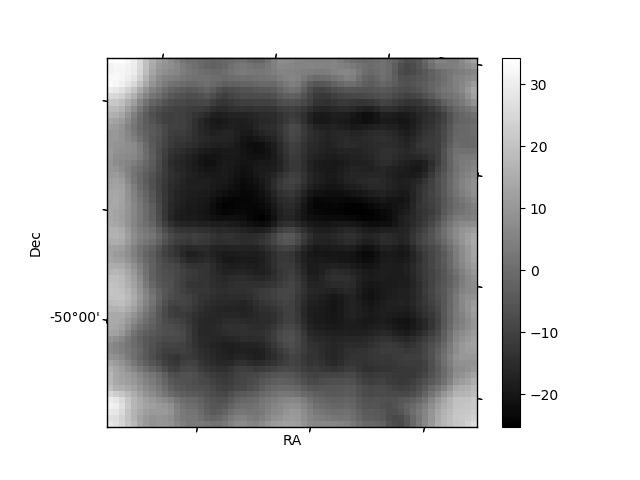
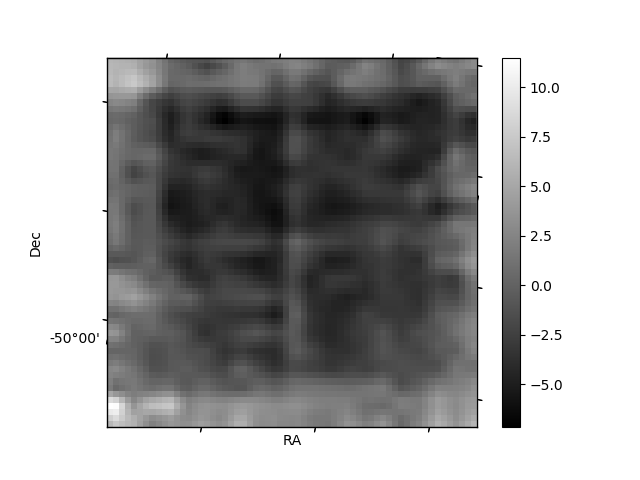
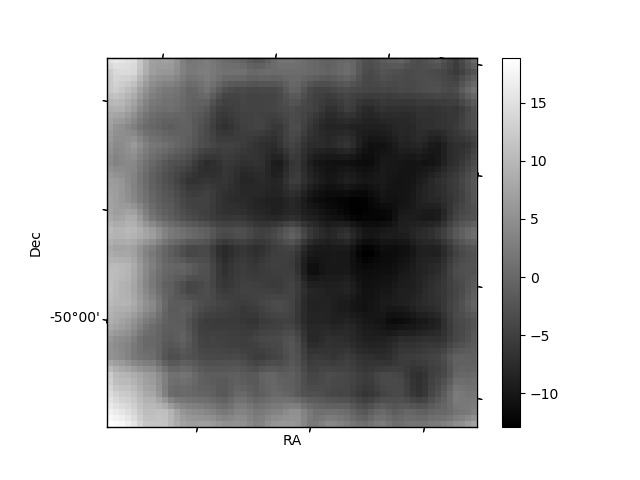
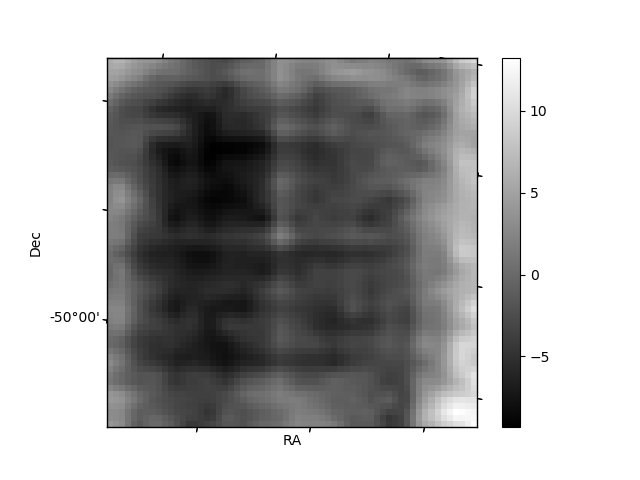
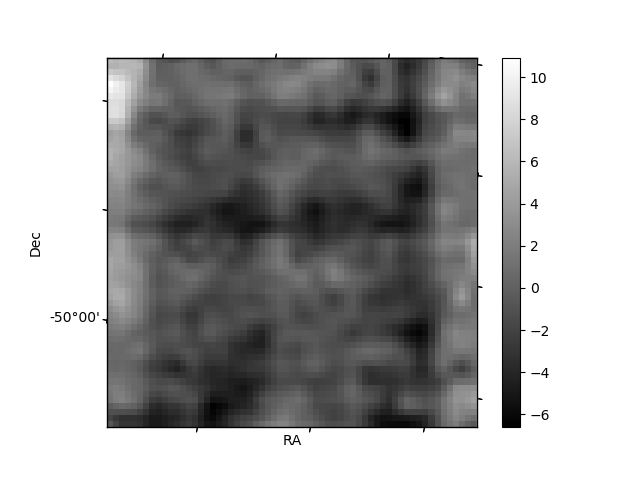
Histogram calculated using DETX and DETY for each event in the final _common_clean file
| Quadrant A | 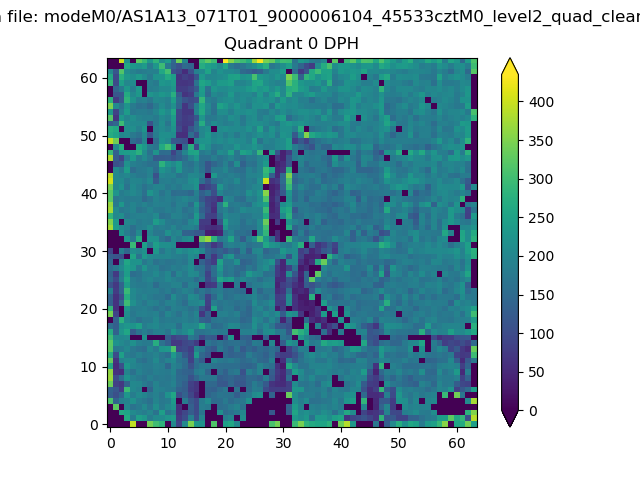 |
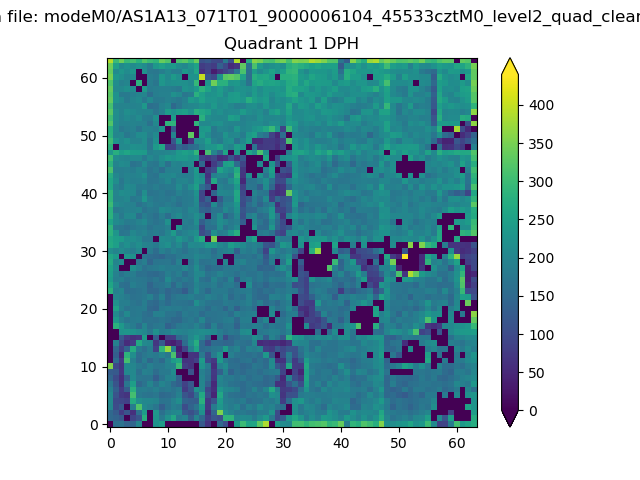 |
Quadrant B |
|---|---|---|---|
| Quadrant D | 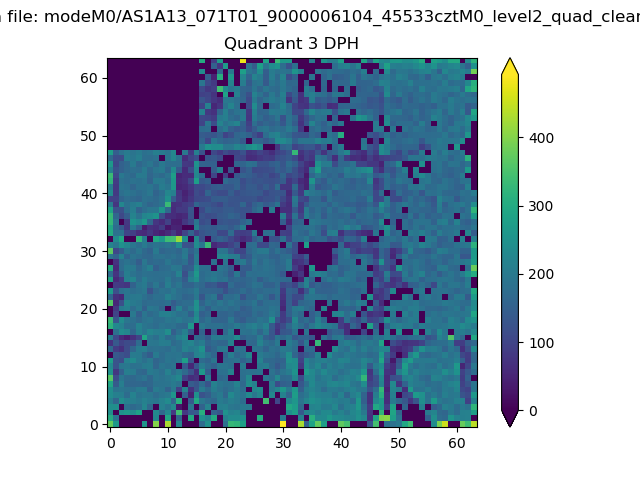 |
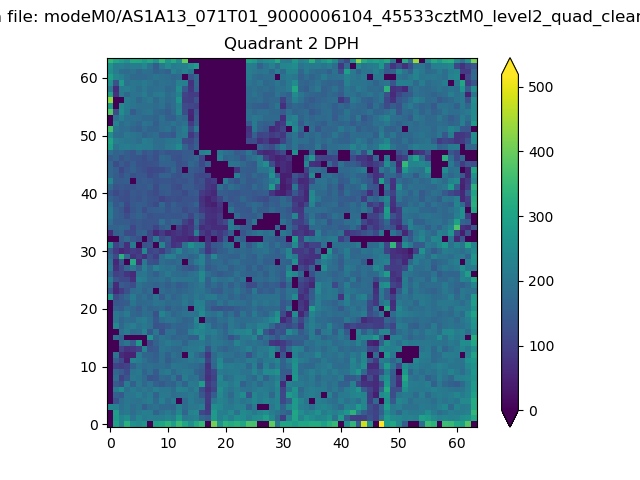 |
Quadrant C |
| Plot type | Count rate plots | Images |
|---|---|---|
| Comparison with Poisson distribution Blue bars denote a histogram of data divided into 1 sec bins. Red curve is a Poisson curve with rate = median count rate of data. |
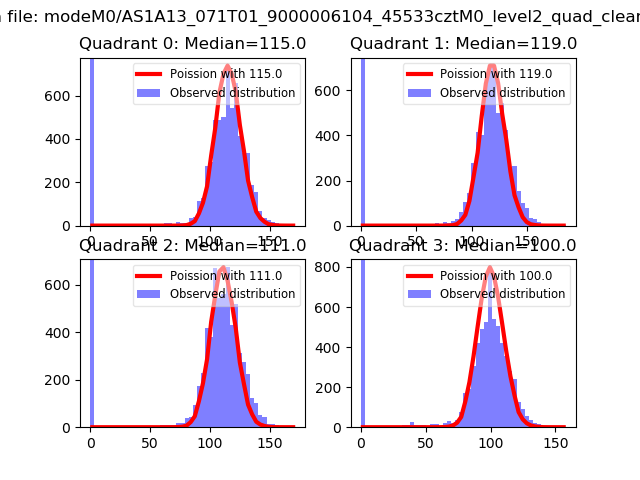 |
 |
| Quadrant-wise count rates Data is divided into 100 sec bins |
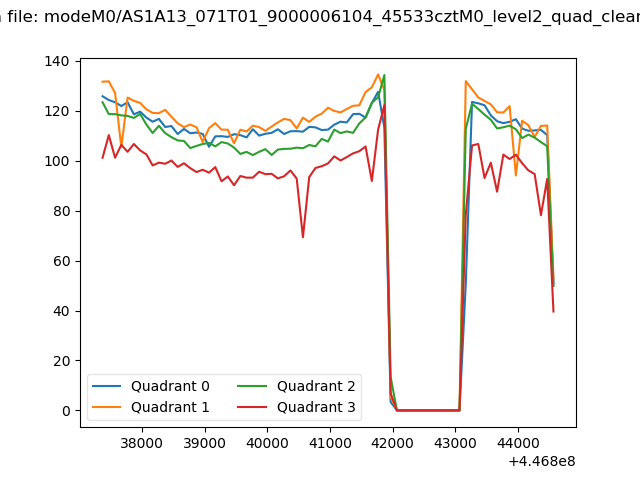 |
|
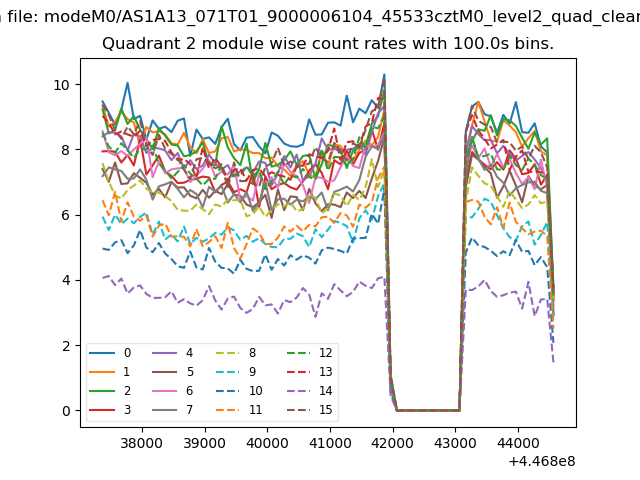
| Module-wise count rates for Quadrant A Data is divided into 100 sec bins |
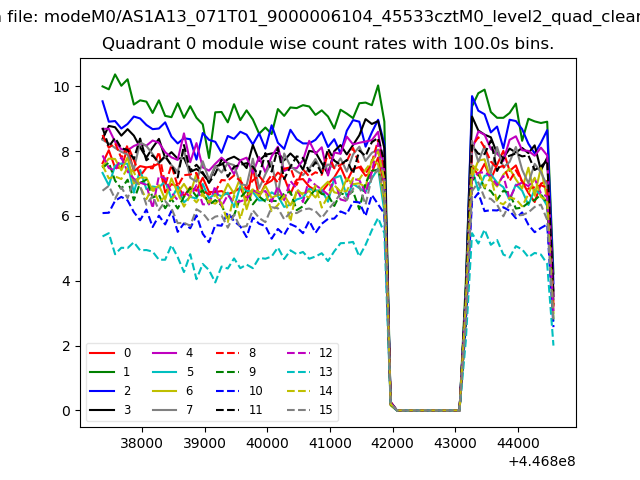 |
 |
| Module-wise count rates for Quadrant B Data is divided into 100 sec bins |
 |
 |
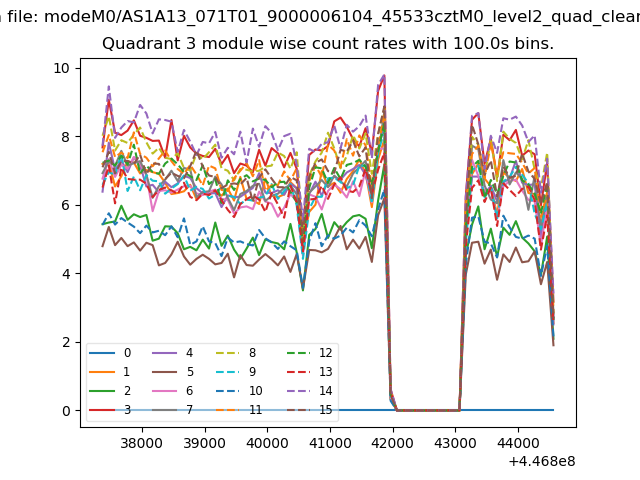
| Module-wise count rates for Quadrant C Data is divided into 100 sec bins |
 |
 |
| Module-wise count rates for Quadrant D Data is divided into 100 sec bins |
 |
 |
| Parameter | Plot |
|---|---|
| CZT HV Monitor |  |
| D_VDD | 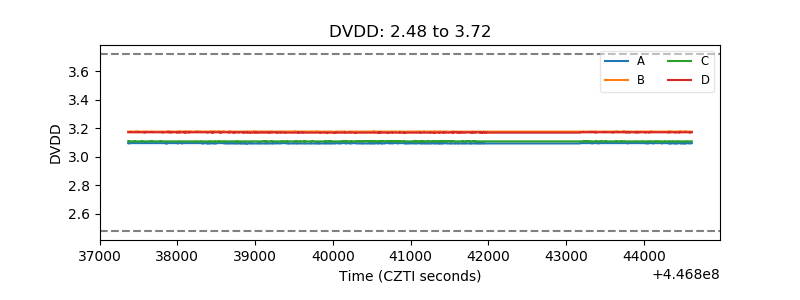 |
| Temperature 1 | 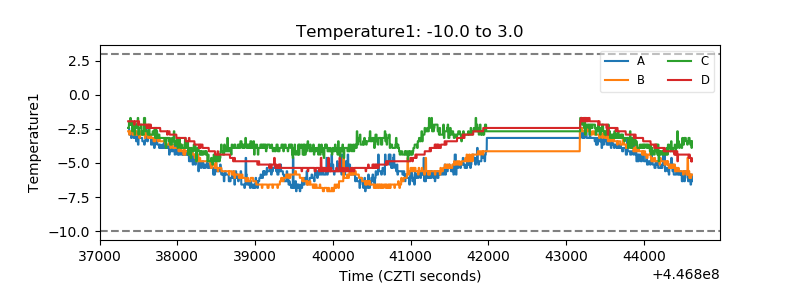 |
| Veto HV Monitor | 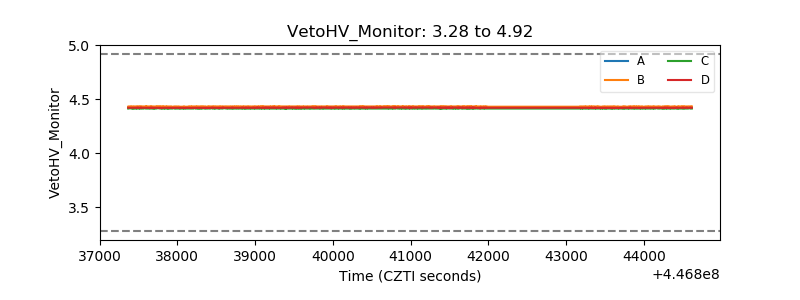 |
| Veto LLD | 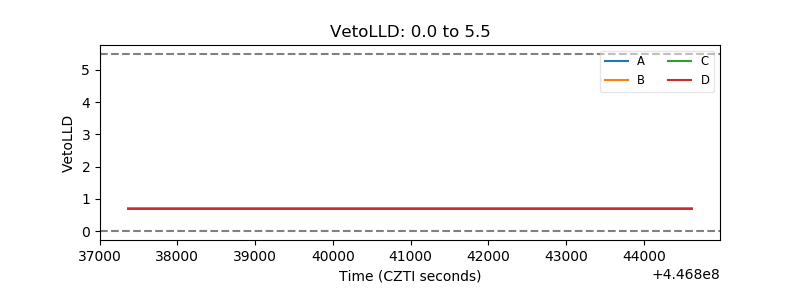 |
| Alpha Counter | 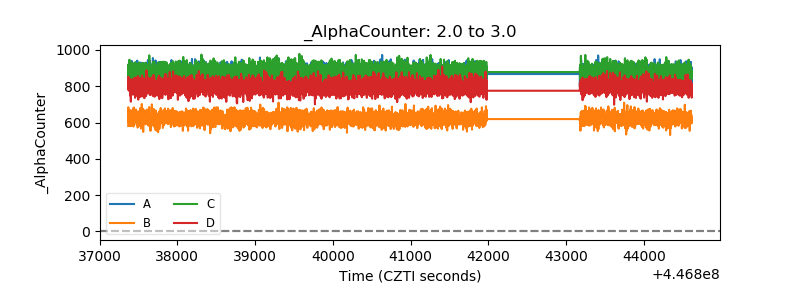 |
| _CPM_Rate | 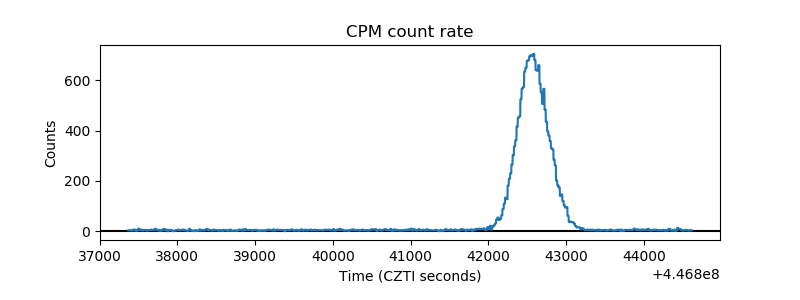 |
| CZT Counter | 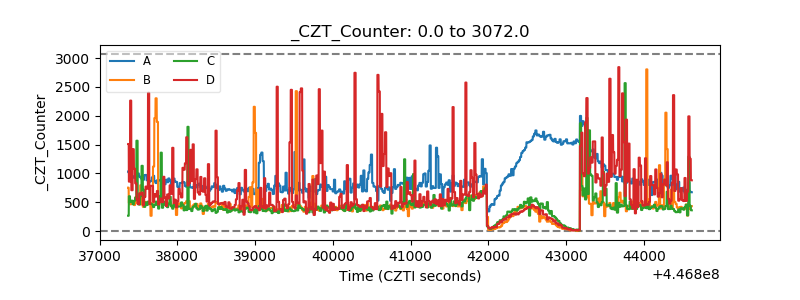 |
| +2.5 Volts monitor |  |
| +5 Volts monitor | 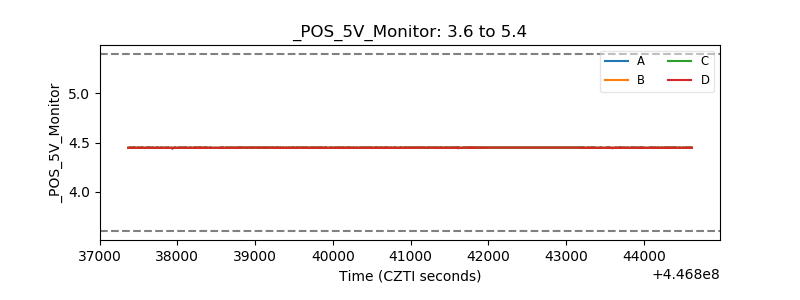 |
| _ROLL_ROT | 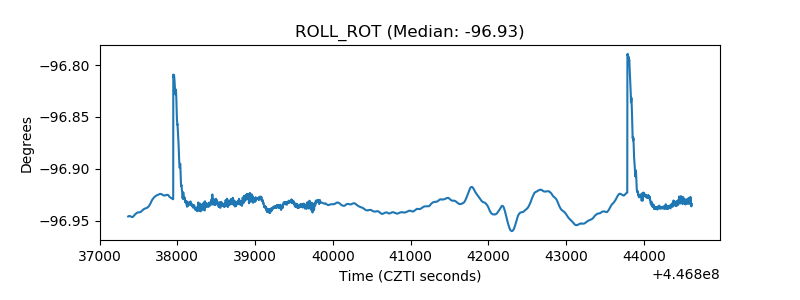 |
| _Roll_DEC | 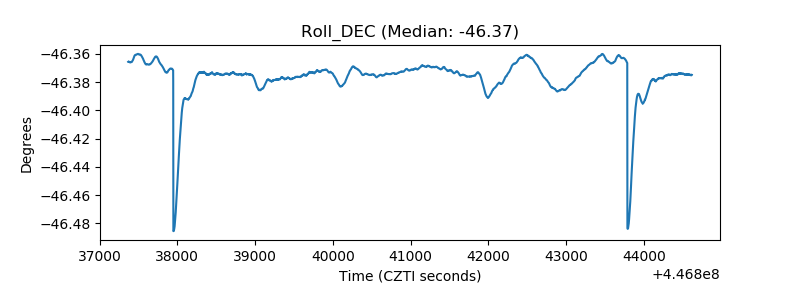 |
| _Roll_RA | 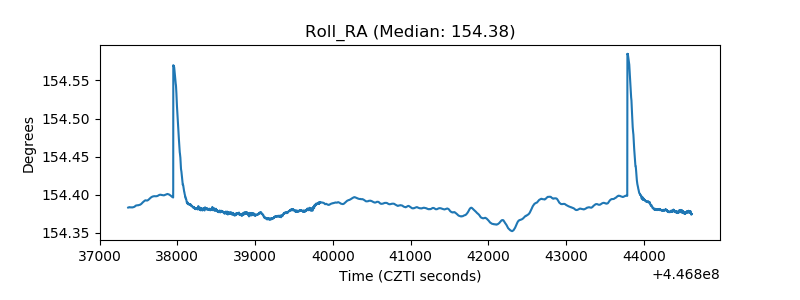 |
| Veto Counter | 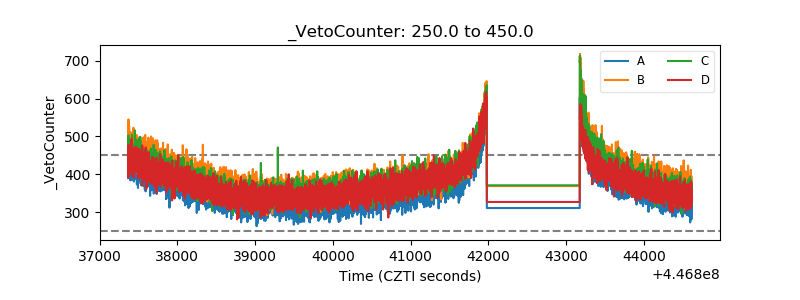 |