| Param | Original file | Final file |
|---|---|---|
| Filename | modeM0/AS1A13_071T01_9000006104_45534cztM0_level2.fits | modeM0/AS1A13_071T01_9000006104_45534cztM0_level2_quad_clean.evt |
| Size (bytes) | 505,010,880 | 106,738,560 |
| Size | 481.6 MB | 101.8 MB |
| Events in quadrant A | 5,991,561 | 714,227 |
| Events in quadrant B | 3,225,017 | 757,803 |
| Events in quadrant C | 3,010,378 | 713,140 |
| Events in quadrant D | 5,958,783 | 590,396 |
| Mode SS | |||
|---|---|---|---|
| Quadrant | BADHDUFLAG | Total packets | Discarded packets |
| A | 0 | 132 | 0 |
| B | 0 | 132 | 0 |
| C | 0 | 130 | 0 |
| D | 0 | 130 | 0 |
| Mode M9 | |||
|---|---|---|---|
| Quadrant | BADHDUFLAG | Total packets | Discarded packets |
| A | 0 | 14 | 0 |
| B | 0 | 15 | 0 |
| C | 0 | 15 | 0 |
| D | 0 | 15 | 0 |
| Mode M0 | |||
|---|---|---|---|
| Quadrant | BADHDUFLAG | Total packets | Discarded packets |
| A | 0 | 22552 | 2 |
| B | 0 | 14202 | 2 |
| C | 0 | 13901 | 2 |
| D | 0 | 22414 | 2 |
| Quadrant | Total seconds | Saturated seconds | Saturation percentage |
|---|---|---|---|
| A | 6551 | 257 | 3.923065% |
| B | 6551 | 75 | 1.144863% |
| C | 6550 | 37 | 0.564885% |
| D | 6550 | 734 | 11.206107% |
Noise dominated data is calculated using 1-second bins in cleaned event files. If a bin has >2000 counts, and if more than 50% of those come from <1% of pixels, then it is considered to be noise-dominated and hence unusable.
| Quadrant | # 1 sec bins | Bins with >0 counts | Bins with >2000 counts | High rate bins dominated by noise | Noise dominated (total time) | Noise dominated (detector-on time) | Marked lightcurve |
|---|---|---|---|---|---|---|---|
| A | 7581 | 6552 | 69 | 69 | 0.91% | 1.05% | 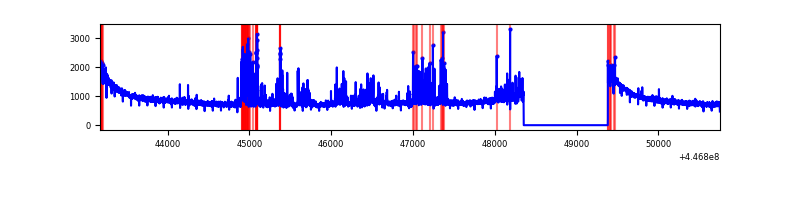 |
| B | 7581 | 6552 | 35 | 35 | 0.46% | 0.53% | 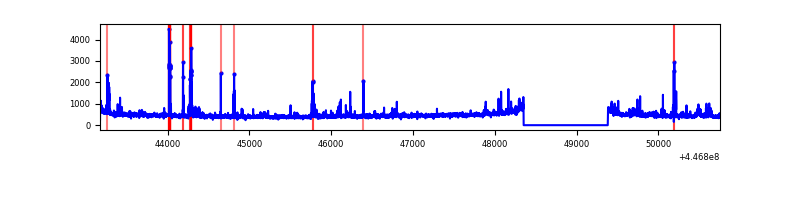 |
| C | 7580 | 6551 | 12 | 12 | 0.16% | 0.18% | 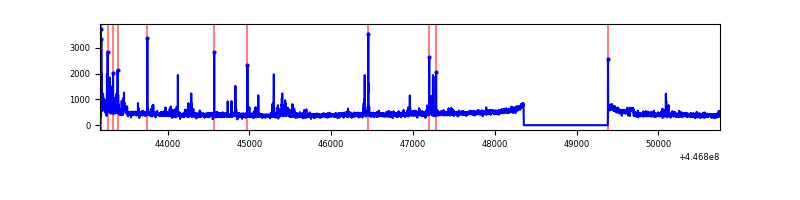 |
| D | 7580 | 6551 | 529 | 529 | 6.98% | 8.08% | 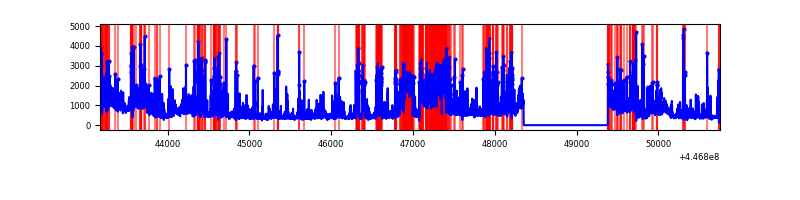 |
Top three noisy pixels from each quadrant. If the there are fewer than three noisy pixels in the level2.evt file, extra rows are filled as -1
| Pixel properties | Quadrant properties | ||||||
|---|---|---|---|---|---|---|---|
| Quadrant | DetID | PixID | Counts | Sigma | Mean | Median | Sigma |
| A | 10 | 83 | 2654884 | 17822.91 | 722 | 707 | 148.9 |
| A | 13 | 248 | 528800 | 3546.17 | 722 | 707 | 148.9 |
| A | 2 | 79 | 15426 | 98.84 | 722 | 707 | 148.9 |
| B | 5 | 172 | 119058 | 834.31 | 731 | 707 | 141.9 |
| B | 10 | 3 | 68556 | 478.3 | 731 | 707 | 141.9 |
| B | 0 | 155 | 63226 | 440.72 | 731 | 707 | 141.9 |
| C | 12 | 2 | 162197 | 965.0 | 710 | 714 | 167.3 |
| C | 14 | 254 | 44699 | 262.85 | 710 | 714 | 167.3 |
| C | 10 | 187 | 30692 | 179.14 | 710 | 714 | 167.3 |
| D | 13 | 249 | 1191829 | 7054.73 | 671 | 649 | 168.8 |
| D | 1 | 52 | 1027238 | 6079.95 | 671 | 649 | 168.8 |
| D | 5 | 171 | 511790 | 3027.22 | 671 | 649 | 168.8 |
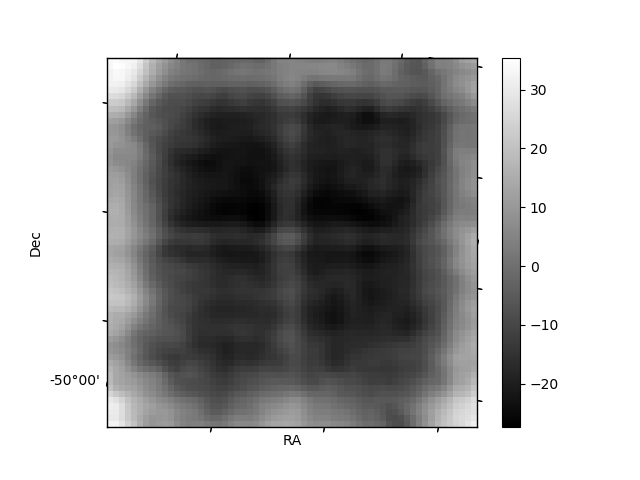
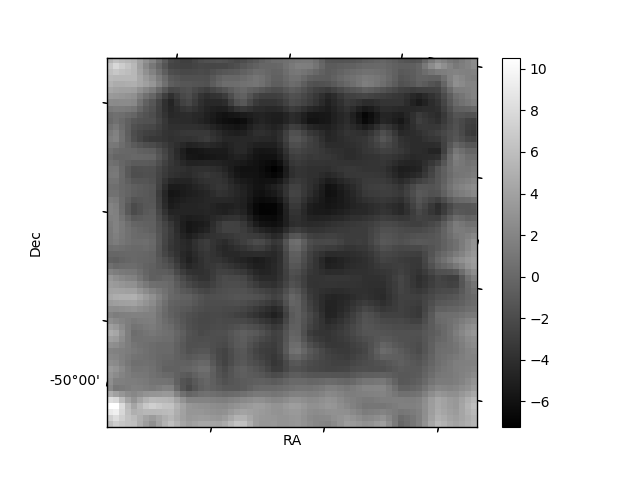
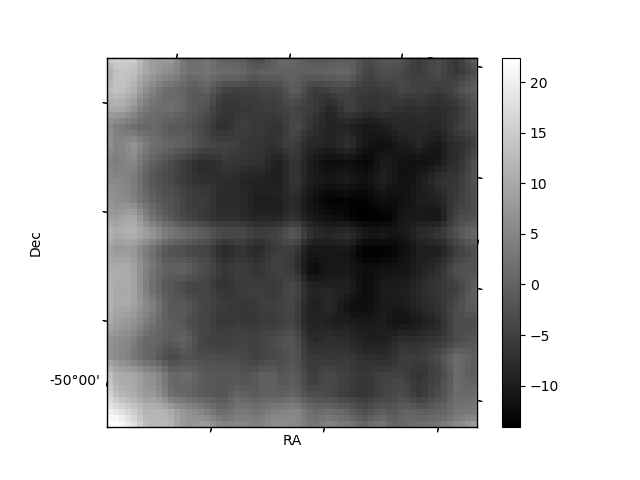
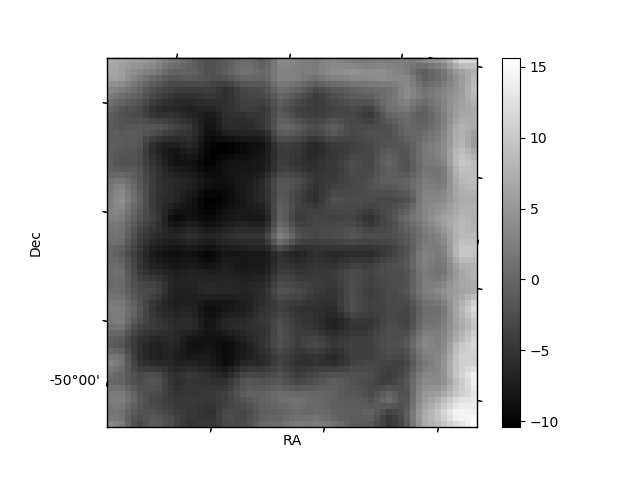
Histogram calculated using DETX and DETY for each event in the final _common_clean file
| Quadrant A | 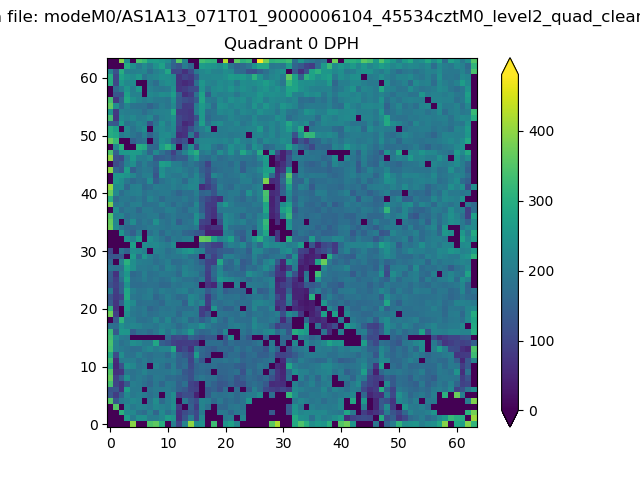 |
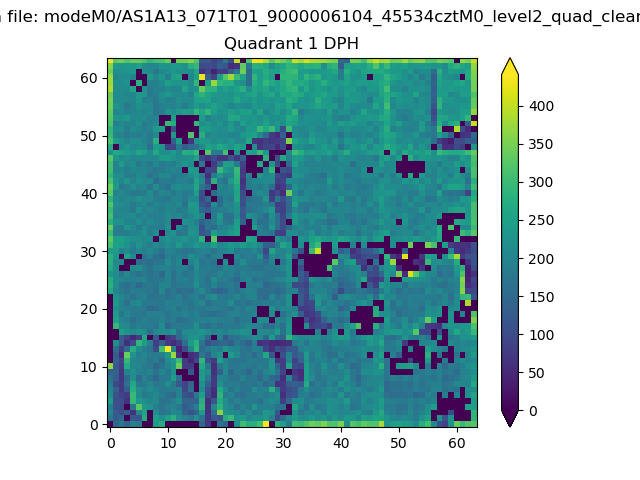 |
Quadrant B |
|---|---|---|---|
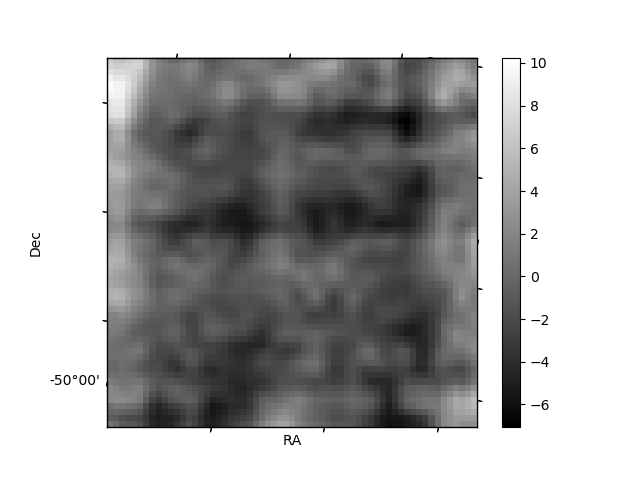
| Quadrant D | 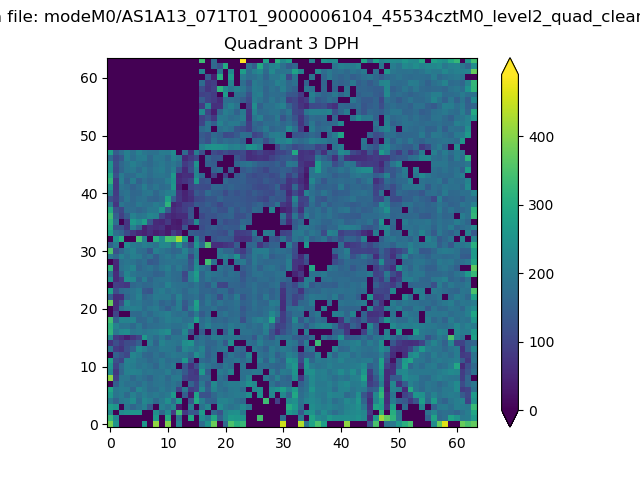 |
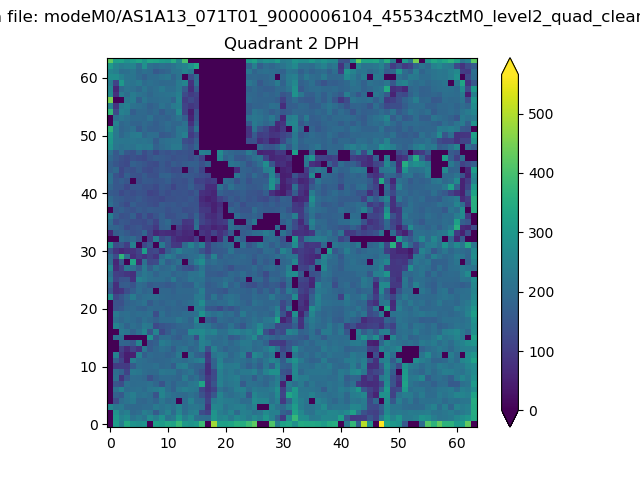 |
Quadrant C |
| Plot type | Count rate plots | Images |
|---|---|---|
| Comparison with Poisson distribution Blue bars denote a histogram of data divided into 1 sec bins. Red curve is a Poisson curve with rate = median count rate of data. |
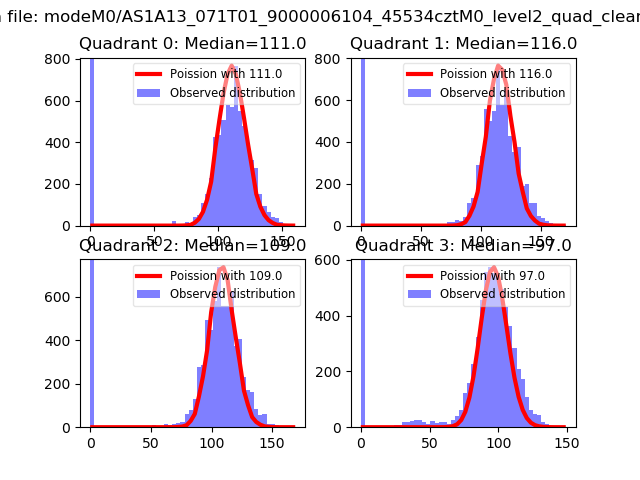 |
 |
| Quadrant-wise count rates Data is divided into 100 sec bins |
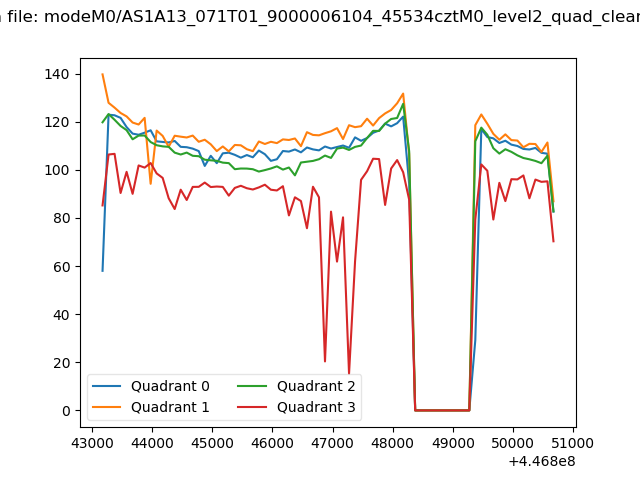 |
|
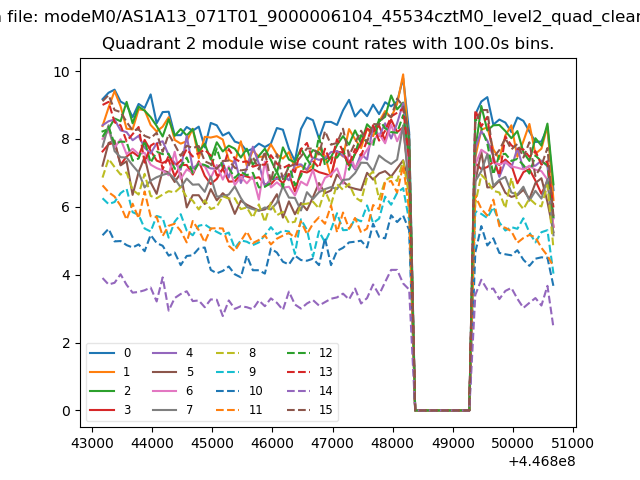
| Module-wise count rates for Quadrant A Data is divided into 100 sec bins |
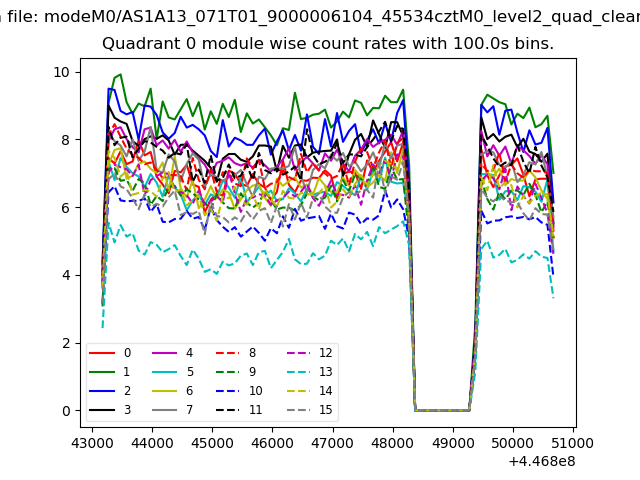 |
 |
| Module-wise count rates for Quadrant B Data is divided into 100 sec bins |
 |
 |
| Module-wise count rates for Quadrant C Data is divided into 100 sec bins |
 |
 |
| Module-wise count rates for Quadrant D Data is divided into 100 sec bins |
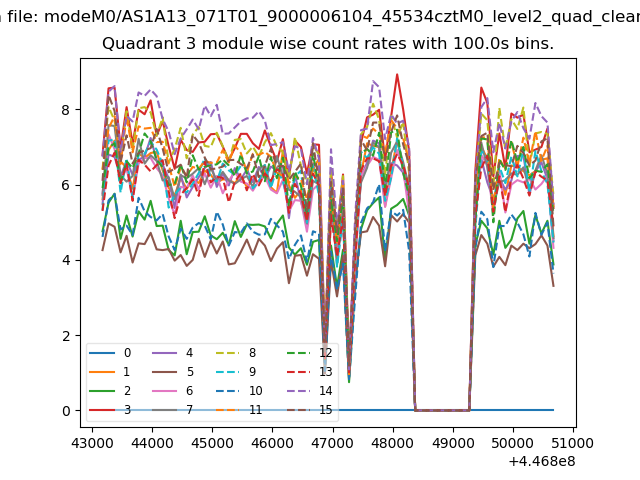 |
 |
| Parameter | Plot |
|---|---|
| CZT HV Monitor | 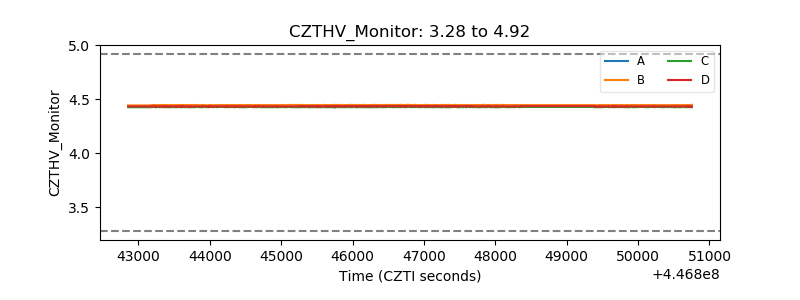 |
| D_VDD | 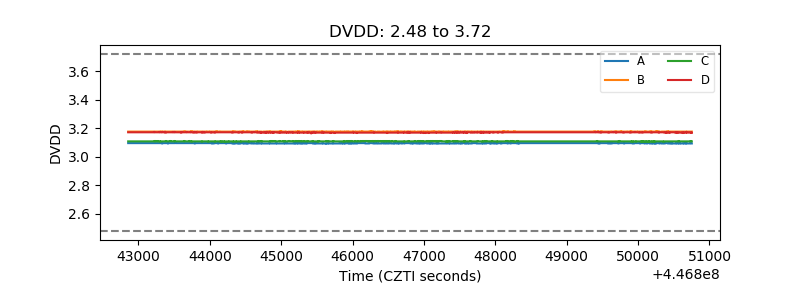 |
| Temperature 1 | 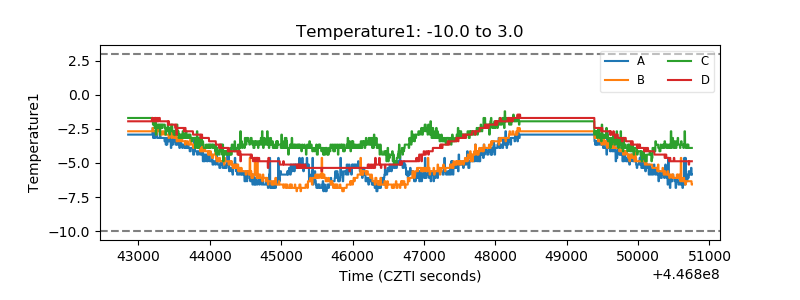 |
| Veto HV Monitor | 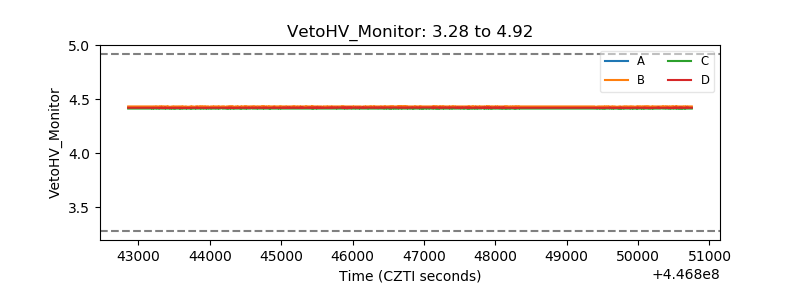 |
| Veto LLD | 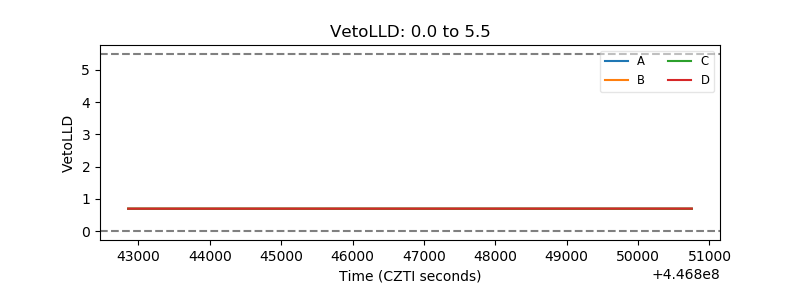 |
| Alpha Counter | 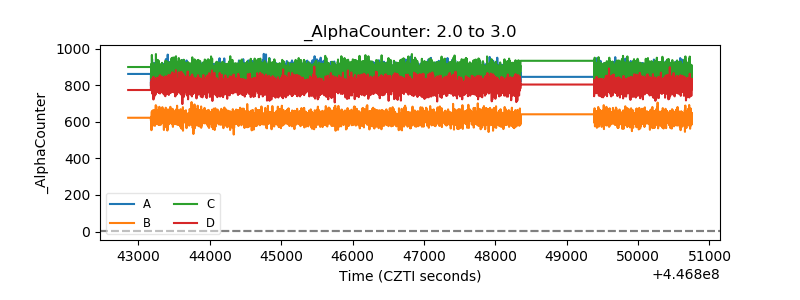 |
| _CPM_Rate | 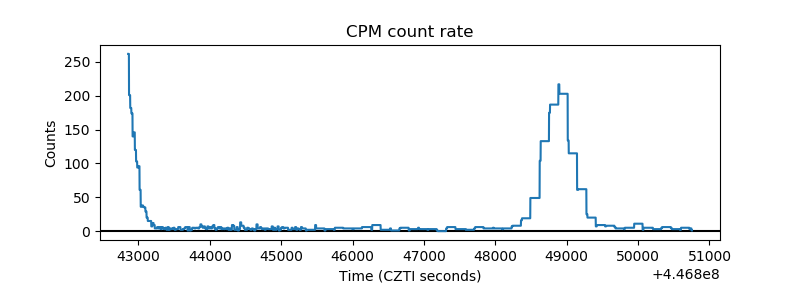 |
| CZT Counter | 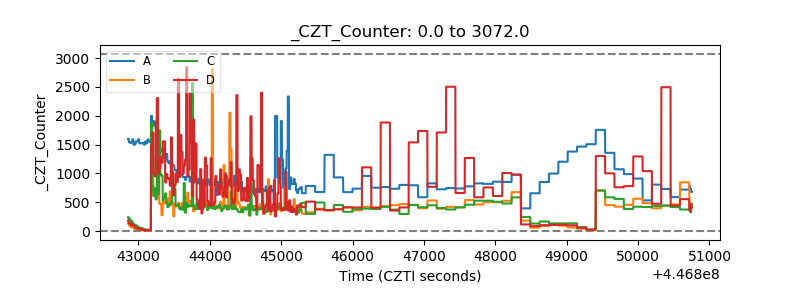 |
| +2.5 Volts monitor | 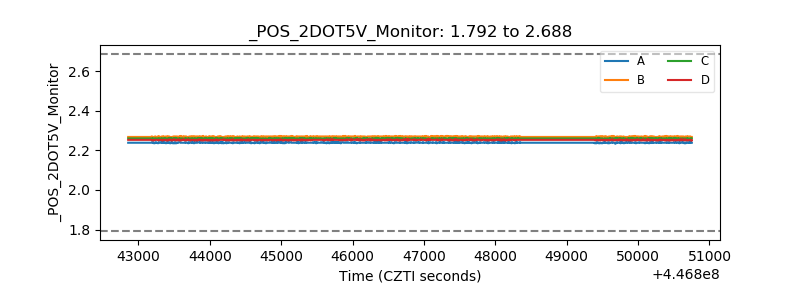 |
| +5 Volts monitor | 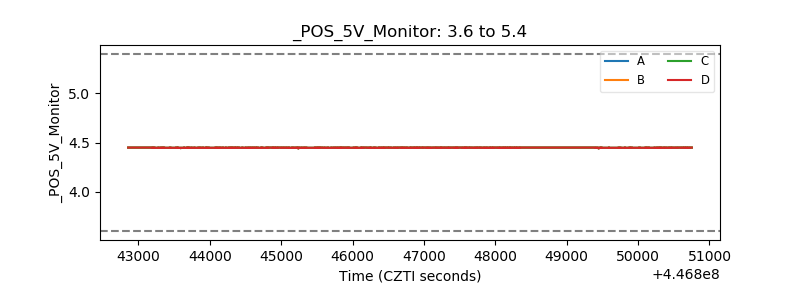 |
| _ROLL_ROT | 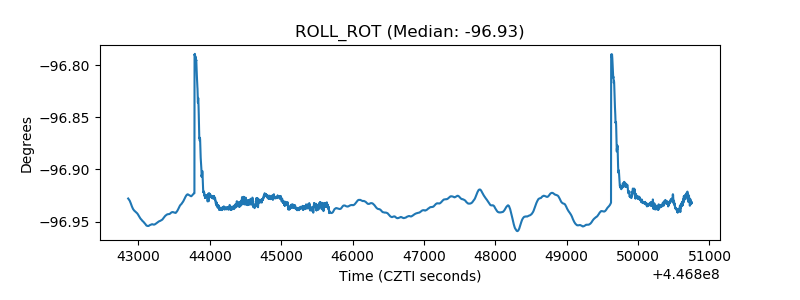 |
| _Roll_DEC | 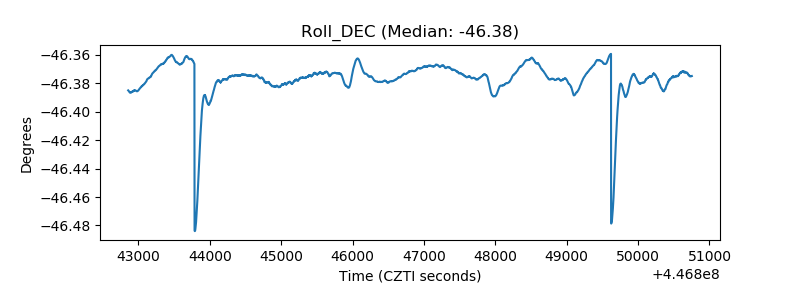 |
| _Roll_RA | 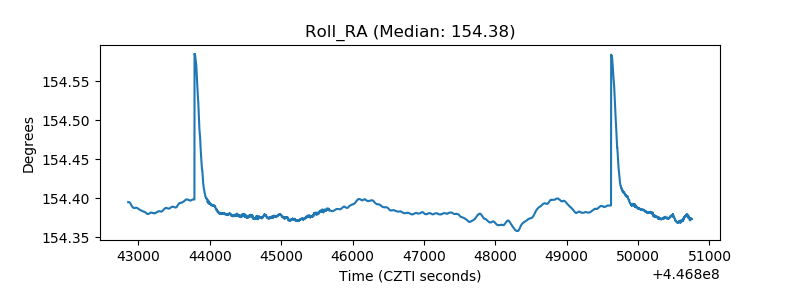 |
| Veto Counter | 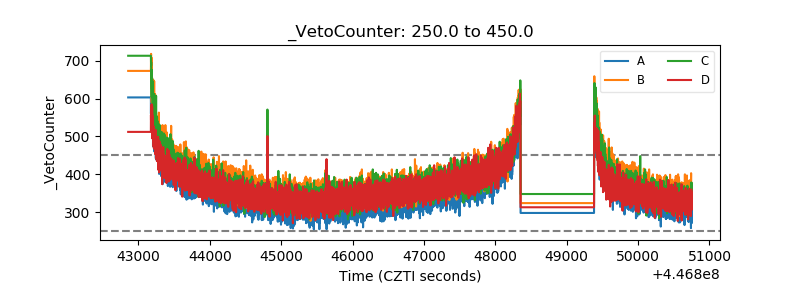 |