| Param | Original file | Final file |
|---|---|---|
| Filename | modeM0/AS1A13_071T01_9000006104_45535cztM0_level2.fits | modeM0/AS1A13_071T01_9000006104_45535cztM0_level2_quad_clean.evt |
| Size (bytes) | 130,515,840 | 28,958,400 |
| Size | 124.5 MB | 27.6 MB |
| Events in quadrant A | 1,599,746 | 188,852 |
| Events in quadrant B | 915,146 | 200,596 |
| Events in quadrant C | 764,103 | 191,324 |
| Events in quadrant D | 1,410,806 | 165,456 |
| Mode SS | |||
|---|---|---|---|
| Quadrant | BADHDUFLAG | Total packets | Discarded packets |
| A | 0 | 36 | 0 |
| B | 0 | 36 | 0 |
| C | 0 | 36 | 0 |
| D | 0 | 36 | 0 |
| Mode M9 | |||
|---|---|---|---|
| Quadrant | BADHDUFLAG | Total packets | Discarded packets |
| A | 0 | 4 | 0 |
| B | 0 | 5 | 0 |
| C | 0 | 5 | 0 |
| D | 0 | 5 | 0 |
| Mode M0 | |||
|---|---|---|---|
| Quadrant | BADHDUFLAG | Total packets | Discarded packets |
| A | 0 | 6097 | 1 |
| B | 0 | 3976 | 1 |
| C | 0 | 3719 | 1 |
| D | 0 | 5478 | 1 |
| Quadrant | Total seconds | Saturated seconds | Saturation percentage |
|---|---|---|---|
| A | 1787 | 88 | 4.924454% |
| B | 1787 | 28 | 1.566872% |
| C | 1787 | 5 | 0.279799% |
| D | 1787 | 120 | 6.715165% |
Noise dominated data is calculated using 1-second bins in cleaned event files. If a bin has >2000 counts, and if more than 50% of those come from <1% of pixels, then it is considered to be noise-dominated and hence unusable.
| Quadrant | # 1 sec bins | Bins with >0 counts | Bins with >2000 counts | High rate bins dominated by noise | Noise dominated (total time) | Noise dominated (detector-on time) | Marked lightcurve |
|---|---|---|---|---|---|---|---|
| A | 1787 | 1787 | 7 | 7 | 0.39% | 0.39% | 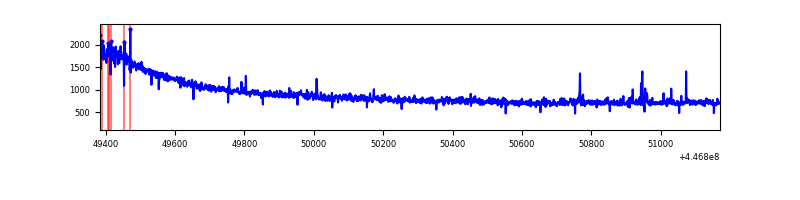 |
| B | 1787 | 1787 | 18 | 18 | 1.01% | 1.01% | 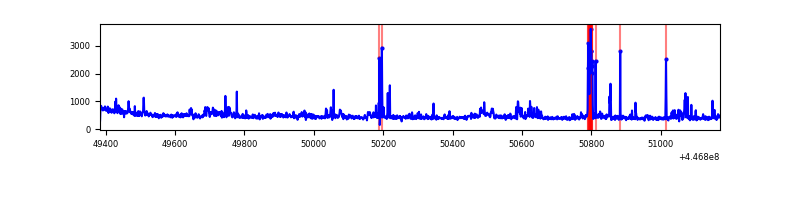 |
| C | 1787 | 1787 | 1 | 1 | 0.06% | 0.06% | 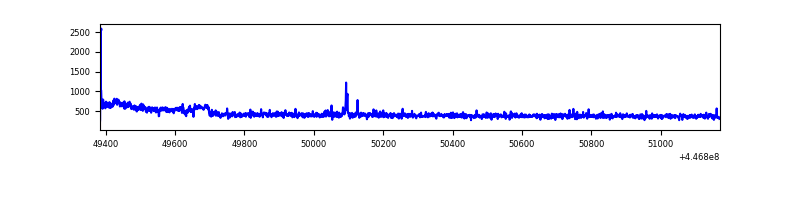 |
| D | 1787 | 1787 | 94 | 94 | 5.26% | 5.26% | 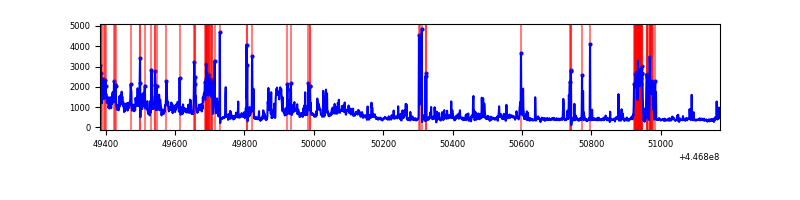 |
Top three noisy pixels from each quadrant. If the there are fewer than three noisy pixels in the level2.evt file, extra rows are filled as -1
| Pixel properties | Quadrant properties | ||||||
|---|---|---|---|---|---|---|---|
| Quadrant | DetID | PixID | Counts | Sigma | Mean | Median | Sigma |
| A | 10 | 83 | 842062 | 20398.01 | 191 | 187 | 41.3 |
| A | 13 | 248 | 14759 | 353.07 | 191 | 187 | 41.3 |
| A | 0 | 243 | 2837 | 64.21 | 191 | 187 | 41.3 |
| B | 5 | 172 | 74116 | 1842.62 | 194 | 188 | 40.1 |
| B | 15 | 201 | 42323 | 1050.19 | 194 | 188 | 40.1 |
| B | 0 | 155 | 12107 | 297.07 | 194 | 188 | 40.1 |
| C | 10 | 187 | 29840 | 648.64 | 186 | 186 | 45.7 |
| C | 12 | 2 | 8541 | 182.76 | 186 | 186 | 45.7 |
| C | 13 | 61 | 1219 | 22.6 | 186 | 186 | 45.7 |
| D | 1 | 52 | 336140 | 7219.43 | 179 | 172 | 46.5 |
| D | 5 | 171 | 163765 | 3515.36 | 179 | 172 | 46.5 |
| D | 2 | 249 | 57897 | 1240.42 | 179 | 172 | 46.5 |
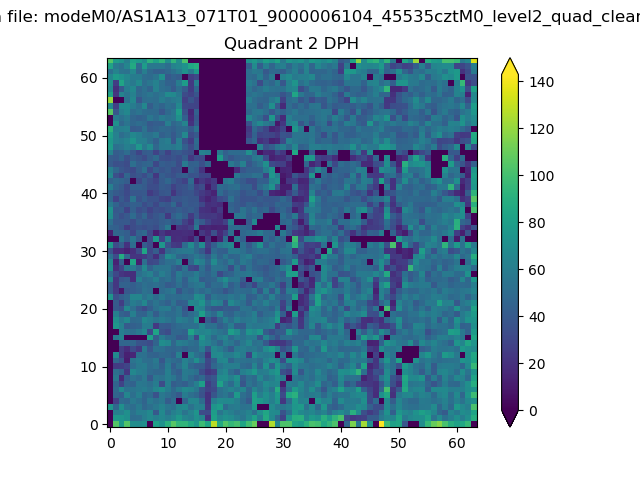
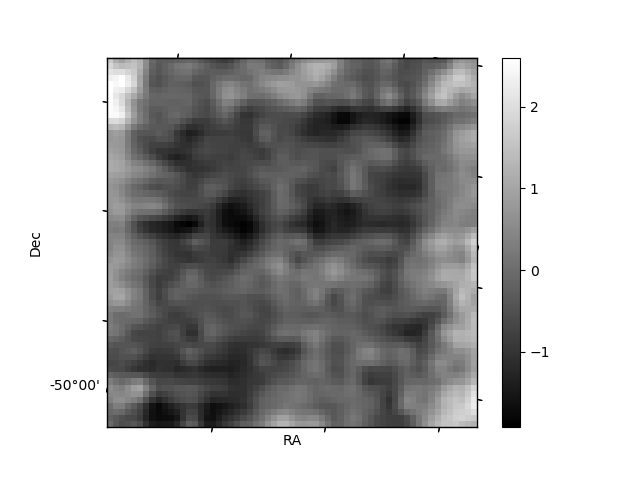
Histogram calculated using DETX and DETY for each event in the final _common_clean file
| Quadrant A | 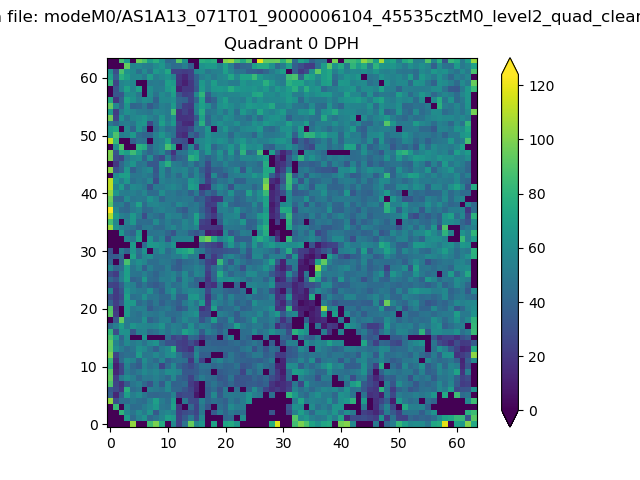 |
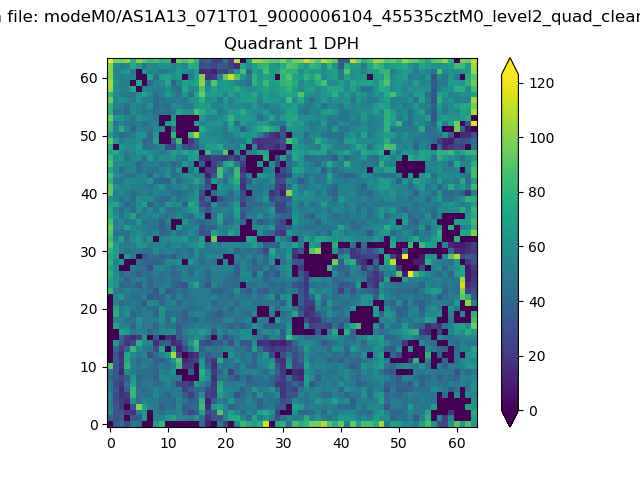 |
Quadrant B |
|---|---|---|---|
| Quadrant D | 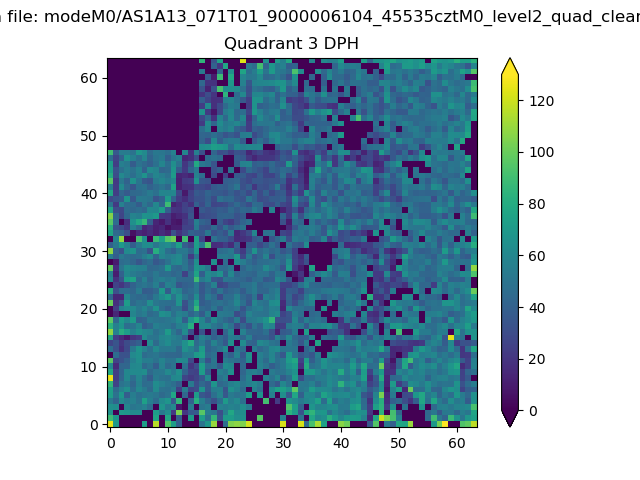 |
 |
Quadrant C |
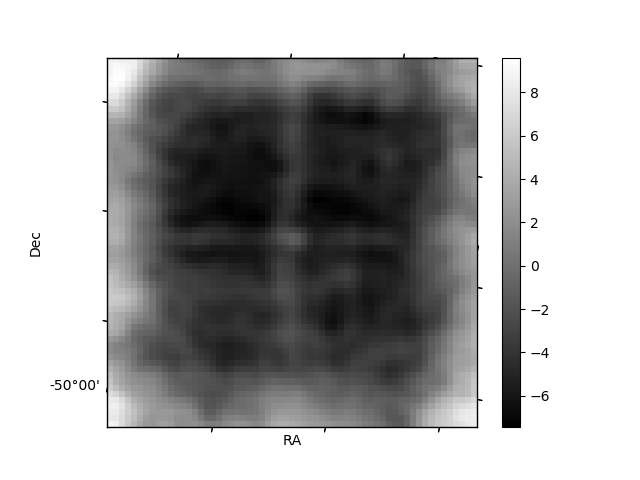
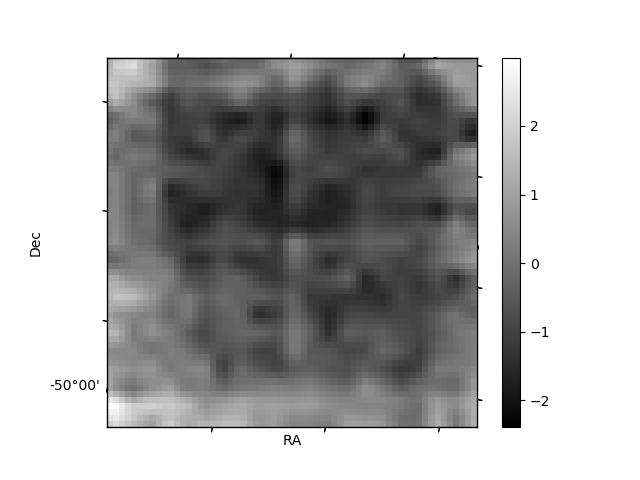
| Plot type | Count rate plots | Images |
|---|---|---|
| Comparison with Poisson distribution Blue bars denote a histogram of data divided into 1 sec bins. Red curve is a Poisson curve with rate = median count rate of data. |
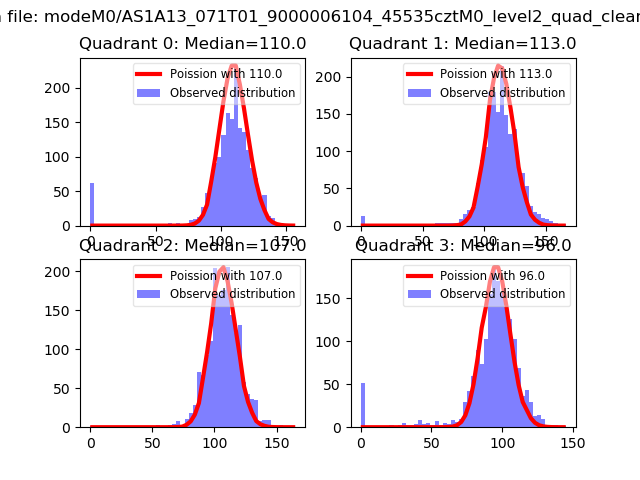 |
 |
| Quadrant-wise count rates Data is divided into 100 sec bins |
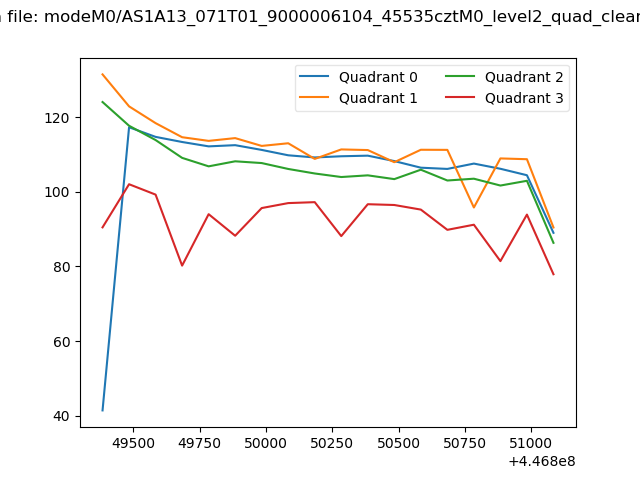 |
|
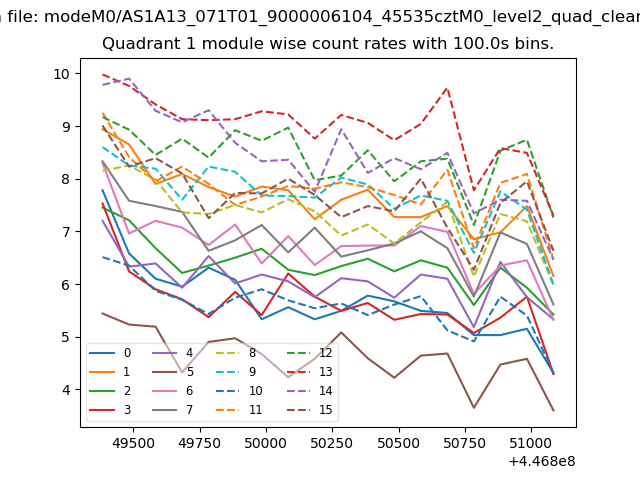
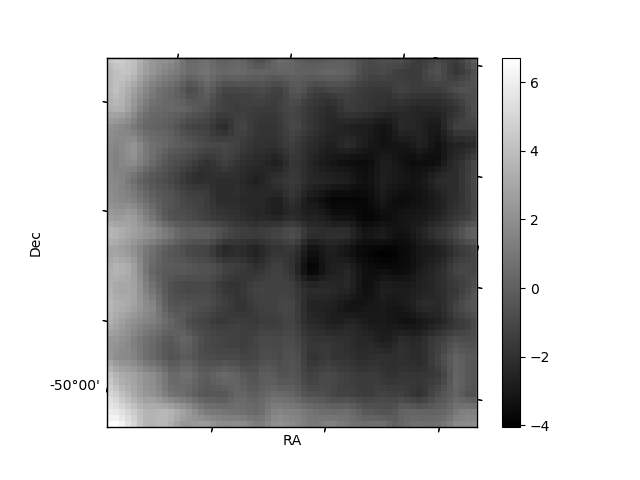
| Module-wise count rates for Quadrant A Data is divided into 100 sec bins |
 |
 |
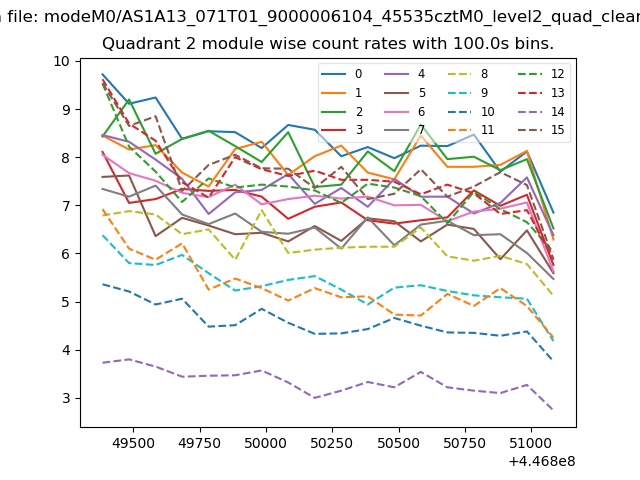
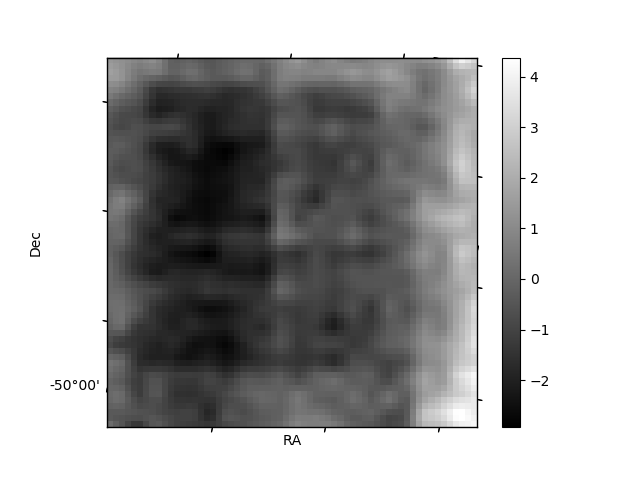
| Module-wise count rates for Quadrant B Data is divided into 100 sec bins |
 |
 |
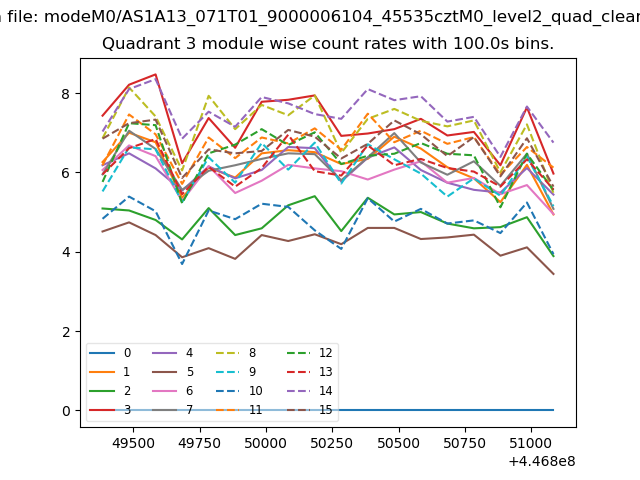
| Module-wise count rates for Quadrant C Data is divided into 100 sec bins |
 |
 |
| Module-wise count rates for Quadrant D Data is divided into 100 sec bins |
 |
 |
| Parameter | Plot |
|---|---|
| CZT HV Monitor |  |
| D_VDD | 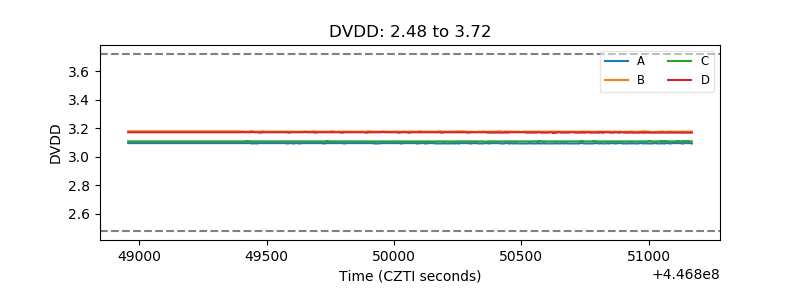 |
| Temperature 1 | 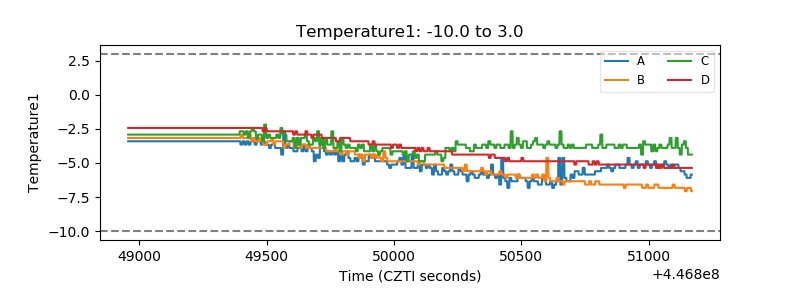 |
| Veto HV Monitor | 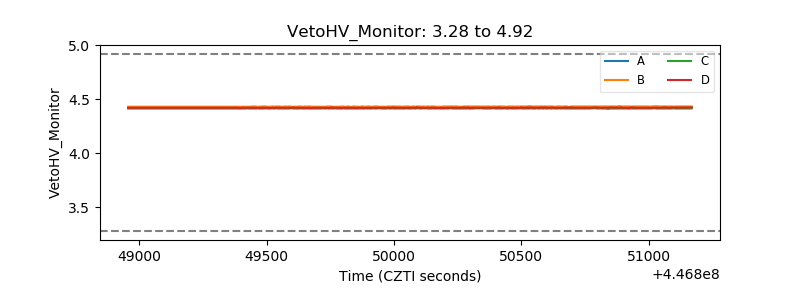 |
| Veto LLD | 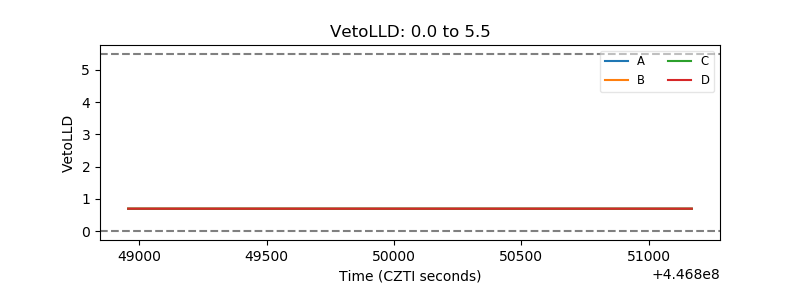 |
| Alpha Counter | 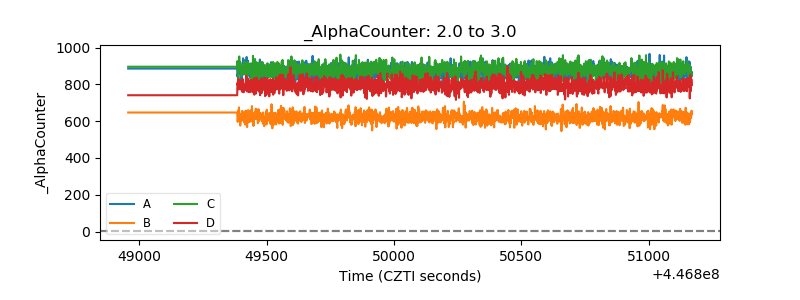 |
| _CPM_Rate | 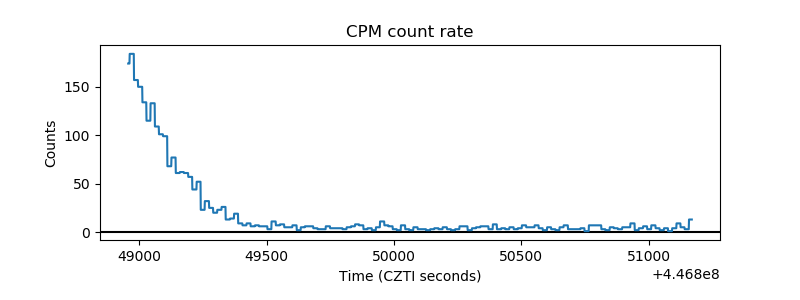 |
| CZT Counter | 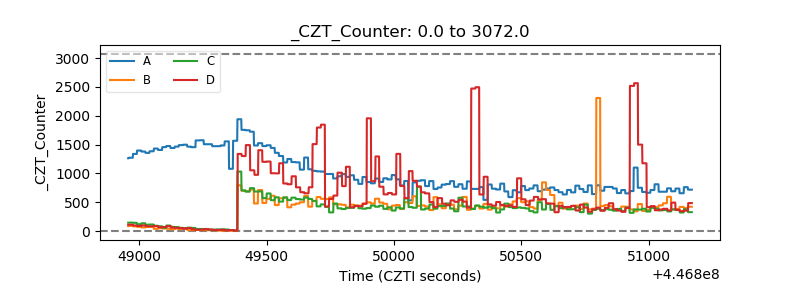 |
| +2.5 Volts monitor | 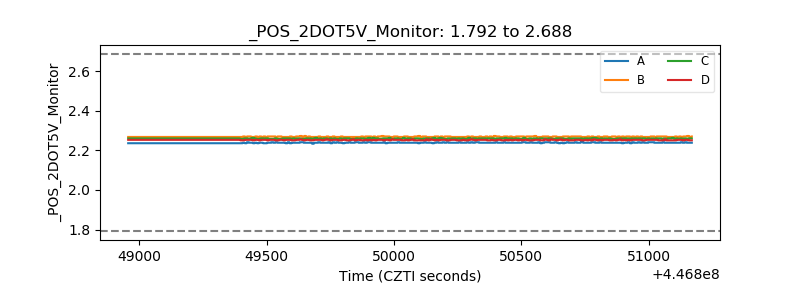 |
| +5 Volts monitor | 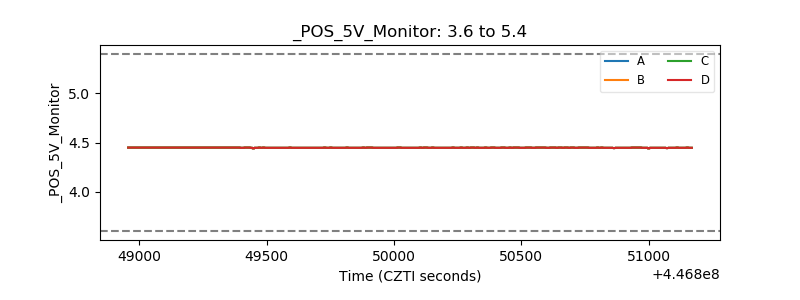 |
| _ROLL_ROT | 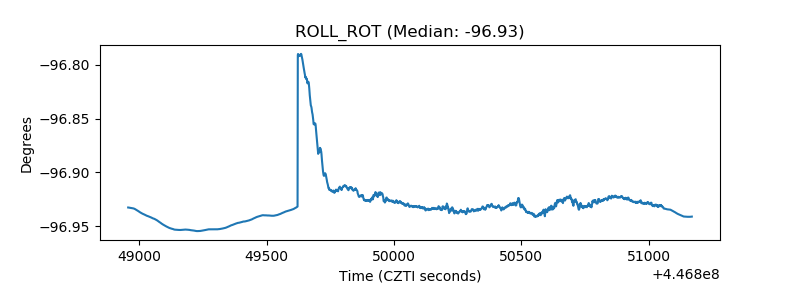 |
| _Roll_DEC | 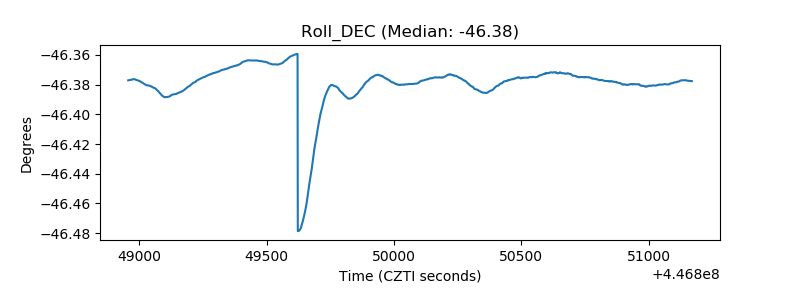 |
| _Roll_RA | 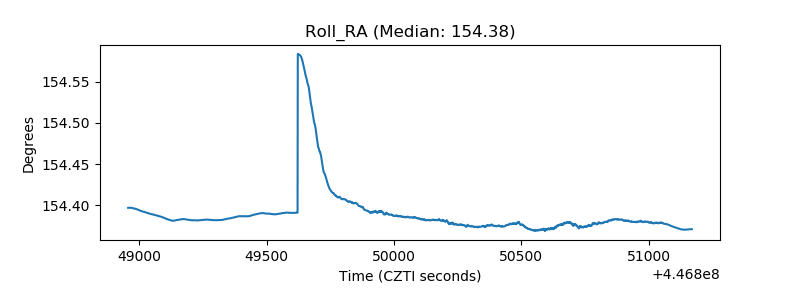 |
| Veto Counter | 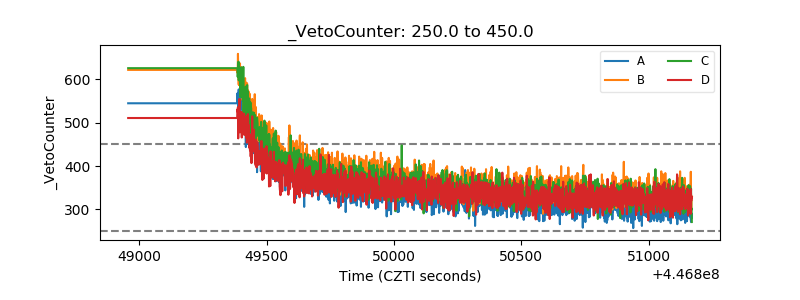 |