| Param | Original file | Final file |
|---|---|---|
| Filename | modeM0/AS1A13_071T02_9000006106_45535cztM0_level2.fits | modeM0/AS1A13_071T02_9000006106_45535cztM0_level2_quad_clean.evt |
| Size (bytes) | 351,504,000 | 65,099,520 |
| Size | 335.2 MB | 62.1 MB |
| Events in quadrant A | 3,586,212 | 441,320 |
| Events in quadrant B | 2,506,886 | 448,932 |
| Events in quadrant C | 2,570,063 | 427,424 |
| Events in quadrant D | 4,027,156 | 362,888 |
| Mode M0 | |||
|---|---|---|---|
| Quadrant | BADHDUFLAG | Total packets | Discarded packets |
| A | 0 | 13499 | 1 |
| B | 0 | 10206 | 1 |
| C | 0 | 10431 | 2 |
| D | 0 | 14791 | 1 |
| Mode SS | |||
|---|---|---|---|
| Quadrant | BADHDUFLAG | Total packets | Discarded packets |
| A | 0 | 84 | 0 |
| B | 0 | 84 | 0 |
| C | 0 | 84 | 0 |
| D | 0 | 84 | 0 |
| Mode M9 | |||
|---|---|---|---|
| Quadrant | BADHDUFLAG | Total packets | Discarded packets |
| A | 0 | 6 | 0 |
| B | 0 | 6 | 0 |
| C | 0 | 6 | 0 |
| D | 0 | 6 | 0 |
| Quadrant | Total seconds | Saturated seconds | Saturation percentage |
|---|---|---|---|
| A | 4122 | 193 | 4.682193% |
| B | 4122 | 271 | 6.574478% |
| C | 4121 | 266 | 6.454744% |
| D | 4121 | 644 | 15.627275% |
Noise dominated data is calculated using 1-second bins in cleaned event files. If a bin has >2000 counts, and if more than 50% of those come from <1% of pixels, then it is considered to be noise-dominated and hence unusable.
| Quadrant | # 1 sec bins | Bins with >0 counts | Bins with >2000 counts | High rate bins dominated by noise | Noise dominated (total time) | Noise dominated (detector-on time) | Marked lightcurve |
|---|---|---|---|---|---|---|---|
| A | 4707 | 4124 | 5 | 5 | 0.11% | 0.12% | 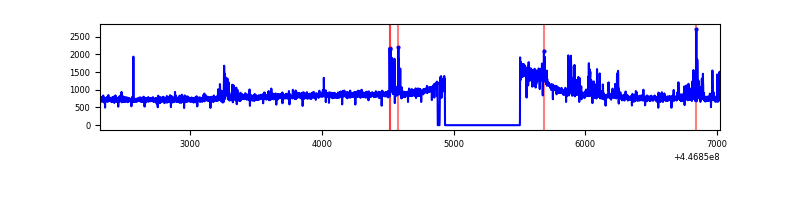 |
| B | 4707 | 4124 | 94 | 94 | 2.00% | 2.28% | 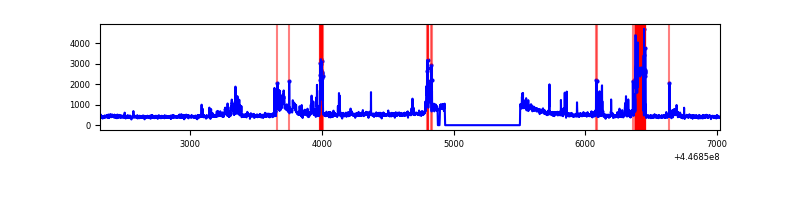 |
| C | 4706 | 4123 | 148 | 148 | 3.14% | 3.59% | 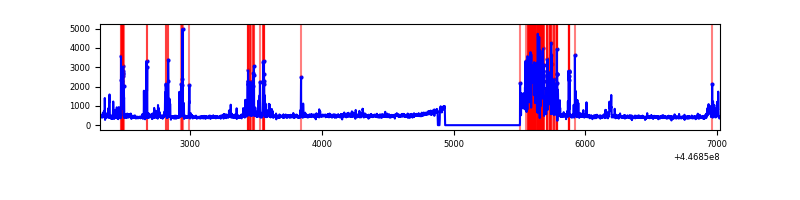 |
| D | 4706 | 4123 | 418 | 418 | 8.88% | 10.14% | 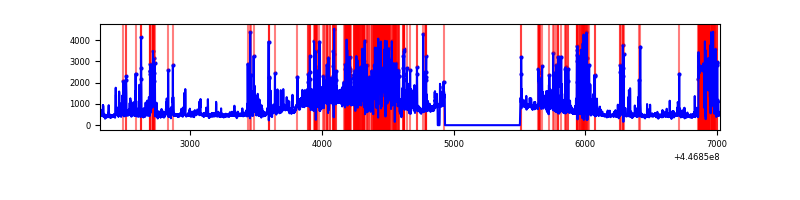 |
Top three noisy pixels from each quadrant. If the there are fewer than three noisy pixels in the level2.evt file, extra rows are filled as -1
| Pixel properties | Quadrant properties | ||||||
|---|---|---|---|---|---|---|---|
| Quadrant | DetID | PixID | Counts | Sigma | Mean | Median | Sigma |
| A | 10 | 83 | 1531007 | 14795.17 | 492 | 482 | 103.4 |
| A | 13 | 248 | 151169 | 1456.65 | 492 | 482 | 103.4 |
| A | 3 | 137 | 5948 | 52.84 | 492 | 482 | 103.4 |
| B | 15 | 201 | 385920 | 3873.34 | 486 | 470 | 99.5 |
| B | 0 | 155 | 70522 | 703.94 | 486 | 470 | 99.5 |
| B | 5 | 172 | 56564 | 563.68 | 486 | 470 | 99.5 |
| C | 12 | 2 | 684834 | 6089.68 | 471 | 473 | 112.4 |
| C | 14 | 254 | 41549 | 365.51 | 471 | 473 | 112.4 |
| C | 2 | 14 | 9104 | 76.8 | 471 | 473 | 112.4 |
| D | 1 | 52 | 1351611 | 11357.08 | 459 | 443 | 119.0 |
| D | 5 | 171 | 269479 | 2261.35 | 459 | 443 | 119.0 |
| D | 13 | 249 | 254496 | 2135.41 | 459 | 443 | 119.0 |
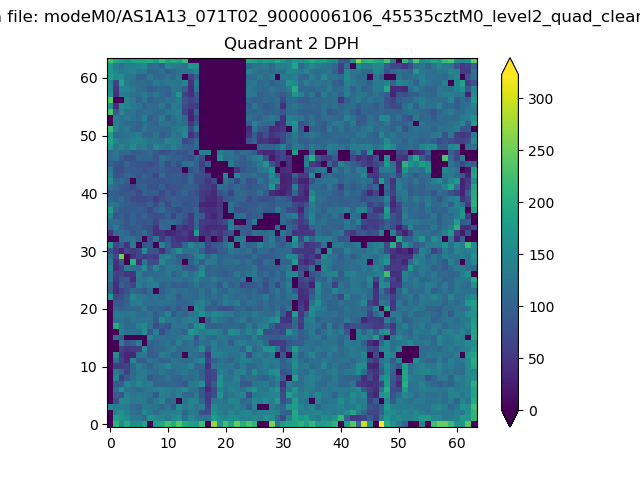
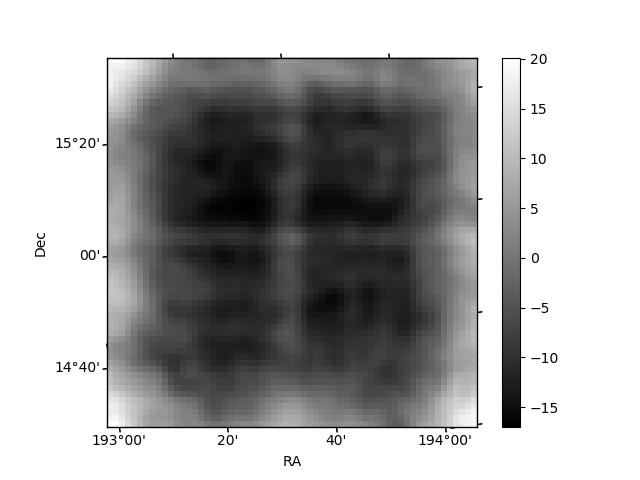
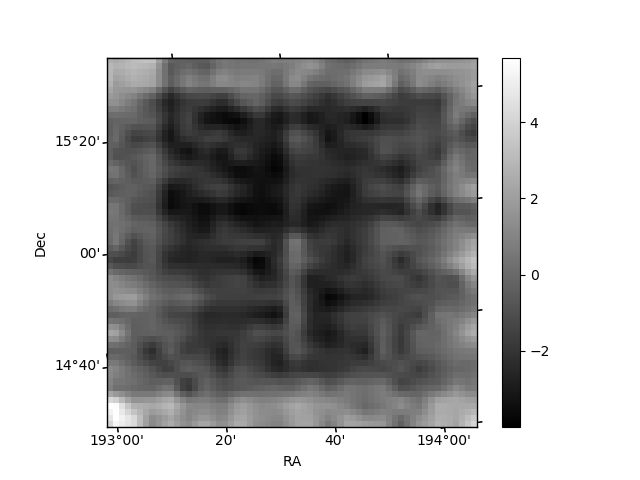
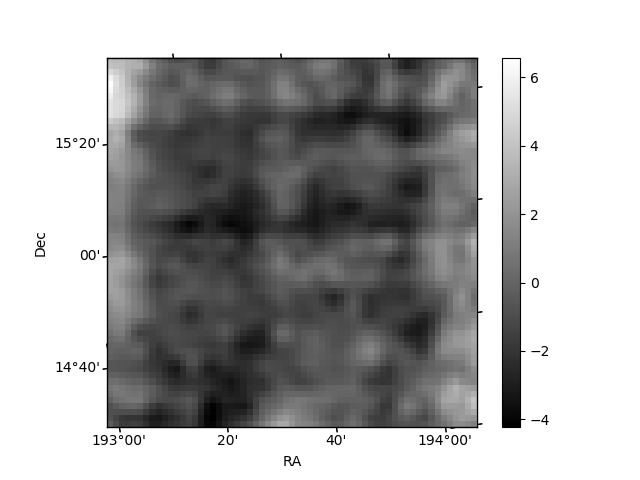
Histogram calculated using DETX and DETY for each event in the final _common_clean file
| Quadrant A | 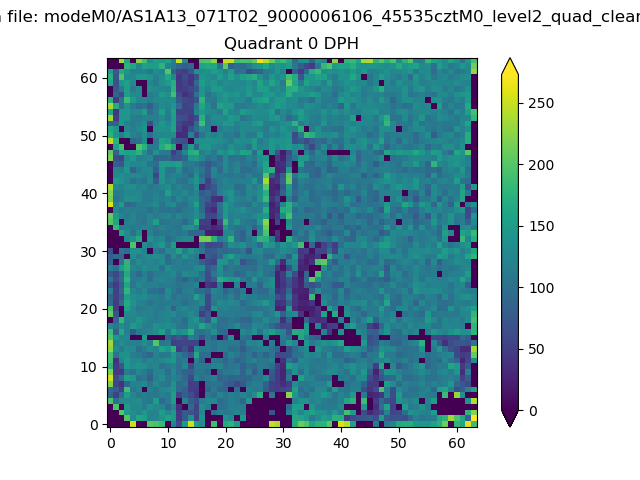 |
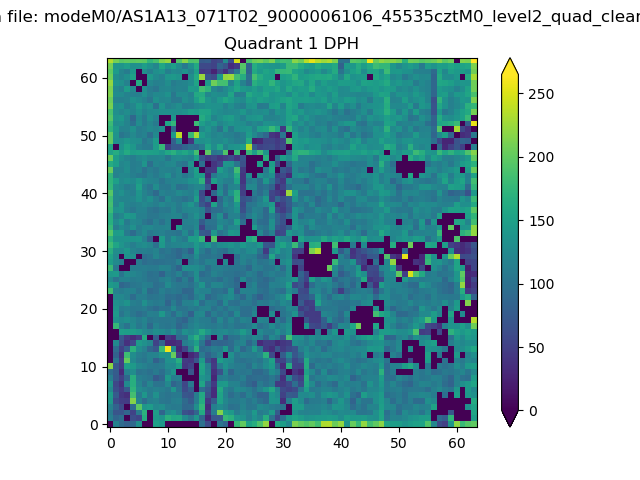 |
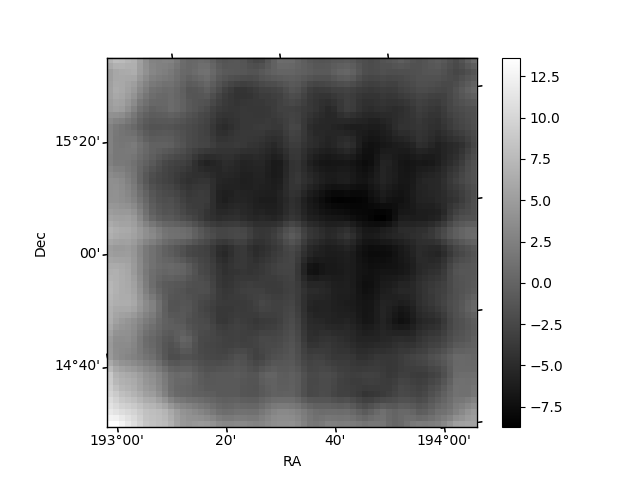
Quadrant B |
|---|---|---|---|
| Quadrant D | 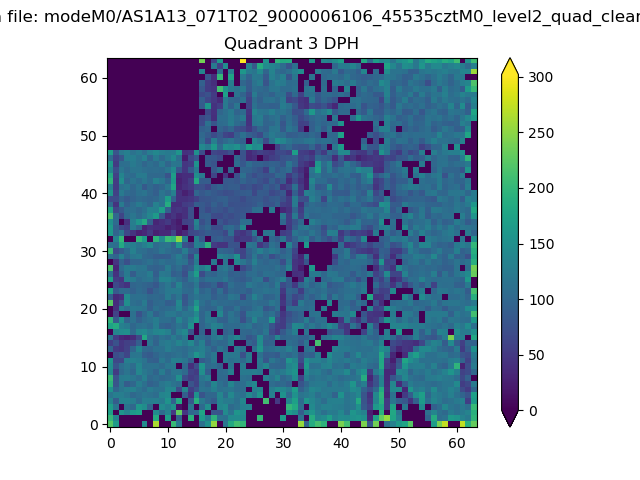 |
 |
Quadrant C |
| Plot type | Count rate plots | Images |
|---|---|---|
| Comparison with Poisson distribution Blue bars denote a histogram of data divided into 1 sec bins. Red curve is a Poisson curve with rate = median count rate of data. |
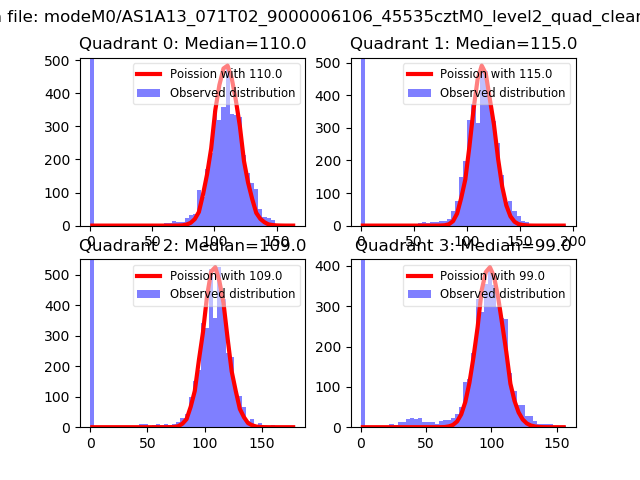 |
 |
| Quadrant-wise count rates Data is divided into 100 sec bins |
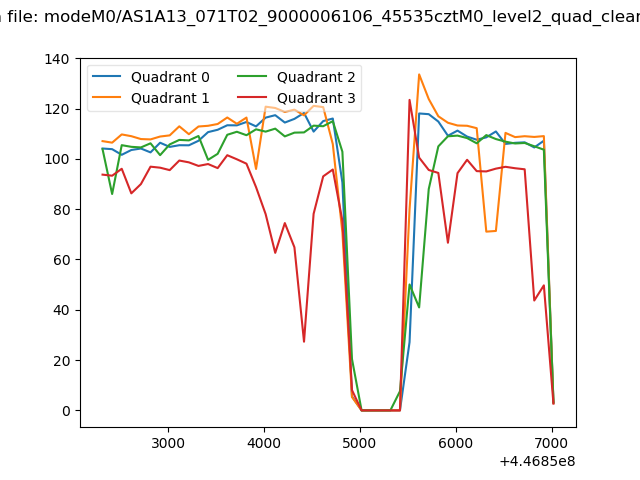 |
|
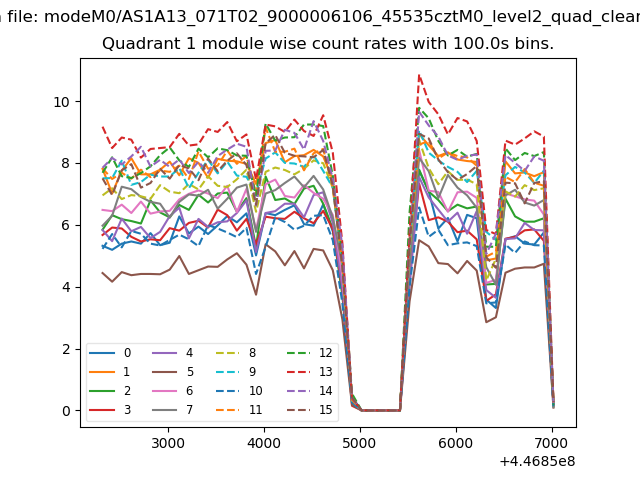
| Module-wise count rates for Quadrant A Data is divided into 100 sec bins |
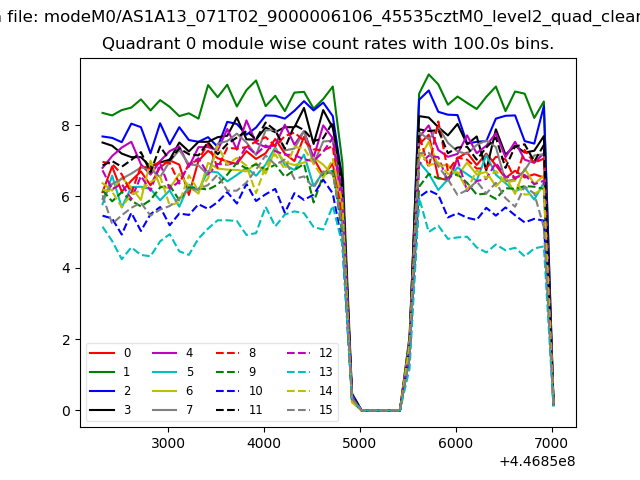 |
 |
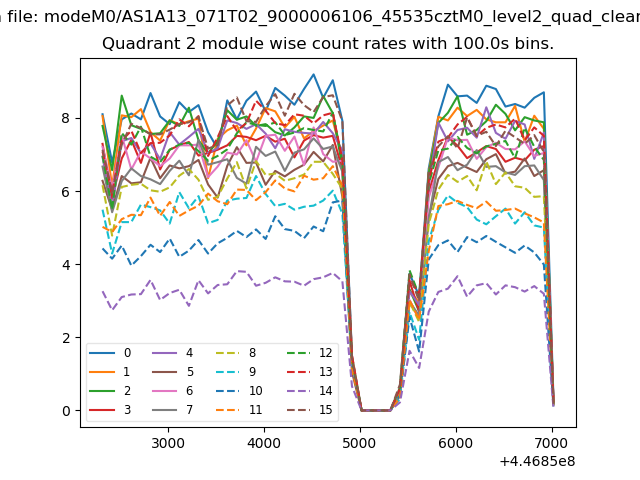
| Module-wise count rates for Quadrant B Data is divided into 100 sec bins |
 |
 |
| Module-wise count rates for Quadrant C Data is divided into 100 sec bins |
 |
 |
| Module-wise count rates for Quadrant D Data is divided into 100 sec bins |
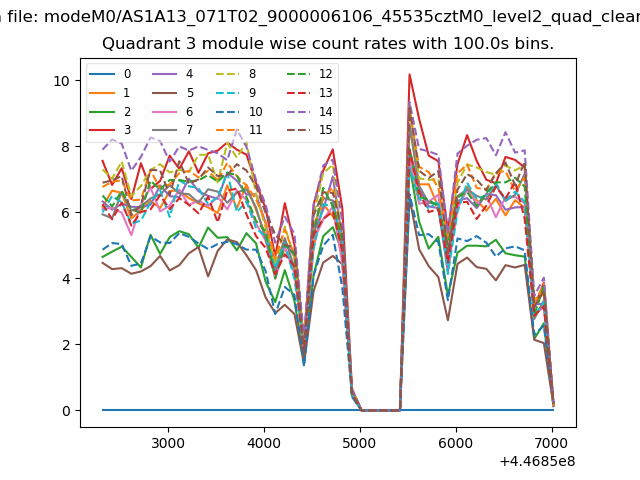 |
 |
| Parameter | Plot |
|---|---|
| CZT HV Monitor | 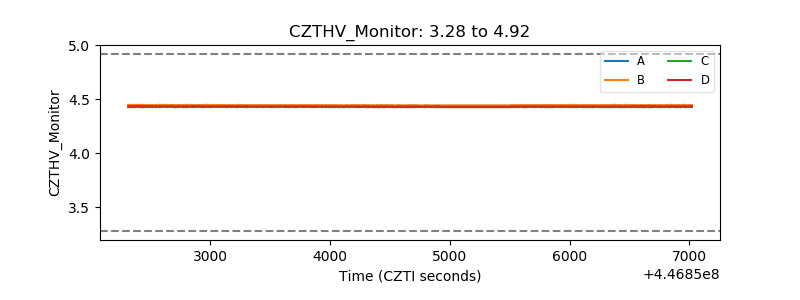 |
| D_VDD | 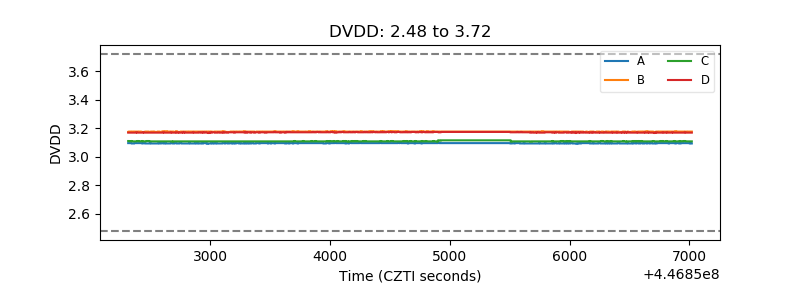 |
| Temperature 1 | 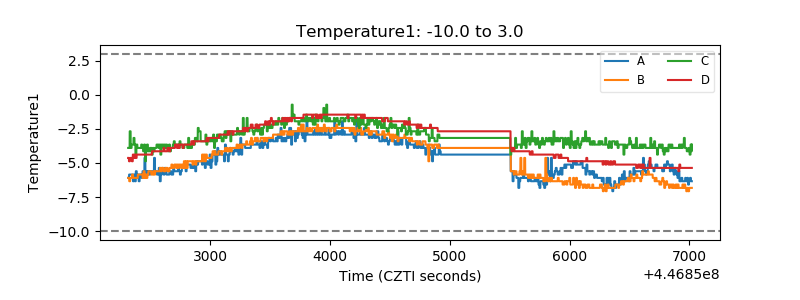 |
| Veto HV Monitor | 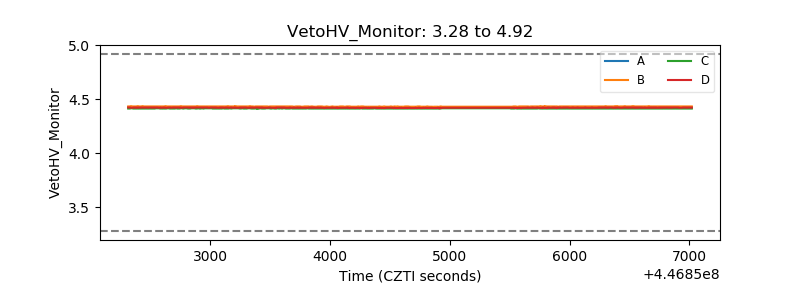 |
| Veto LLD | 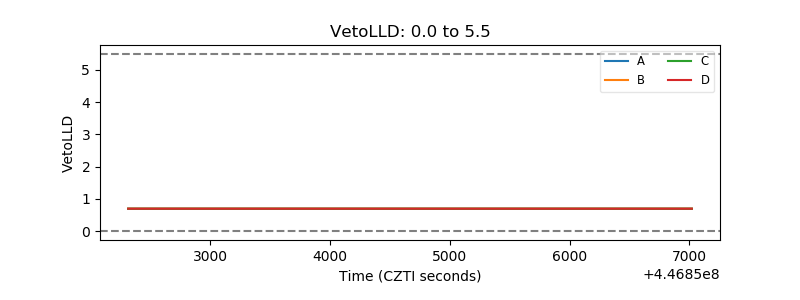 |
| Alpha Counter | 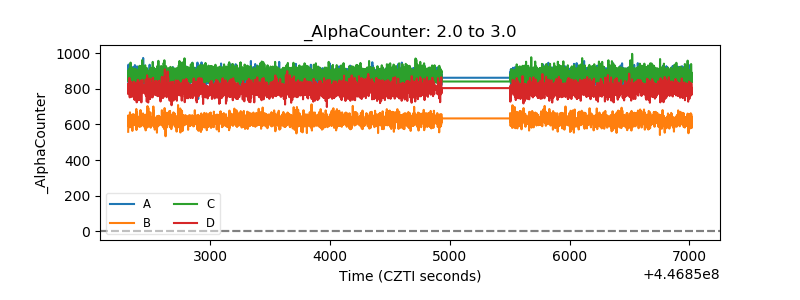 |
| _CPM_Rate | 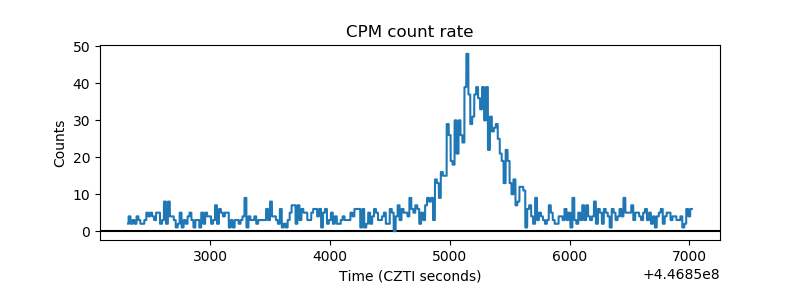 |
| CZT Counter | 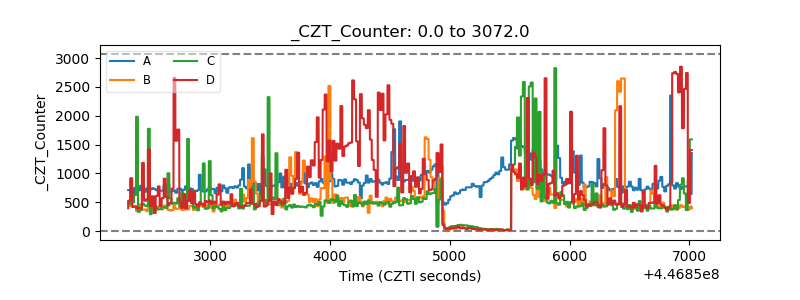 |
| +2.5 Volts monitor | 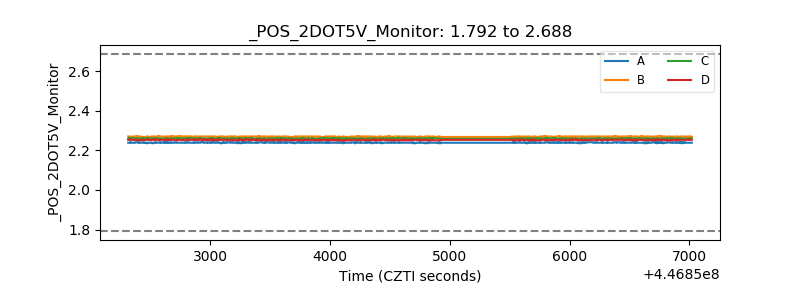 |
| +5 Volts monitor | 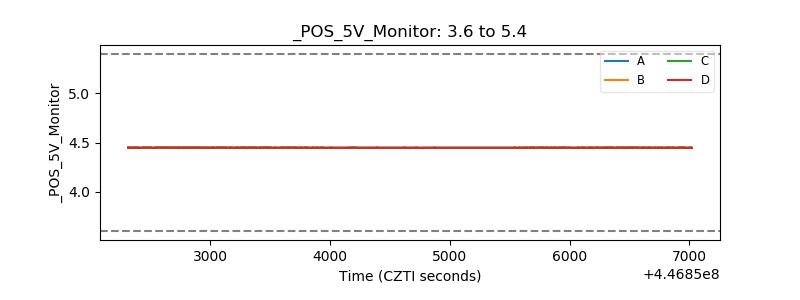 |
| _ROLL_ROT | 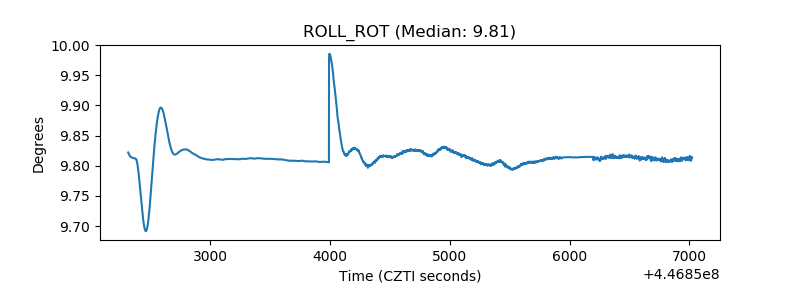 |
| _Roll_DEC | 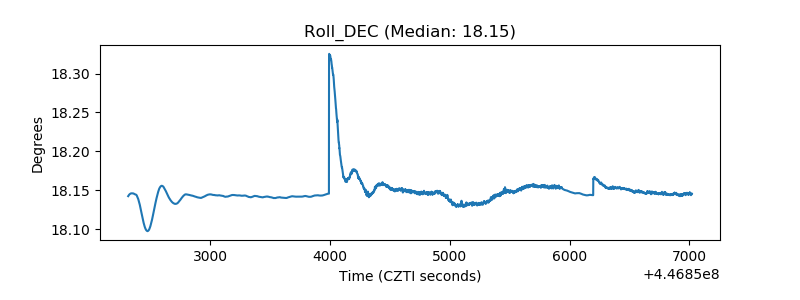 |
| _Roll_RA | 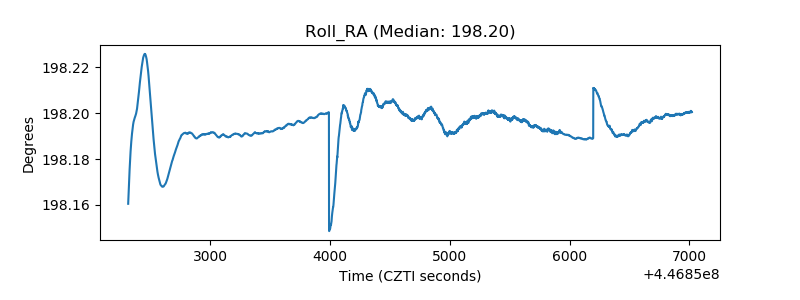 |
| Veto Counter | 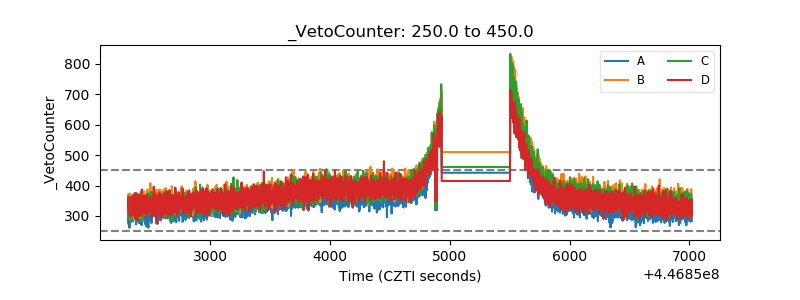 |