| Param | Original file | Final file |
|---|---|---|
| Filename | modeM0/AS1A13_071T02_9000006106_45536cztM0_level2.fits | modeM0/AS1A13_071T02_9000006106_45536cztM0_level2_quad_clean.evt |
| Size (bytes) | 618,442,560 | 124,335,360 |
| Size | 589.8 MB | 118.6 MB |
| Events in quadrant A | 6,743,103 | 837,978 |
| Events in quadrant B | 4,376,105 | 859,885 |
| Events in quadrant C | 4,866,287 | 801,014 |
| Events in quadrant D | 6,297,272 | 718,502 |
| Mode M0 | |||
|---|---|---|---|
| Quadrant | BADHDUFLAG | Total packets | Discarded packets |
| A | 0 | 25512 | 1 |
| B | 0 | 18397 | 1 |
| C | 0 | 20136 | 1 |
| D | 0 | 24288 | 1 |
| Mode SS | |||
|---|---|---|---|
| Quadrant | BADHDUFLAG | Total packets | Discarded packets |
| A | 0 | 158 | 0 |
| B | 0 | 158 | 0 |
| C | 0 | 158 | 0 |
| D | 0 | 158 | 0 |
| Mode M9 | |||
|---|---|---|---|
| Quadrant | BADHDUFLAG | Total packets | Discarded packets |
| A | 0 | 3 | 0 |
| B | 0 | 4 | 0 |
| C | 0 | 4 | 0 |
| D | 0 | 4 | 0 |
| Quadrant | Total seconds | Saturated seconds | Saturation percentage |
|---|---|---|---|
| A | 7871 | 258 | 3.277855% |
| B | 7871 | 283 | 3.595477% |
| C | 7871 | 434 | 5.513912% |
| D | 7871 | 735 | 9.338076% |
Noise dominated data is calculated using 1-second bins in cleaned event files. If a bin has >2000 counts, and if more than 50% of those come from <1% of pixels, then it is considered to be noise-dominated and hence unusable.
| Quadrant | # 1 sec bins | Bins with >0 counts | Bins with >2000 counts | High rate bins dominated by noise | Noise dominated (total time) | Noise dominated (detector-on time) | Marked lightcurve |
|---|---|---|---|---|---|---|---|
| A | 7871 | 7871 | 19 | 19 | 0.24% | 0.24% | 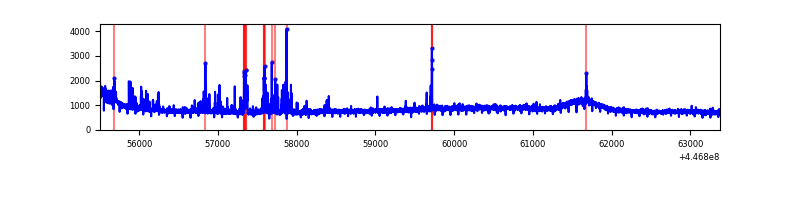 |
| B | 7871 | 7871 | 102 | 102 | 1.30% | 1.30% | 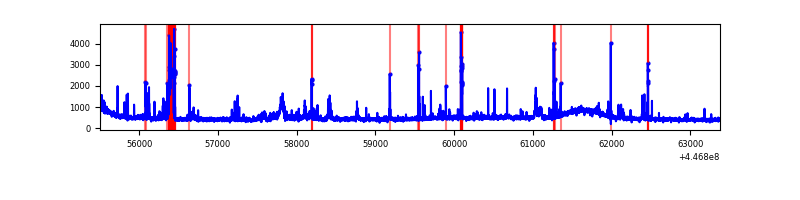 |
| C | 7871 | 7871 | 294 | 294 | 3.74% | 3.74% | 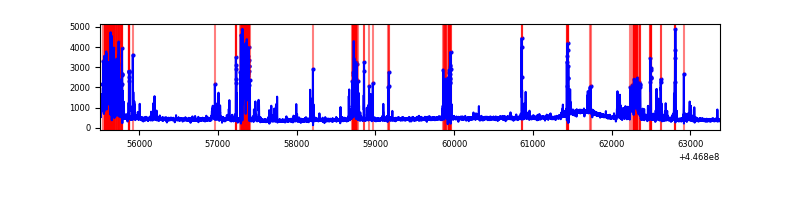 |
| D | 7871 | 7871 | 512 | 512 | 6.50% | 6.50% | 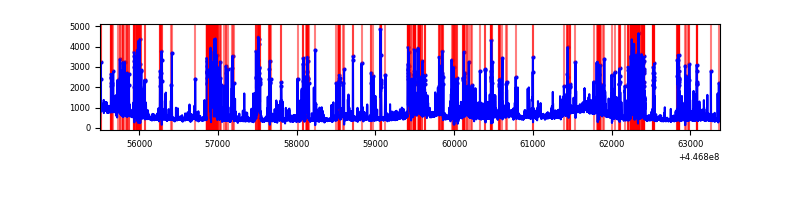 |
Top three noisy pixels from each quadrant. If the there are fewer than three noisy pixels in the level2.evt file, extra rows are filled as -1
| Pixel properties | Quadrant properties | ||||||
|---|---|---|---|---|---|---|---|
| Quadrant | DetID | PixID | Counts | Sigma | Mean | Median | Sigma |
| A | 10 | 83 | 2890610 | 15083.72 | 914 | 894 | 191.6 |
| A | 13 | 248 | 303332 | 1578.66 | 914 | 894 | 191.6 |
| A | 3 | 137 | 11031 | 52.91 | 914 | 894 | 191.6 |
| B | 15 | 201 | 596405 | 3210.69 | 914 | 885 | 185.5 |
| B | 5 | 172 | 48933 | 259.04 | 914 | 885 | 185.5 |
| B | 0 | 183 | 31024 | 162.49 | 914 | 885 | 185.5 |
| C | 12 | 2 | 875860 | 4166.0 | 883 | 890 | 210.0 |
| C | 14 | 254 | 537153 | 2553.31 | 883 | 890 | 210.0 |
| C | 2 | 14 | 9826 | 42.55 | 883 | 890 | 210.0 |
| D | 1 | 52 | 1821658 | 8235.65 | 866 | 839 | 221.1 |
| D | 13 | 249 | 619383 | 2797.71 | 866 | 839 | 221.1 |
| D | 11 | 241 | 138159 | 621.11 | 866 | 839 | 221.1 |
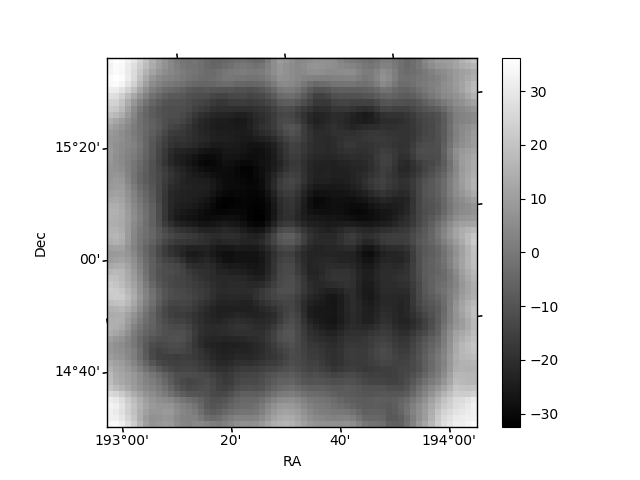
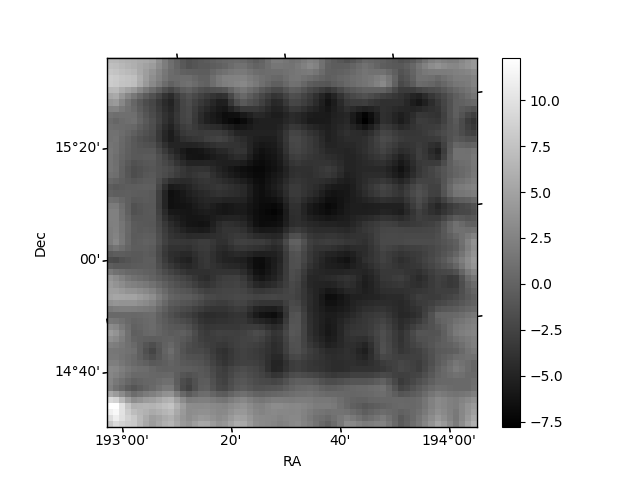
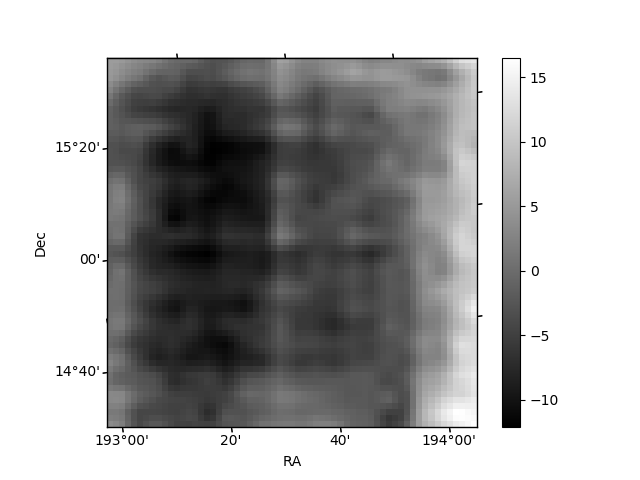
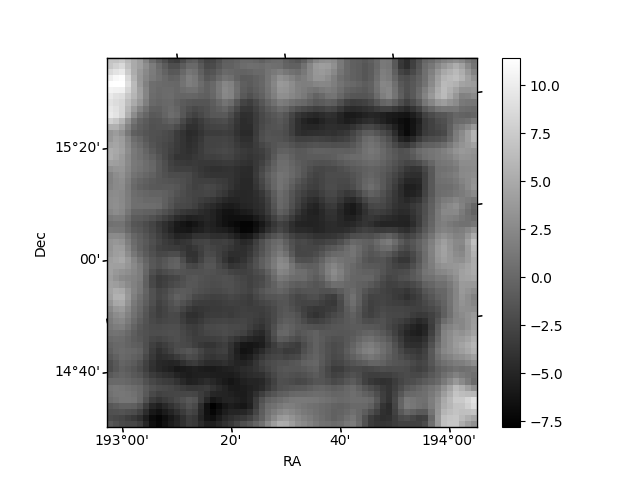
Histogram calculated using DETX and DETY for each event in the final _common_clean file
| Quadrant A | 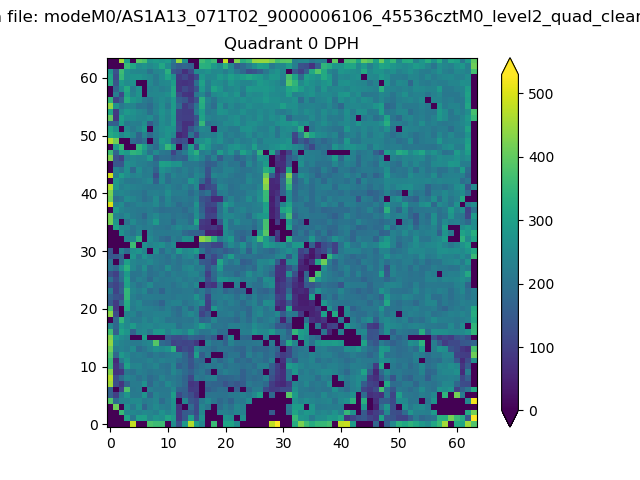 |
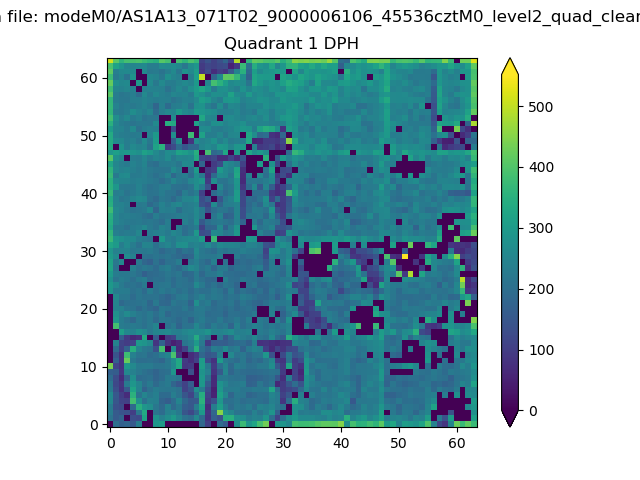 |
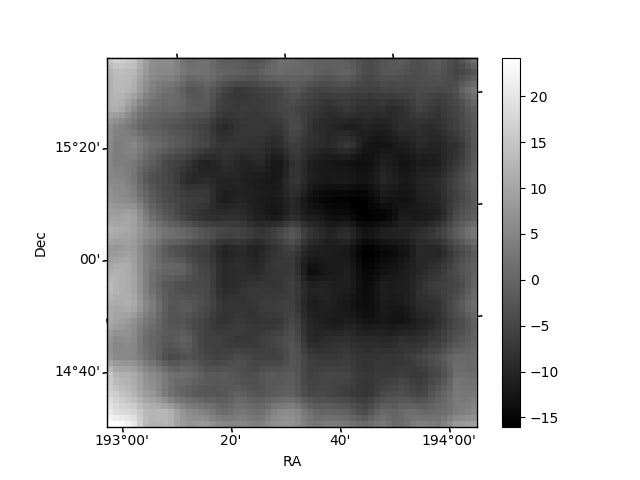
Quadrant B |
|---|---|---|---|
| Quadrant D | 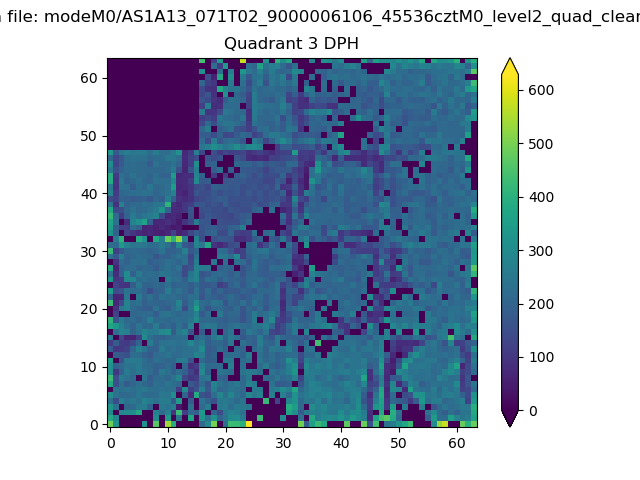 |
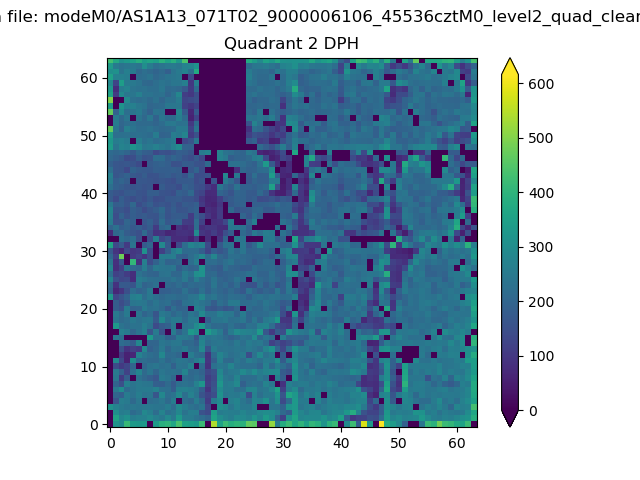 |
Quadrant C |
| Plot type | Count rate plots | Images |
|---|---|---|
| Comparison with Poisson distribution Blue bars denote a histogram of data divided into 1 sec bins. Red curve is a Poisson curve with rate = median count rate of data. |
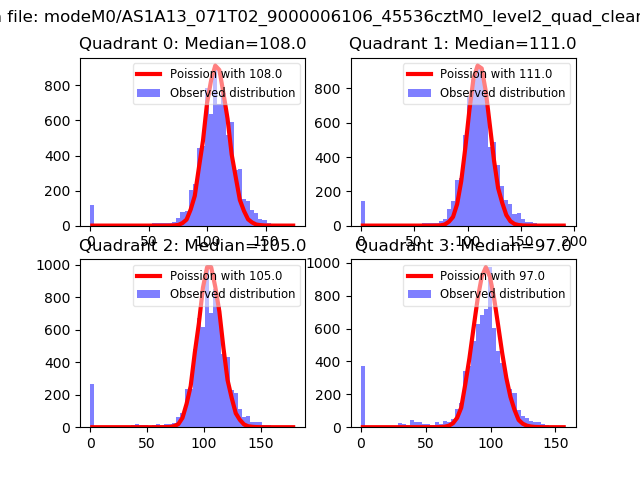 |
 |
| Quadrant-wise count rates Data is divided into 100 sec bins |
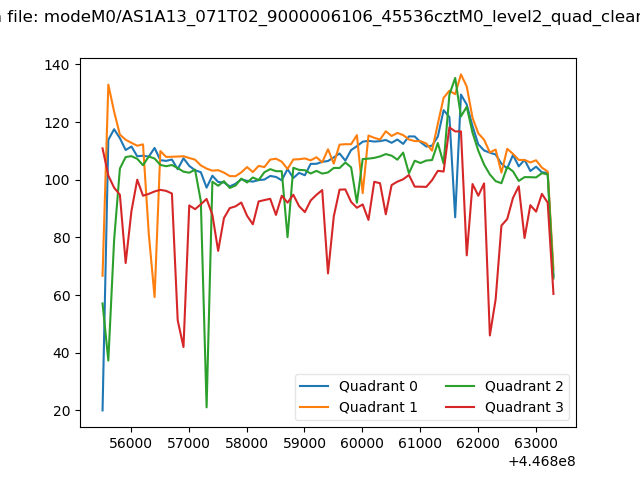 |
|
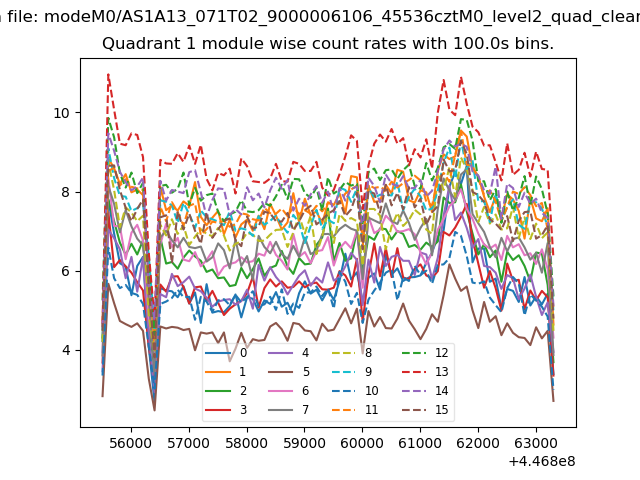
| Module-wise count rates for Quadrant A Data is divided into 100 sec bins |
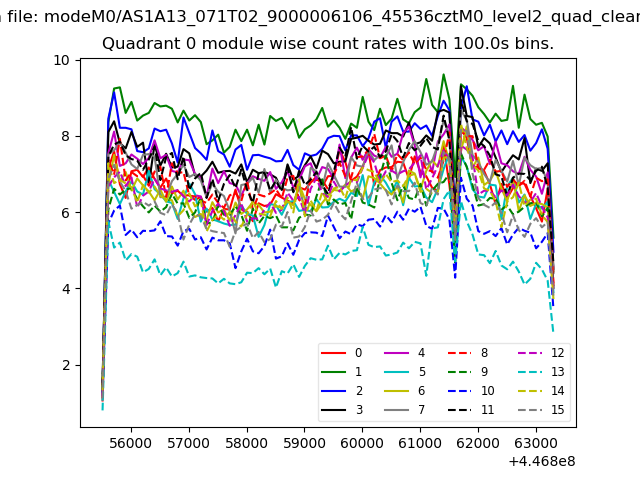 |
 |
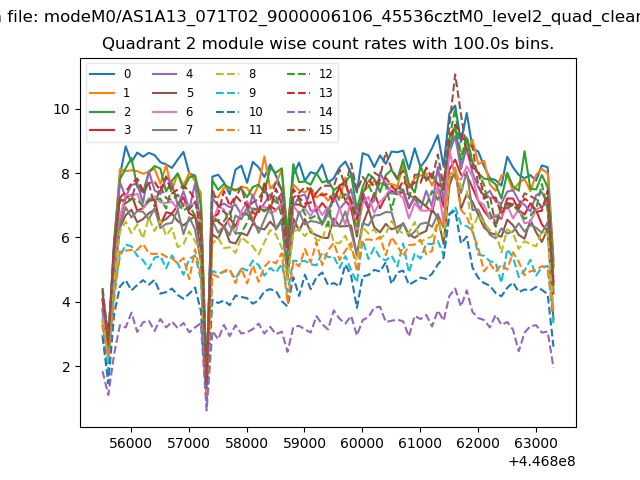
| Module-wise count rates for Quadrant B Data is divided into 100 sec bins |
 |
 |
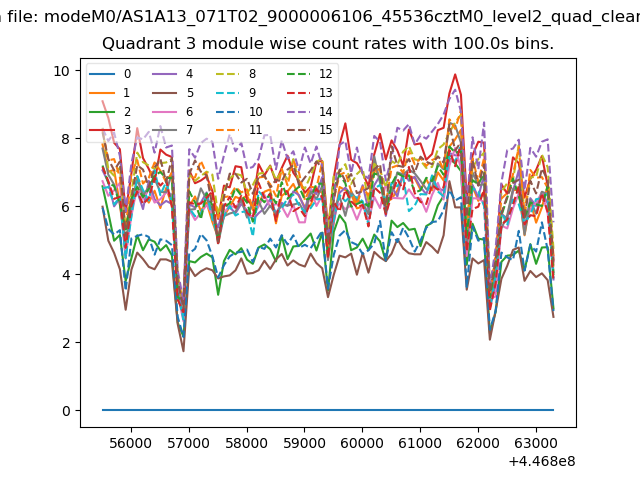
| Module-wise count rates for Quadrant C Data is divided into 100 sec bins |
 |
 |
| Module-wise count rates for Quadrant D Data is divided into 100 sec bins |
 |
 |
| Parameter | Plot |
|---|---|
| CZT HV Monitor | 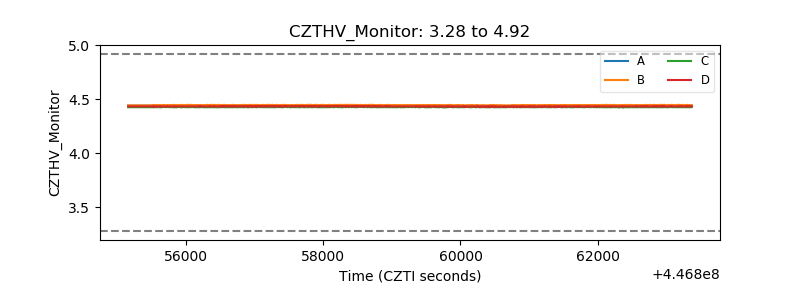 |
| D_VDD | 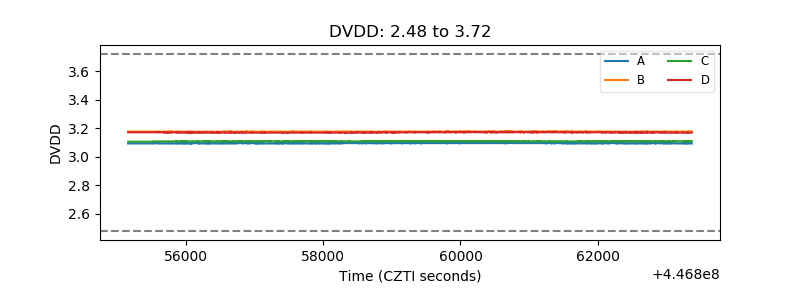 |
| Temperature 1 | 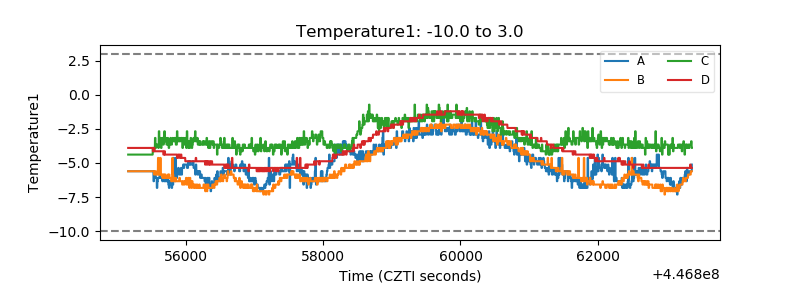 |
| Veto HV Monitor | 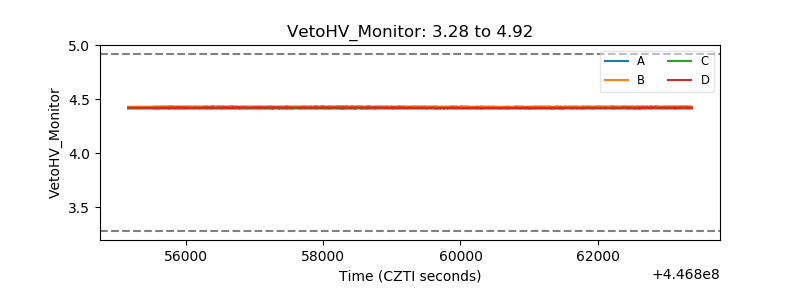 |
| Veto LLD | 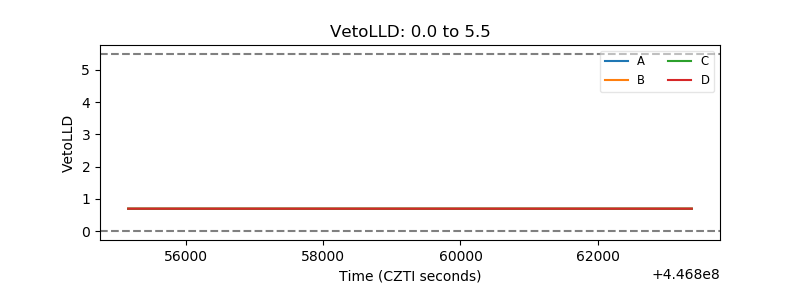 |
| Alpha Counter | 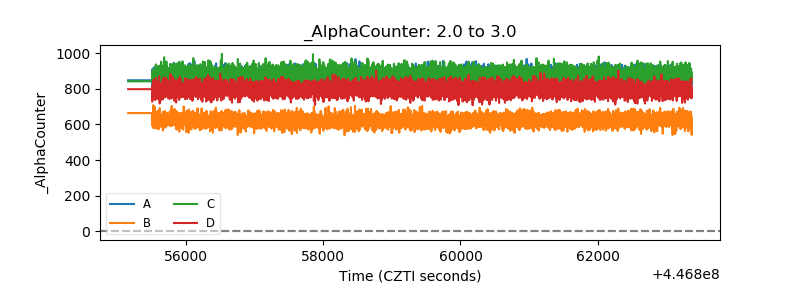 |
| _CPM_Rate | 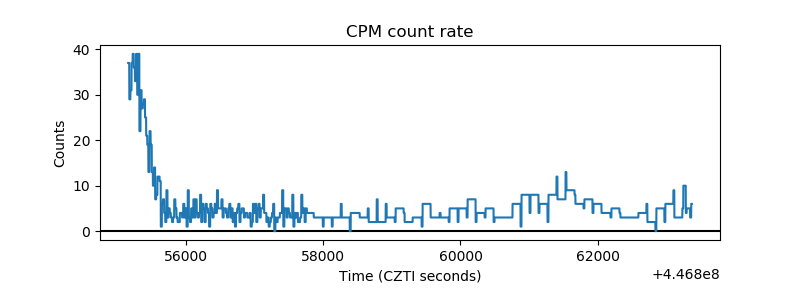 |
| CZT Counter | 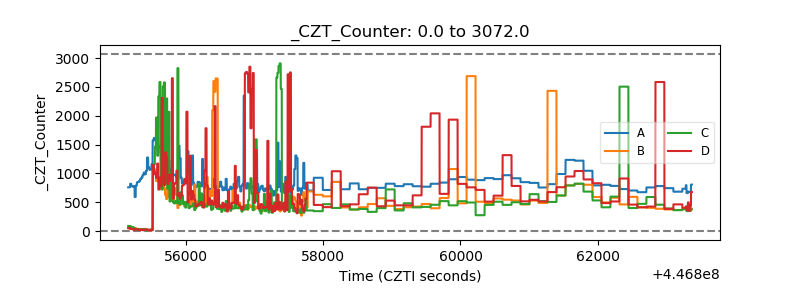 |
| +2.5 Volts monitor |  |
| +5 Volts monitor | 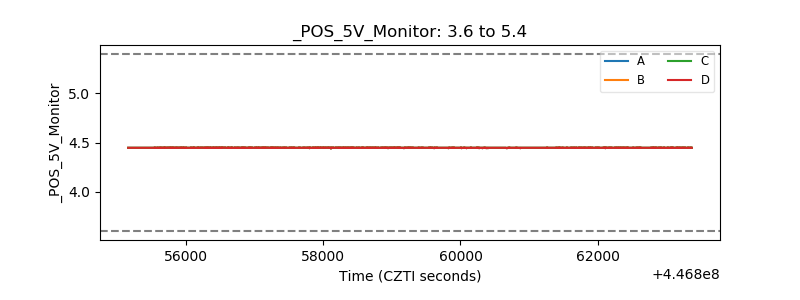 |
| _ROLL_ROT | 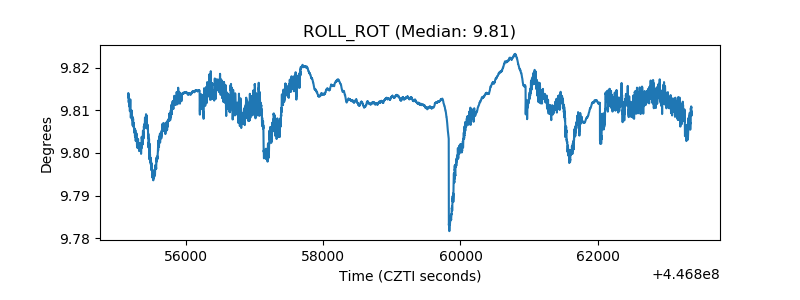 |
| _Roll_DEC | 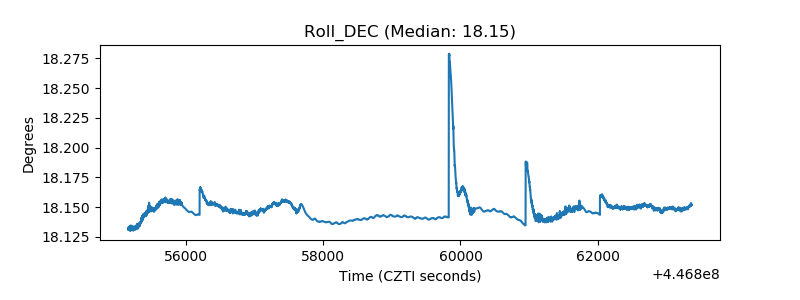 |
| _Roll_RA | 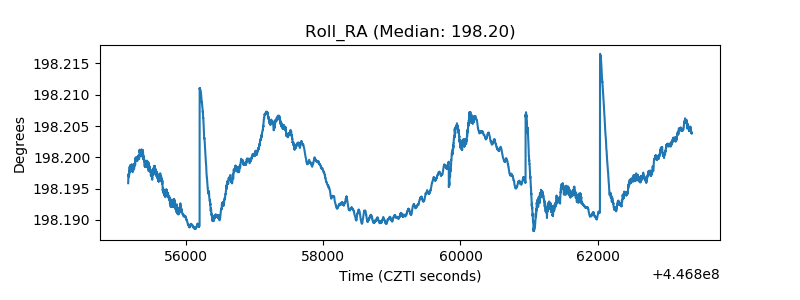 |
| Veto Counter | 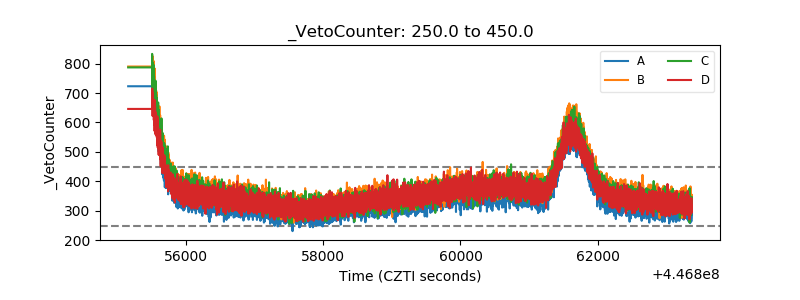 |