| Param | Original file | Final file |
|---|---|---|
| Filename | modeM0/AS1A13_071T02_9000006106_45541cztM0_level2.fits | modeM0/AS1A13_071T02_9000006106_45541cztM0_level2_quad_clean.evt |
| Size (bytes) | 942,897,600 | 213,007,680 |
| Size | 899.2 MB | 203.1 MB |
| Events in quadrant A | 14,804,688 | 1,836,176 |
| Events in quadrant B | 10,744,163 | 1,836,674 |
| Events in quadrant C | 8,305,828 | 1,828,698 |
| Events in quadrant D | 9,623 | 37 |
| Mode M0 | |||
|---|---|---|---|
| Quadrant | BADHDUFLAG | Total packets | Discarded packets |
| A | 0 | 56532 | 5 |
| B | 0 | 44039 | 3 |
| C | 0 | 37835 | 6 |
| D | 0 | 48 | 0 |
| Mode SS | |||
|---|---|---|---|
| Quadrant | BADHDUFLAG | Total packets | Discarded packets |
| A | 0 | 362 | 0 |
| B | 0 | 362 | 0 |
| C | 0 | 362 | 0 |
| D | 0 | 362 | 0 |
| Mode M9 | |||
|---|---|---|---|
| Quadrant | BADHDUFLAG | Total packets | Discarded packets |
| A | 0 | 17 | 0 |
| B | 0 | 17 | 0 |
| C | 0 | 17 | 0 |
| D | 0 | 17 | 0 |
| Quadrant | Total seconds | Saturated seconds | Saturation percentage |
|---|---|---|---|
| A | 17899 | 575 | 3.212470% |
| B | 17899 | 932 | 5.206995% |
| C | 17897 | 282 | 1.575683% |
| D | 24 | 0 | 0.000000% |
Noise dominated data is calculated using 1-second bins in cleaned event files. If a bin has >2000 counts, and if more than 50% of those come from <1% of pixels, then it is considered to be noise-dominated and hence unusable.
| Quadrant | # 1 sec bins | Bins with >0 counts | Bins with >2000 counts | High rate bins dominated by noise | Noise dominated (total time) | Noise dominated (detector-on time) | Marked lightcurve |
|---|---|---|---|---|---|---|---|
| A | 19529 | 17903 | 56 | 56 | 0.29% | 0.31% | 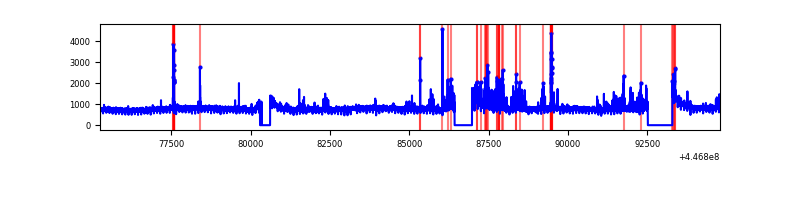 |
| B | 19529 | 17903 | 355 | 355 | 1.82% | 1.98% | 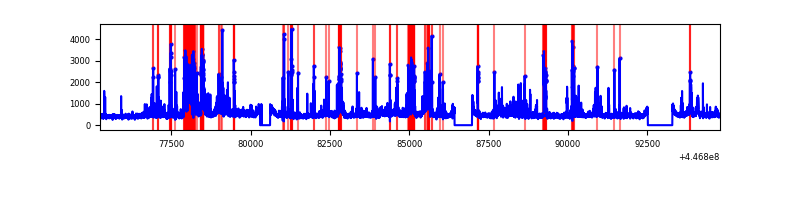 |
| C | 19529 | 17902 | 68 | 68 | 0.35% | 0.38% | 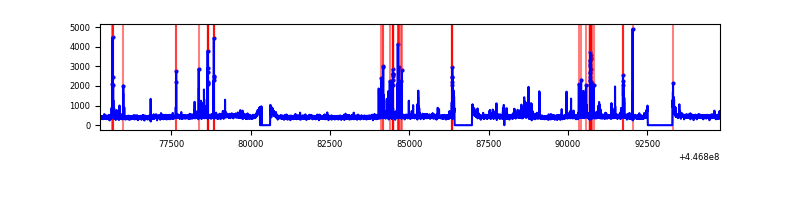 |
| D | 24 | 24 | 0 | 0 | 0.00% | 0.00% |  |
Top three noisy pixels from each quadrant. If the there are fewer than three noisy pixels in the level2.evt file, extra rows are filled as -1
| Pixel properties | Quadrant properties | ||||||
|---|---|---|---|---|---|---|---|
| Quadrant | DetID | PixID | Counts | Sigma | Mean | Median | Sigma |
| A | 10 | 83 | 6420065 | 15529.51 | 2001 | 1954 | 413.3 |
| A | 13 | 248 | 524713 | 1264.89 | 2001 | 1954 | 413.3 |
| A | 15 | 174 | 87921 | 208.01 | 2001 | 1954 | 413.3 |
| B | 15 | 201 | 1636958 | 4130.56 | 1977 | 1913 | 395.8 |
| B | 0 | 183 | 415990 | 1046.07 | 1977 | 1913 | 395.8 |
| B | 5 | 172 | 355550 | 893.38 | 1977 | 1913 | 395.8 |
| C | 14 | 254 | 330624 | 706.2 | 1976 | 1981 | 465.4 |
| C | 12 | 2 | 259825 | 554.06 | 1976 | 1981 | 465.4 |
| C | 3 | 233 | 20746 | 40.32 | 1976 | 1981 | 465.4 |
| D | 11 | 241 | 412 | 299.14 | 2 | 2 | 1.4 |
| D | 2 | 234 | 138 | 99.23 | 2 | 2 | 1.4 |
| D | 2 | 249 | 135 | 97.04 | 2 | 2 | 1.4 |
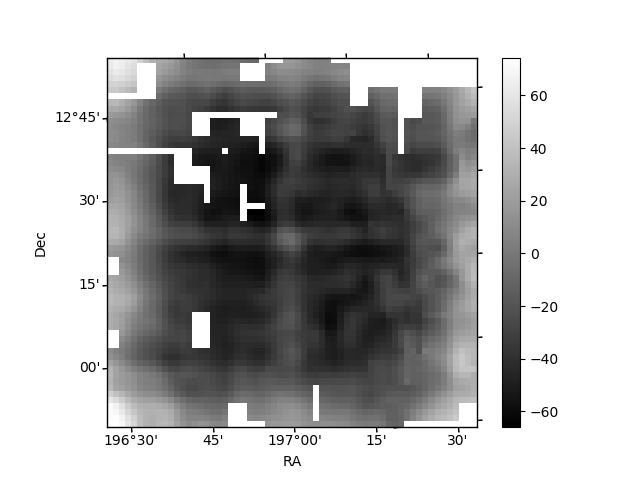
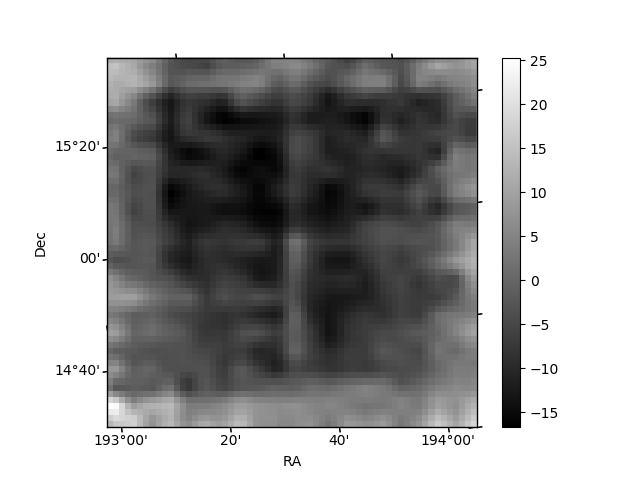
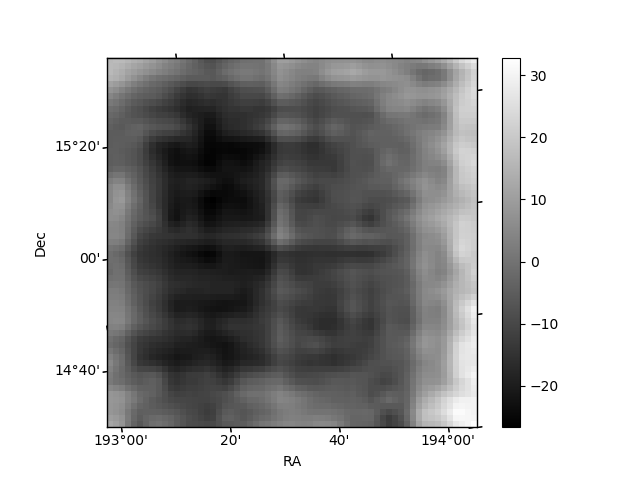
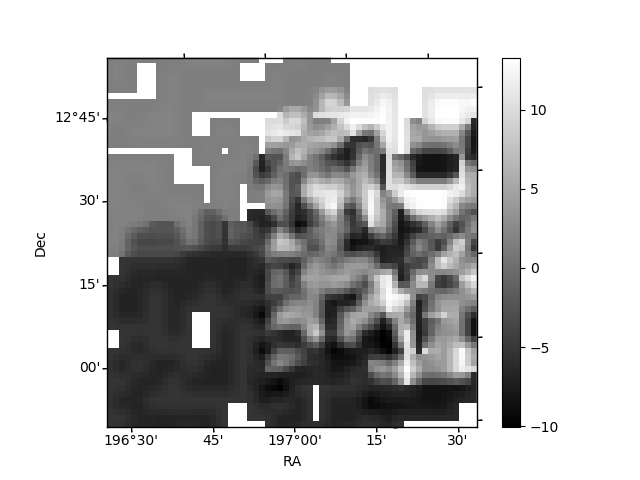
Histogram calculated using DETX and DETY for each event in the final _common_clean file
| Quadrant A | 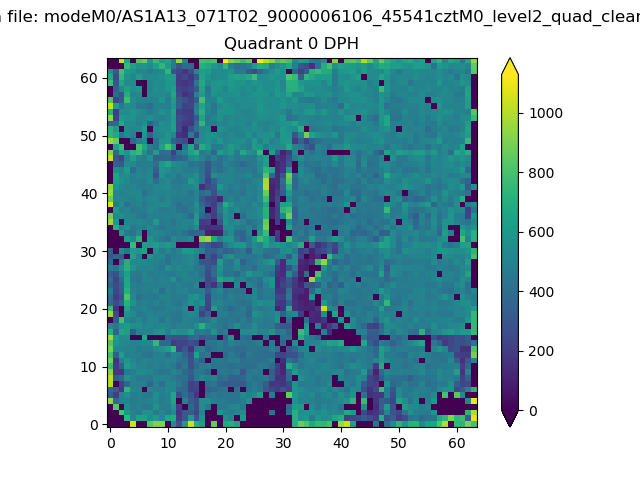 |
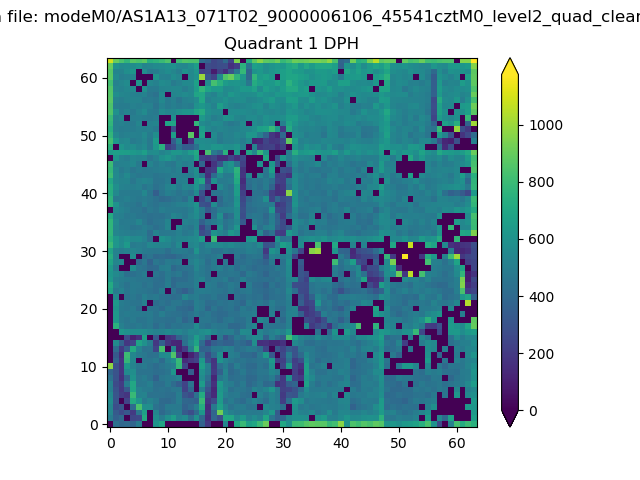 |
Quadrant B |
|---|---|---|---|
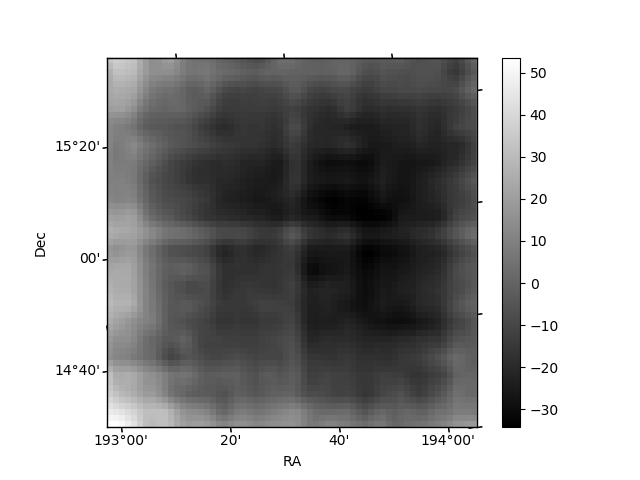
| Quadrant D | 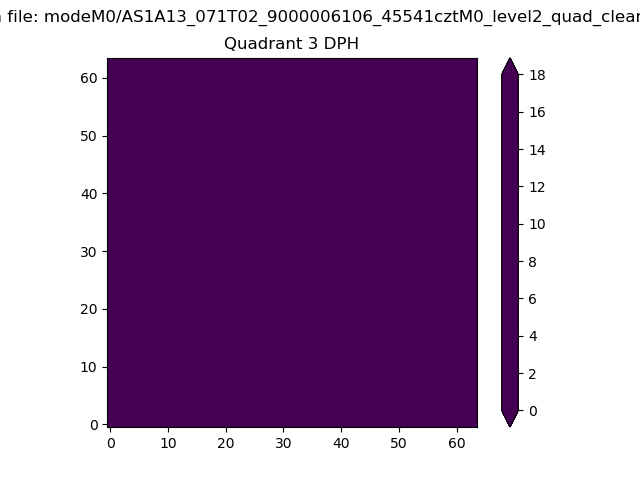 |
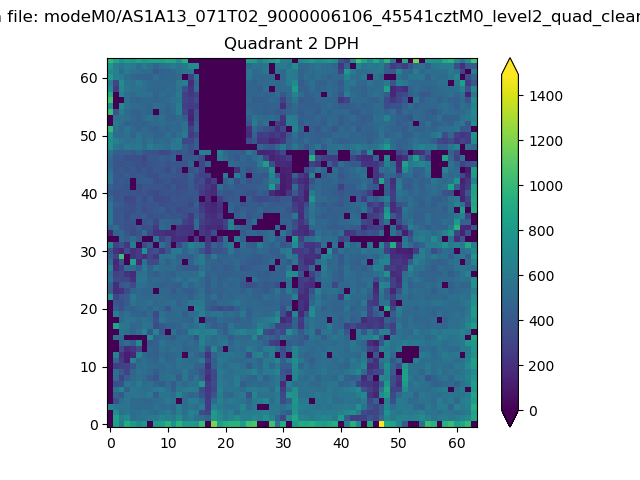 |
Quadrant C |
| Plot type | Count rate plots | Images |
|---|---|---|
| Comparison with Poisson distribution Blue bars denote a histogram of data divided into 1 sec bins. Red curve is a Poisson curve with rate = median count rate of data. |
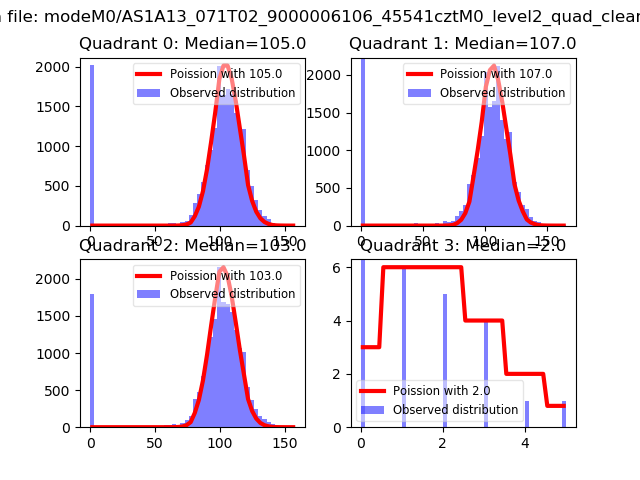 |
 |
| Quadrant-wise count rates Data is divided into 100 sec bins |
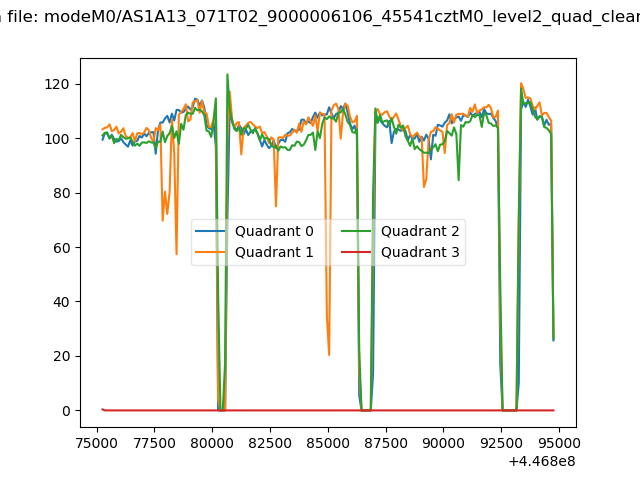 |
|
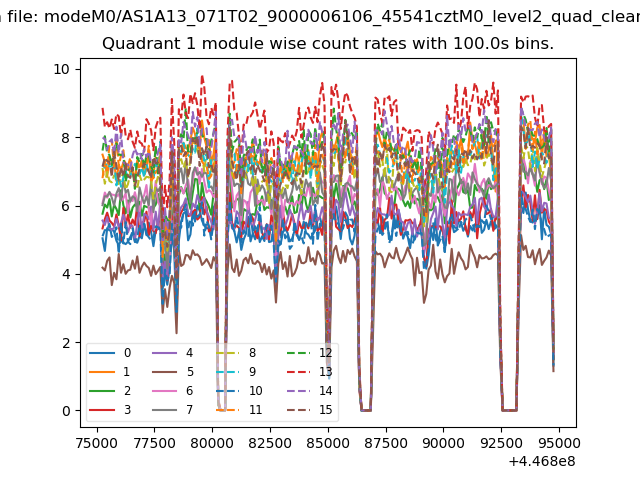
| Module-wise count rates for Quadrant A Data is divided into 100 sec bins |
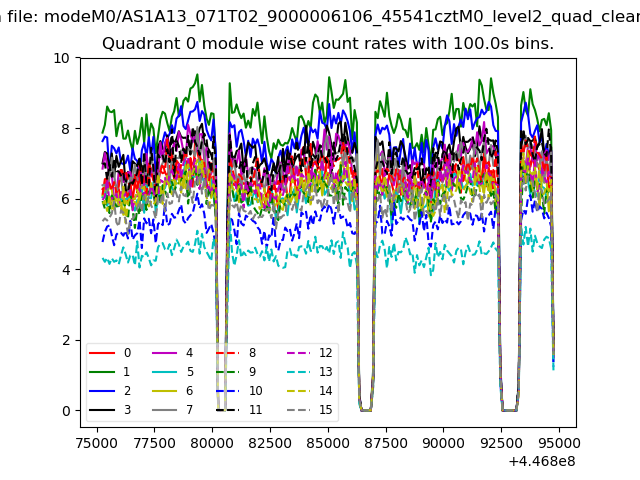 |
 |
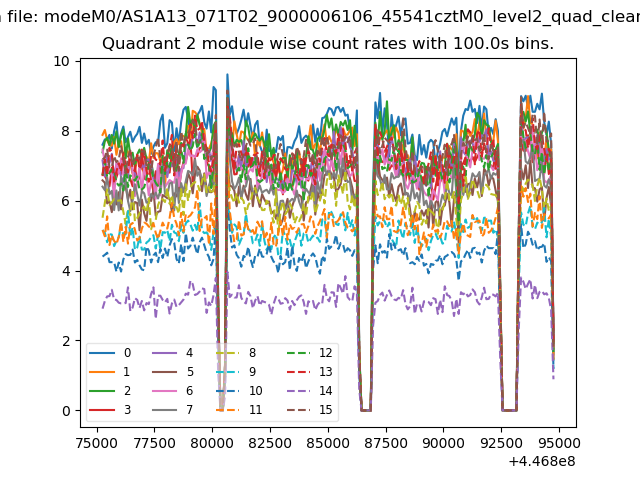
| Module-wise count rates for Quadrant B Data is divided into 100 sec bins |
 |
 |
| Module-wise count rates for Quadrant C Data is divided into 100 sec bins |
 |
 |
| Module-wise count rates for Quadrant D Data is divided into 100 sec bins |
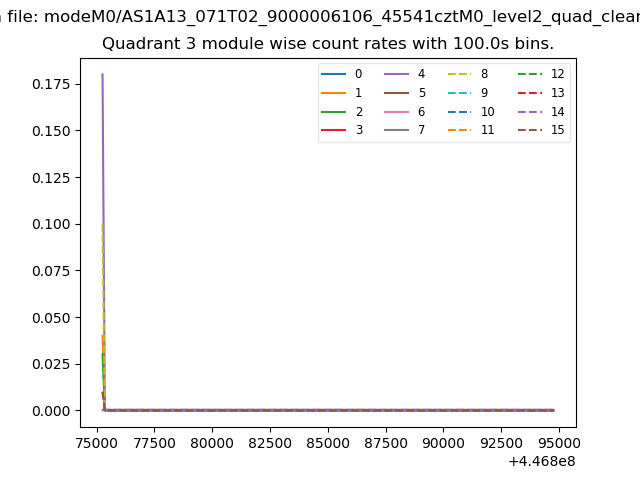 |
 |
| Parameter | Plot |
|---|---|
| CZT HV Monitor | 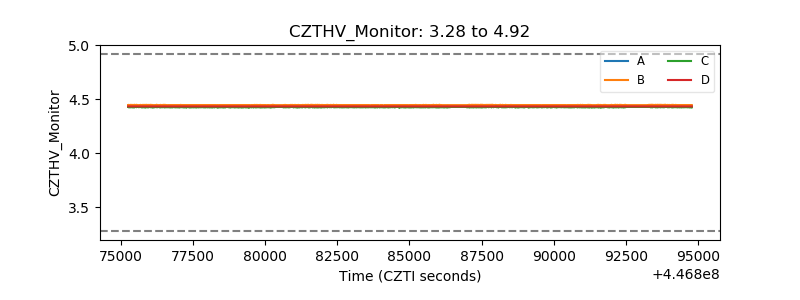 |
| D_VDD | 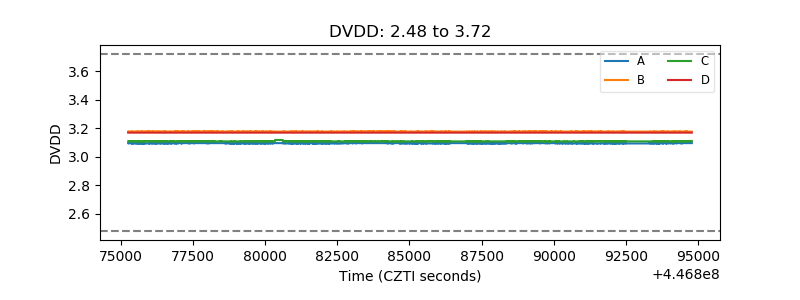 |
| Temperature 1 | 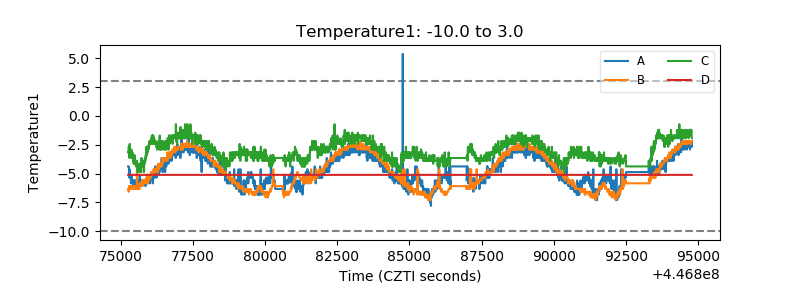 |
| Veto HV Monitor | 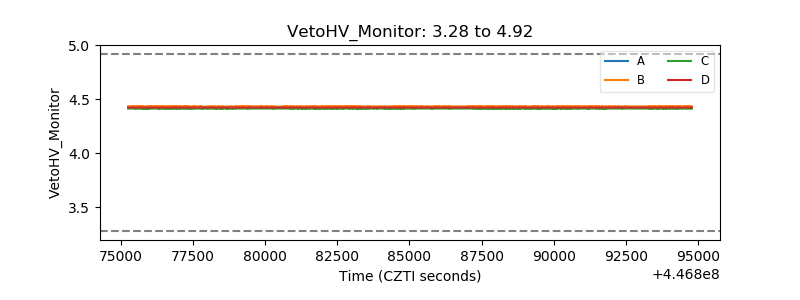 |
| Veto LLD | 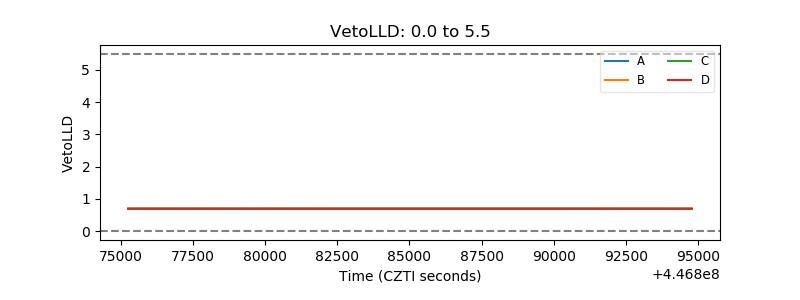 |
| Alpha Counter | 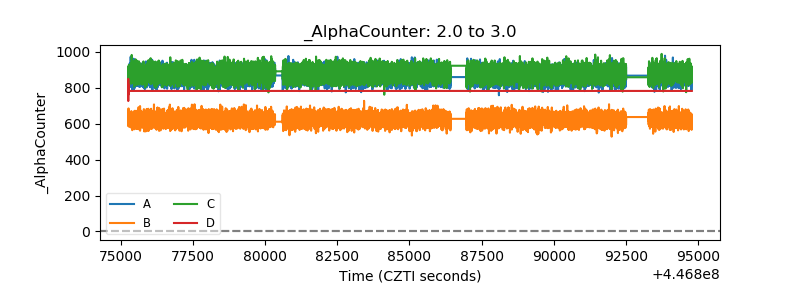 |
| _CPM_Rate | 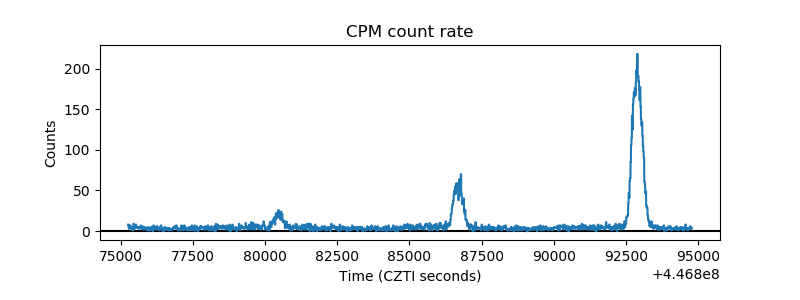 |
| CZT Counter | 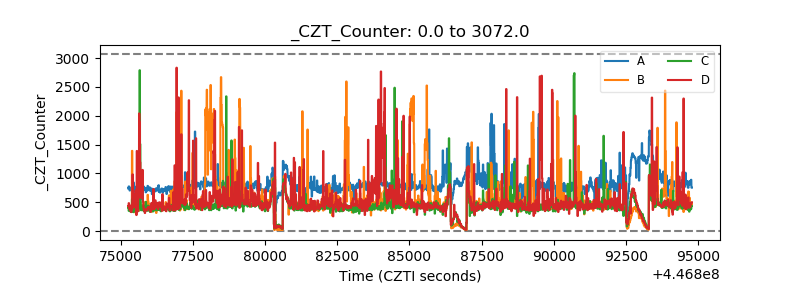 |
| +2.5 Volts monitor | 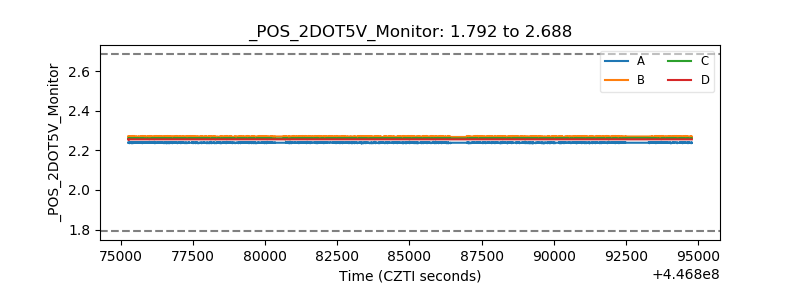 |
| +5 Volts monitor | 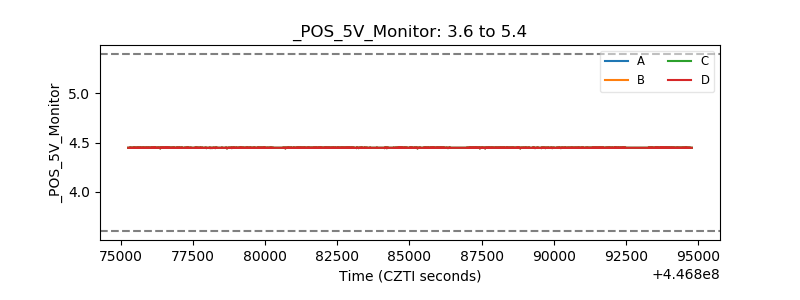 |
| _ROLL_ROT | 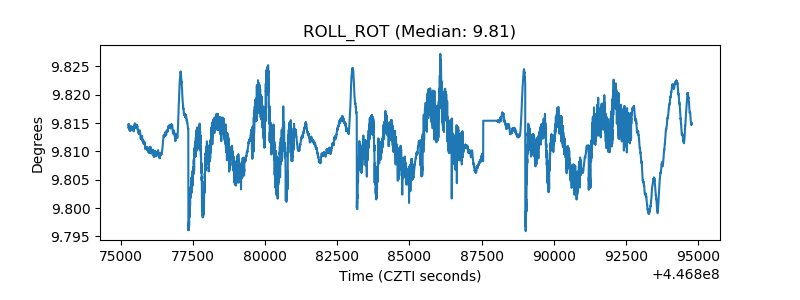 |
| _Roll_DEC | 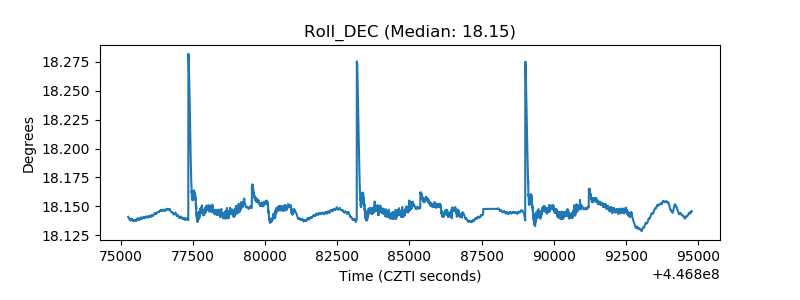 |
| _Roll_RA | 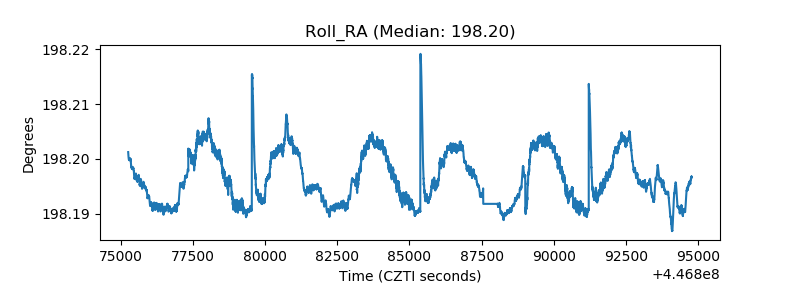 |
| Veto Counter | 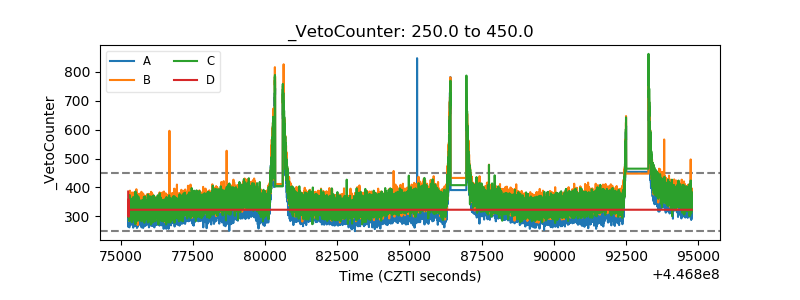 |