| Param | Original file | Final file |
|---|---|---|
| Filename | modeM0/AS1A13_071T02_9000006106_45542cztM0_level2.fits | modeM0/AS1A13_071T02_9000006106_45542cztM0_level2_quad_clean.evt |
| Size (bytes) | 2,509,640,640 | 560,977,920 |
| Size | 2.3 GB | 535.0 MB |
| Events in quadrant A | 29,062,318 | 3,738,731 |
| Events in quadrant B | 22,047,772 | 3,720,139 |
| Events in quadrant C | 17,076,377 | 3,717,879 |
| Events in quadrant D | 21,949,116 | 3,350,131 |
| Mode M0 | |||
|---|---|---|---|
| Quadrant | BADHDUFLAG | Total packets | Discarded packets |
| A | 0 | 111791 | 7 |
| B | 0 | 90227 | 4 |
| C | 0 | 77059 | 4 |
| D | 0 | 89996 | 9 |
| Mode SS | |||
|---|---|---|---|
| Quadrant | BADHDUFLAG | Total packets | Discarded packets |
| A | 0 | 722 | 0 |
| B | 0 | 722 | 0 |
| C | 0 | 722 | 0 |
| D | 0 | 722 | 0 |
| Mode M9 | |||
|---|---|---|---|
| Quadrant | BADHDUFLAG | Total packets | Discarded packets |
| A | 0 | 27 | 0 |
| B | 0 | 27 | 0 |
| C | 0 | 27 | 0 |
| D | 0 | 27 | 0 |
| Quadrant | Total seconds | Saturated seconds | Saturation percentage |
|---|---|---|---|
| A | 35779 | 937 | 2.618855% |
| B | 35781 | 2312 | 6.461530% |
| C | 35781 | 532 | 1.486823% |
| D | 35778 | 1234 | 3.449047% |
Noise dominated data is calculated using 1-second bins in cleaned event files. If a bin has >2000 counts, and if more than 50% of those come from <1% of pixels, then it is considered to be noise-dominated and hence unusable.
| Quadrant | # 1 sec bins | Bins with >0 counts | Bins with >2000 counts | High rate bins dominated by noise | Noise dominated (total time) | Noise dominated (detector-on time) | Marked lightcurve |
|---|---|---|---|---|---|---|---|
| A | 38355 | 35785 | 63 | 63 | 0.16% | 0.18% | 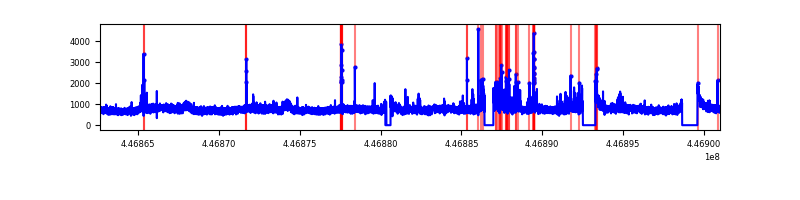 |
| B | 38356 | 35786 | 1170 | 1170 | 3.05% | 3.27% | 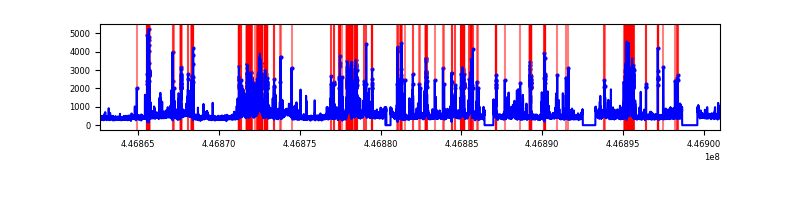 |
| C | 38356 | 35786 | 201 | 201 | 0.52% | 0.56% | 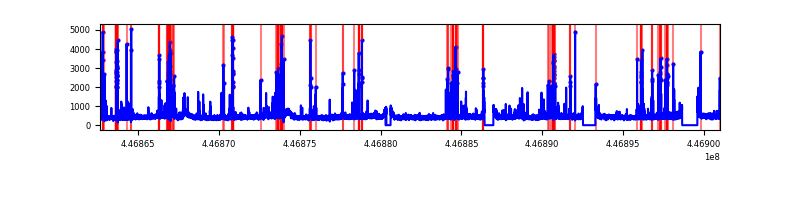 |
| D | 38355 | 35784 | 706 | 706 | 1.84% | 1.97% | 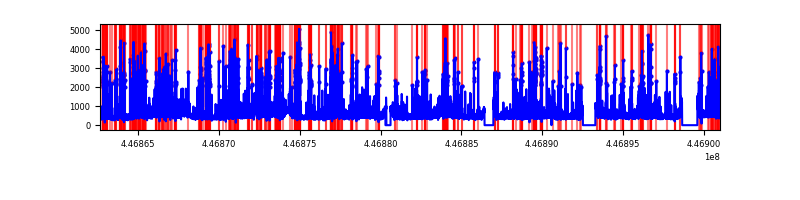 |
Top three noisy pixels from each quadrant. If the there are fewer than three noisy pixels in the level2.evt file, extra rows are filled as -1
| Pixel properties | Quadrant properties | ||||||
|---|---|---|---|---|---|---|---|
| Quadrant | DetID | PixID | Counts | Sigma | Mean | Median | Sigma |
| A | 10 | 83 | 12754089 | 15345.33 | 4026 | 3934 | 830.9 |
| A | 13 | 248 | 577678 | 690.52 | 4026 | 3934 | 830.9 |
| A | 15 | 174 | 106996 | 124.04 | 4026 | 3934 | 830.9 |
| B | 15 | 201 | 3820970 | 4903.63 | 3938 | 3816 | 778.4 |
| B | 12 | 18 | 733977 | 937.99 | 3938 | 3816 | 778.4 |
| B | 5 | 172 | 505102 | 643.97 | 3938 | 3816 | 778.4 |
| C | 14 | 254 | 946266 | 1009.27 | 3965 | 3981 | 933.6 |
| C | 12 | 2 | 627835 | 668.2 | 3965 | 3981 | 933.6 |
| C | 1 | 3 | 33121 | 31.21 | 3965 | 3981 | 933.6 |
| D | 13 | 249 | 2335005 | 2365.17 | 3940 | 3818 | 985.6 |
| D | 1 | 52 | 1760853 | 1782.65 | 3940 | 3818 | 985.6 |
| D | 12 | 233 | 659738 | 665.48 | 3940 | 3818 | 985.6 |
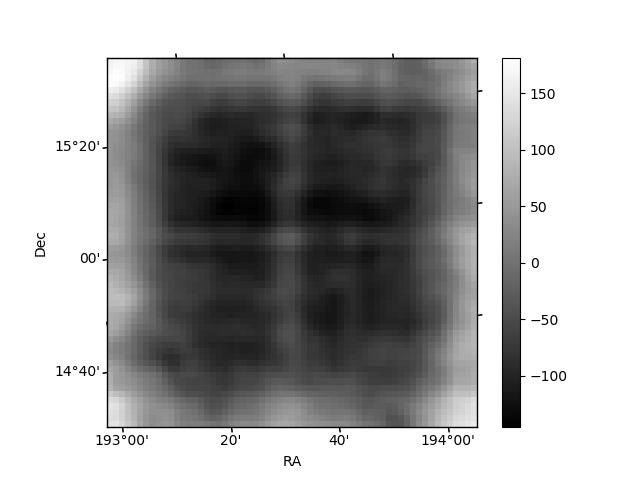
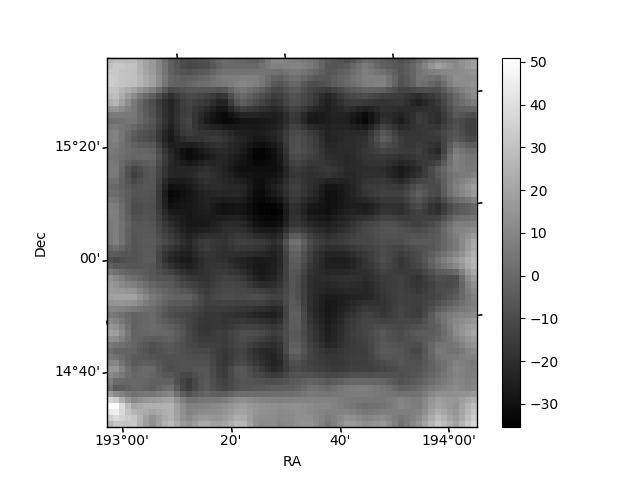
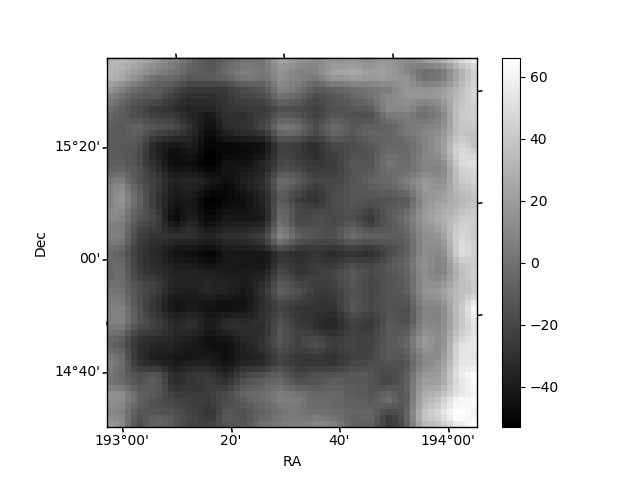
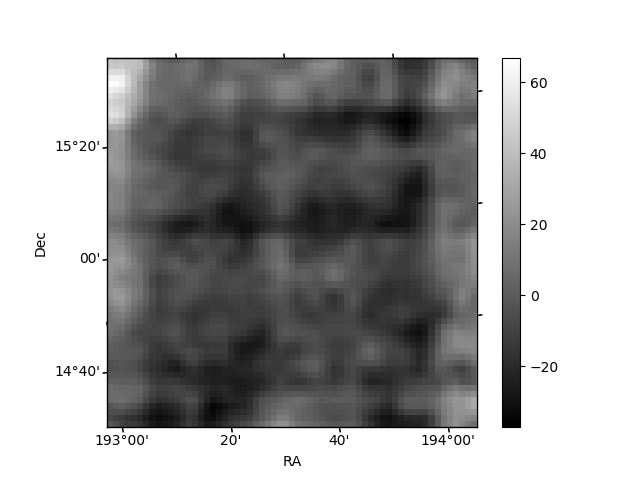
Histogram calculated using DETX and DETY for each event in the final _common_clean file
| Quadrant A | 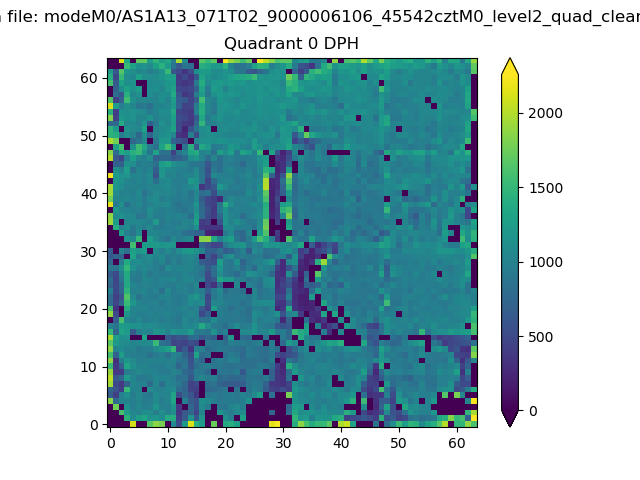 |
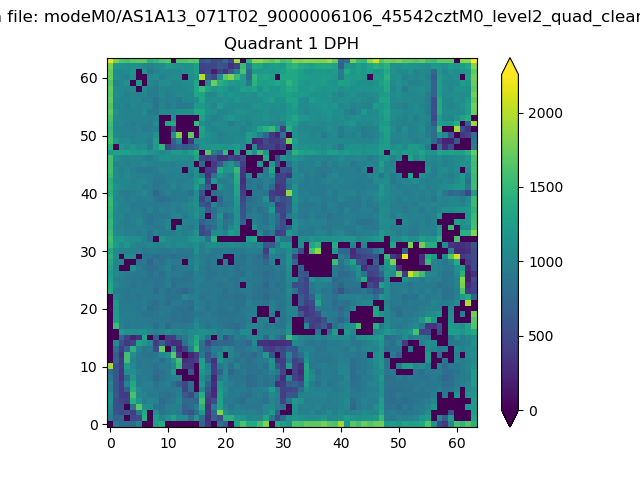 |
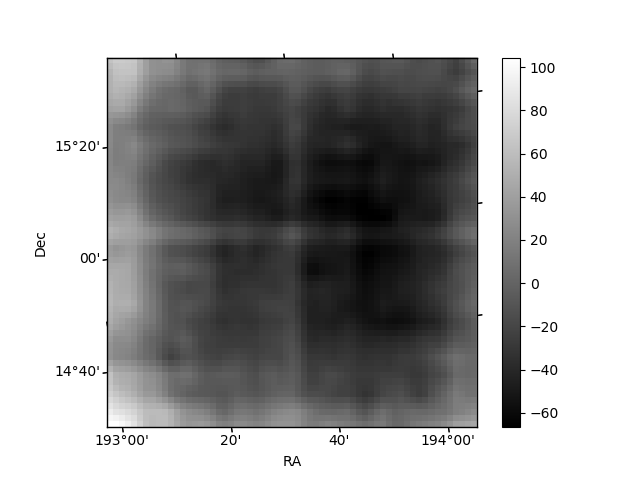
Quadrant B |
|---|---|---|---|
| Quadrant D | 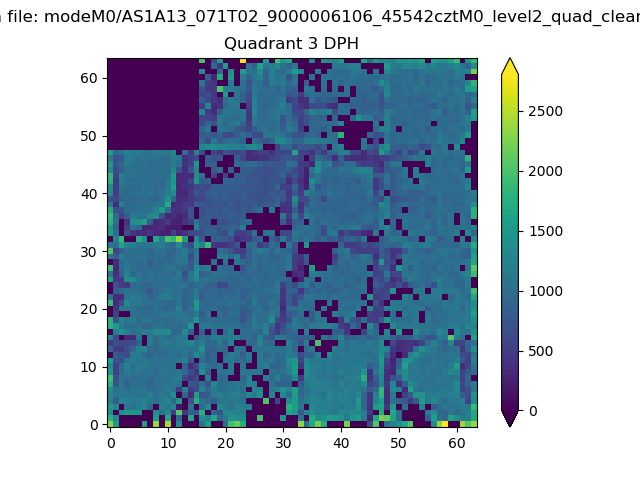 |
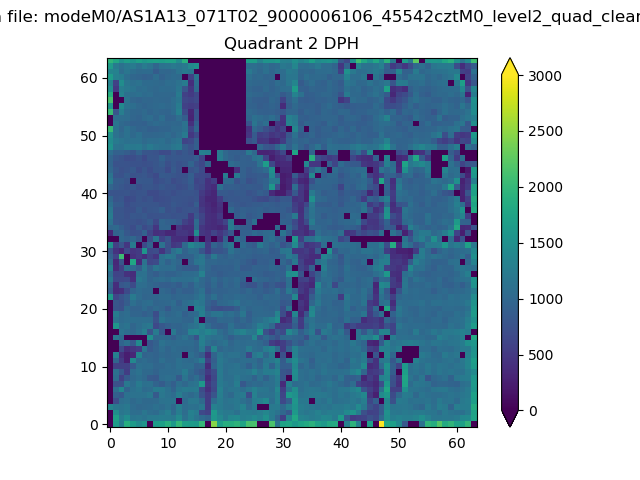 |
Quadrant C |
| Plot type | Count rate plots | Images |
|---|---|---|
| Comparison with Poisson distribution Blue bars denote a histogram of data divided into 1 sec bins. Red curve is a Poisson curve with rate = median count rate of data. |
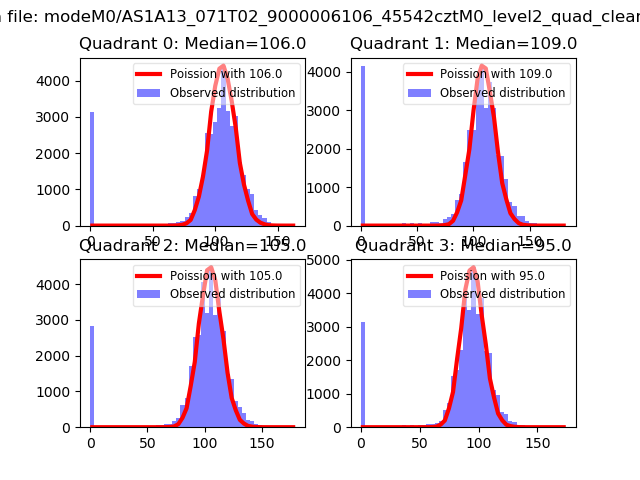 |
 |
| Quadrant-wise count rates Data is divided into 100 sec bins |
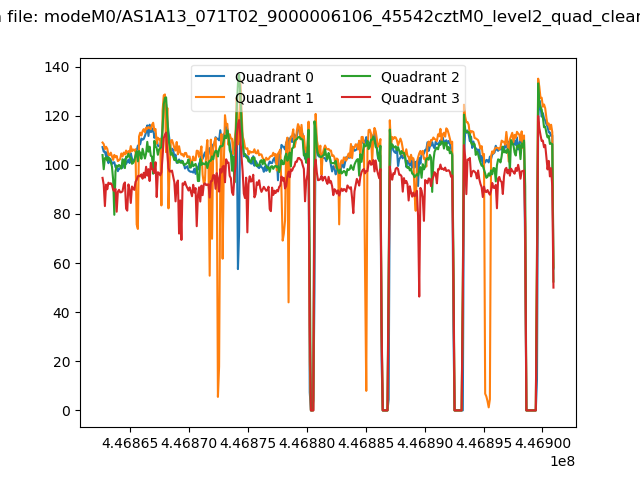 |
|
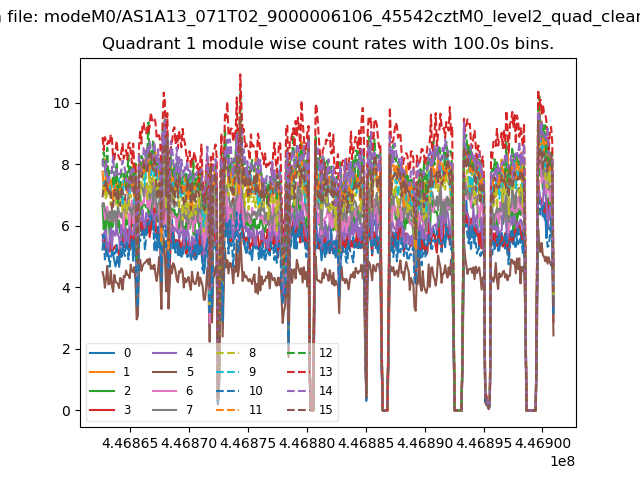
| Module-wise count rates for Quadrant A Data is divided into 100 sec bins |
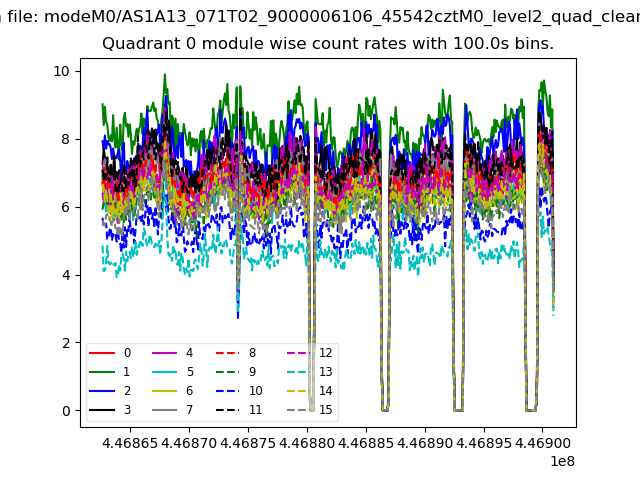 |
 |
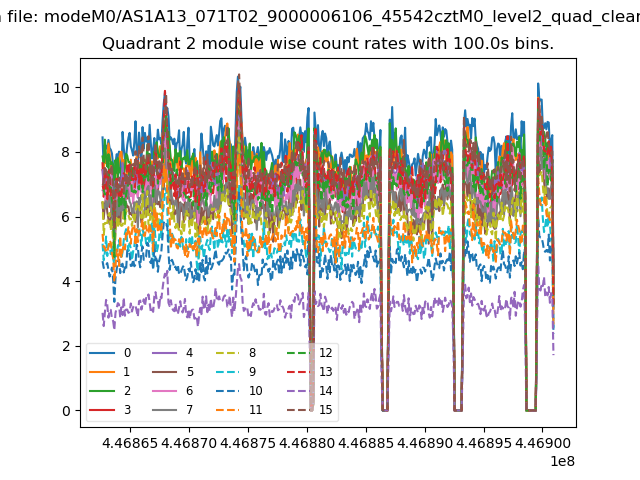
| Module-wise count rates for Quadrant B Data is divided into 100 sec bins |
 |
 |
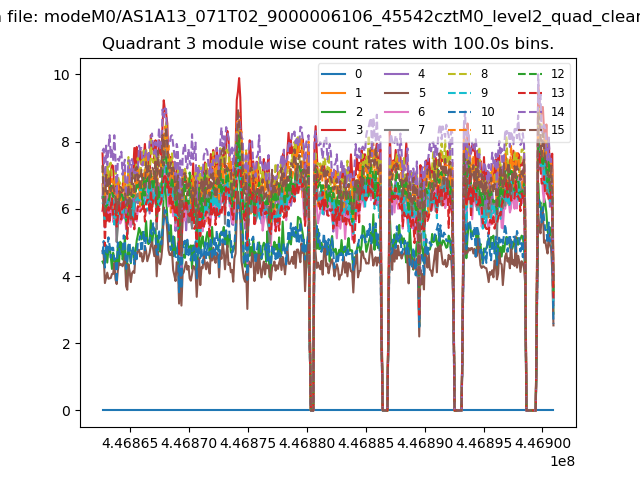
| Module-wise count rates for Quadrant C Data is divided into 100 sec bins |
 |
 |
| Module-wise count rates for Quadrant D Data is divided into 100 sec bins |
 |
 |
| Parameter | Plot |
|---|---|
| CZT HV Monitor | 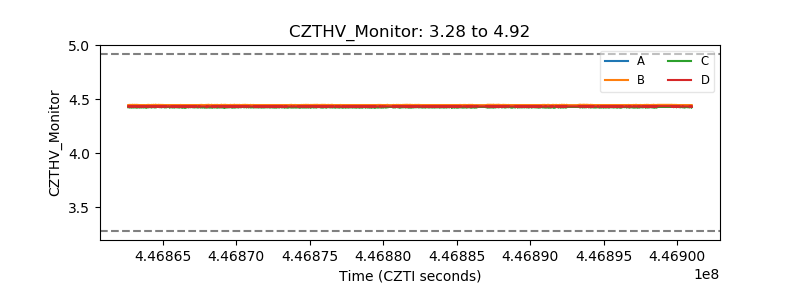 |
| D_VDD | 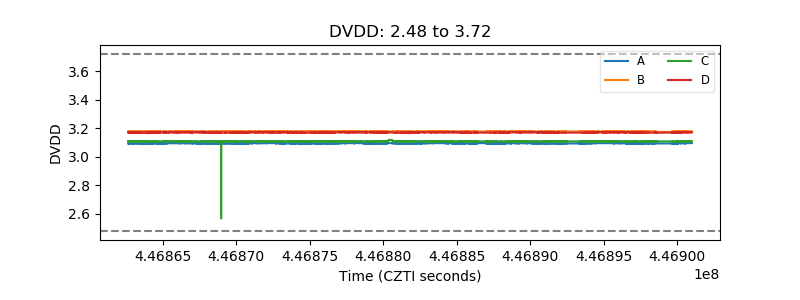 |
| Temperature 1 | 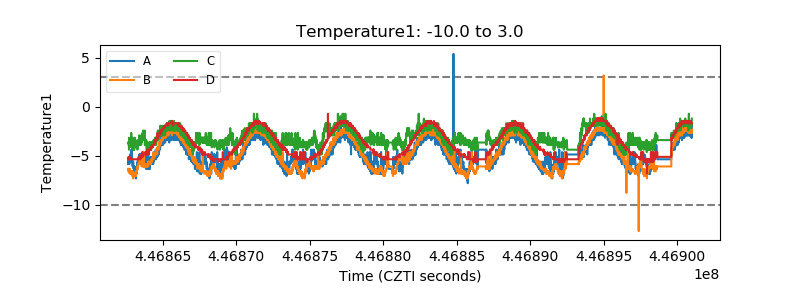 |
| Veto HV Monitor | 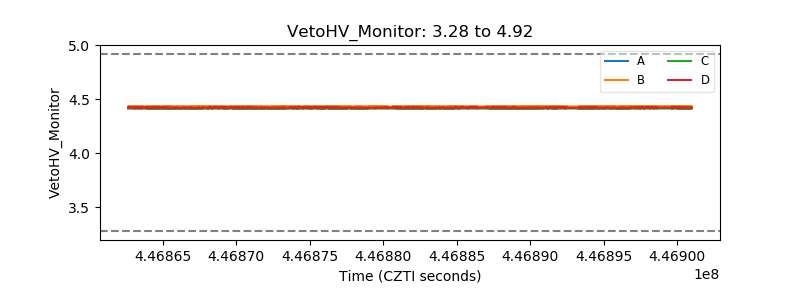 |
| Veto LLD | 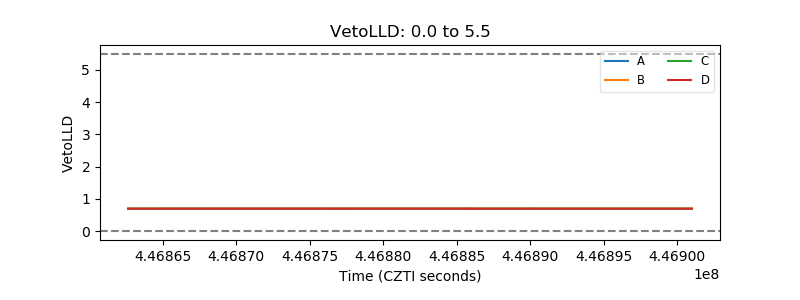 |
| Alpha Counter | 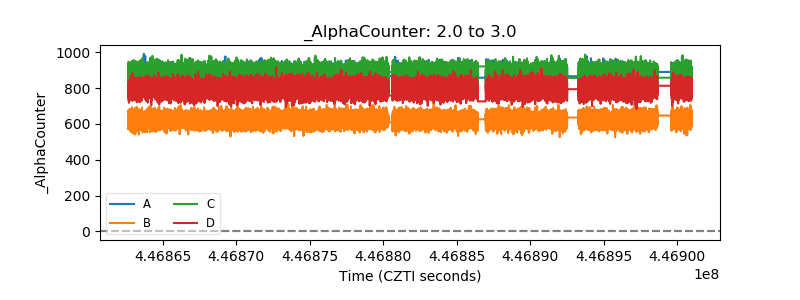 |
| _CPM_Rate | 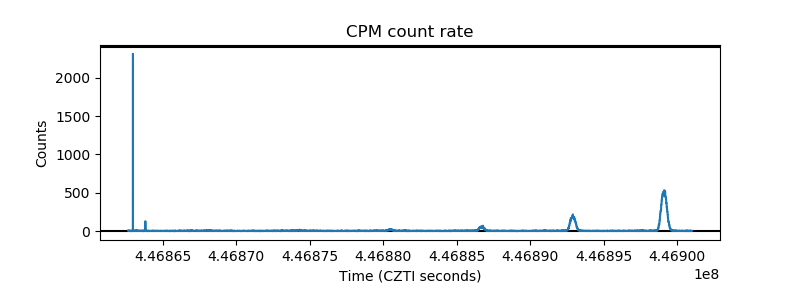 |
| CZT Counter | 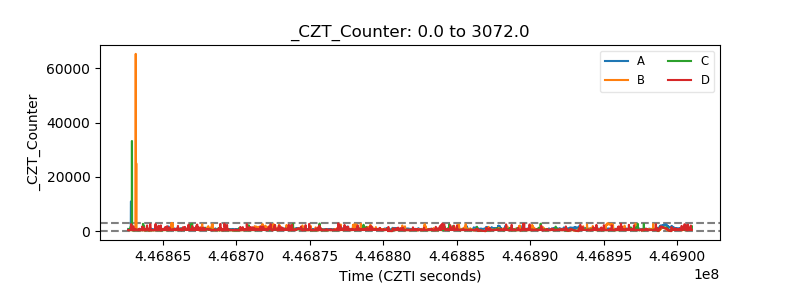 |
| +2.5 Volts monitor | 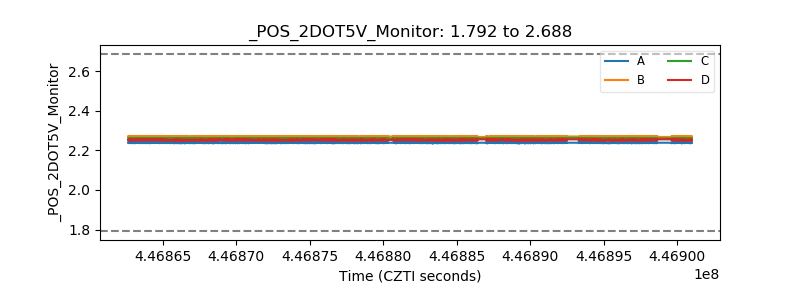 |
| +5 Volts monitor | 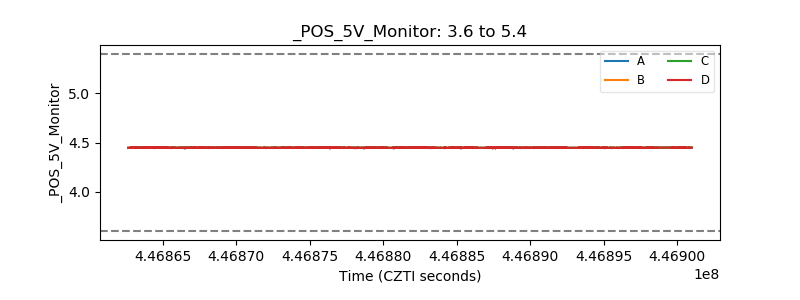 |
| _ROLL_ROT | 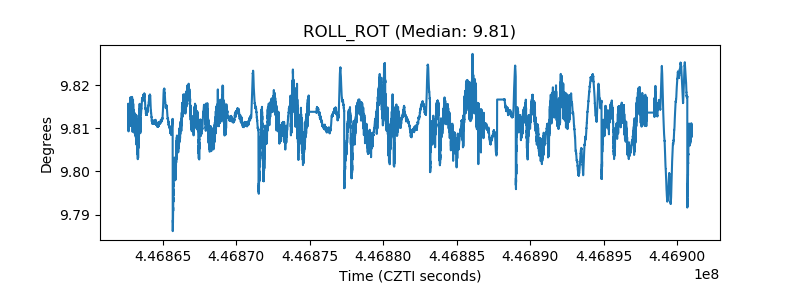 |
| _Roll_DEC | 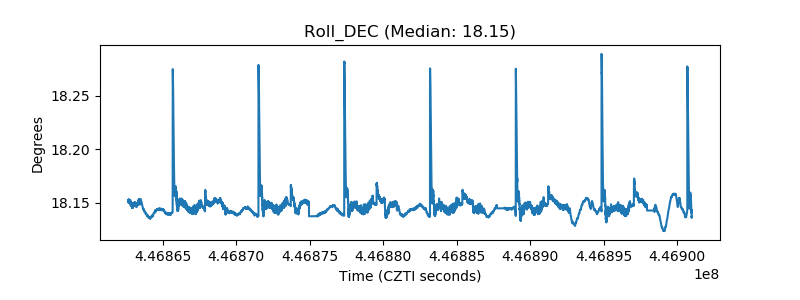 |
| _Roll_RA | 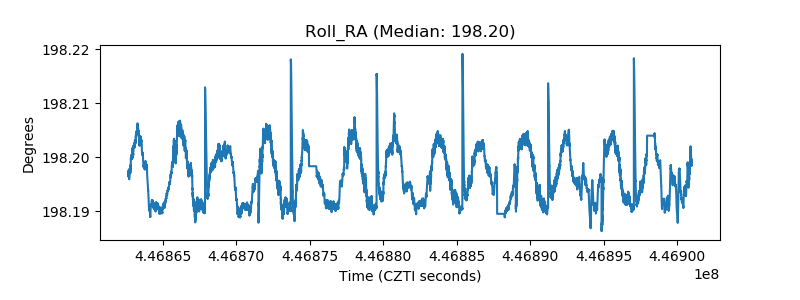 |
| Veto Counter | 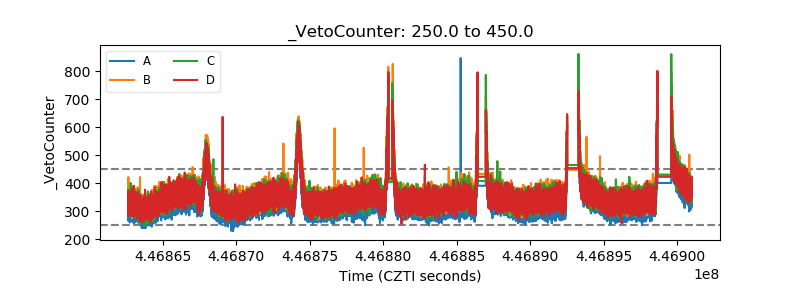 |