| Param | Original file | Final file |
|---|---|---|
| Filename | modeM0/AS1A13_071T02_9000006106_45544cztM0_level2.fits | modeM0/AS1A13_071T02_9000006106_45544cztM0_level2_quad_clean.evt |
| Size (bytes) | 549,561,600 | 109,293,120 |
| Size | 524.1 MB | 104.2 MB |
| Events in quadrant A | 5,919,965 | 738,457 |
| Events in quadrant B | 5,911,964 | 699,699 |
| Events in quadrant C | 3,354,758 | 739,614 |
| Events in quadrant D | 4,638,824 | 666,560 |
| Mode M0 | |||
|---|---|---|---|
| Quadrant | BADHDUFLAG | Total packets | Discarded packets |
| A | 0 | 22258 | 112 |
| B | 0 | 22016 | 68 |
| C | 0 | 14603 | 66 |
| D | 0 | 18265 | 54 |
| Mode SS | |||
|---|---|---|---|
| Quadrant | BADHDUFLAG | Total packets | Discarded packets |
| A | 0 | 137 | 1 |
| B | 0 | 138 | 0 |
| C | 0 | 138 | 0 |
| D | 0 | 137 | 1 |
| Mode M9 | |||
|---|---|---|---|
| Quadrant | BADHDUFLAG | Total packets | Discarded packets |
| A | 0 | 21 | 0 |
| B | 0 | 21 | 0 |
| C | 0 | 20 | 0 |
| D | 0 | 21 | 0 |
| Quadrant | Total seconds | Saturated seconds | Saturation percentage |
|---|---|---|---|
| A | 6668 | 331 | 4.964007% |
| B | 6671 | 1005 | 15.065208% |
| C | 6672 | 147 | 2.203237% |
| D | 6675 | 332 | 4.973783% |
Noise dominated data is calculated using 1-second bins in cleaned event files. If a bin has >2000 counts, and if more than 50% of those come from <1% of pixels, then it is considered to be noise-dominated and hence unusable.
| Quadrant | # 1 sec bins | Bins with >0 counts | Bins with >2000 counts | High rate bins dominated by noise | Noise dominated (total time) | Noise dominated (detector-on time) | Marked lightcurve |
|---|---|---|---|---|---|---|---|
| A | 8728 | 6677 | 27 | 27 | 0.31% | 0.40% | 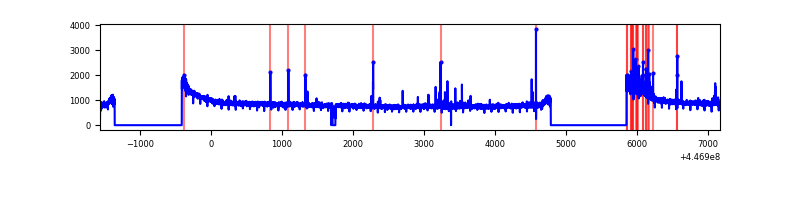 |
| B | 8728 | 6676 | 583 | 583 | 6.68% | 8.73% | 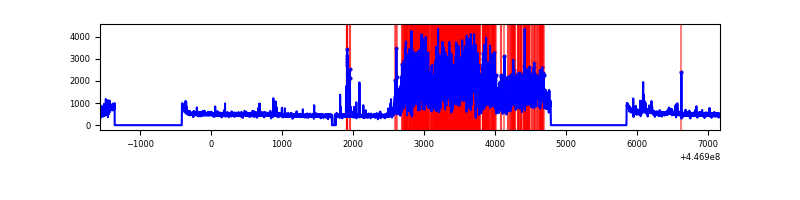 |
| C | 8728 | 6677 | 42 | 42 | 0.48% | 0.63% | 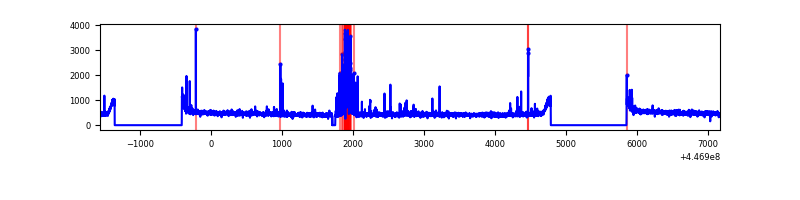 |
| D | 8728 | 6681 | 176 | 176 | 2.02% | 2.63% | 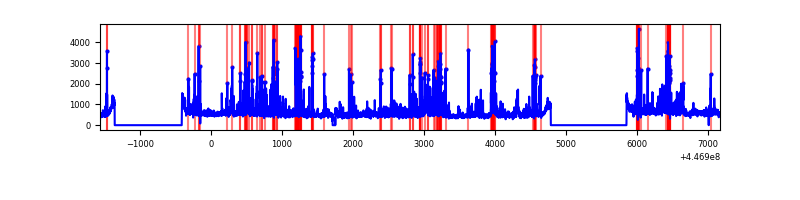 |
Top three noisy pixels from each quadrant. If the there are fewer than three noisy pixels in the level2.evt file, extra rows are filled as -1
| Pixel properties | Quadrant properties | ||||||
|---|---|---|---|---|---|---|---|
| Quadrant | DetID | PixID | Counts | Sigma | Mean | Median | Sigma |
| A | 10 | 83 | 2712154 | 16331.7 | 794 | 775 | 166.0 |
| A | 13 | 248 | 104762 | 626.35 | 794 | 775 | 166.0 |
| A | 2 | 79 | 32333 | 190.09 | 794 | 775 | 166.0 |
| B | 12 | 3 | 2743795 | 18165.71 | 761 | 741 | 151.0 |
| B | 15 | 201 | 72385 | 474.46 | 761 | 741 | 151.0 |
| B | 5 | 172 | 51962 | 339.21 | 761 | 741 | 151.0 |
| C | 14 | 254 | 246648 | 1320.04 | 785 | 790 | 186.2 |
| C | 12 | 2 | 23779 | 123.43 | 785 | 790 | 186.2 |
| C | 3 | 233 | 9158 | 44.93 | 785 | 790 | 186.2 |
| D | 13 | 249 | 501402 | 2534.41 | 780 | 758 | 197.5 |
| D | 5 | 222 | 233889 | 1180.18 | 780 | 758 | 197.5 |
| D | 1 | 52 | 220215 | 1110.96 | 780 | 758 | 197.5 |
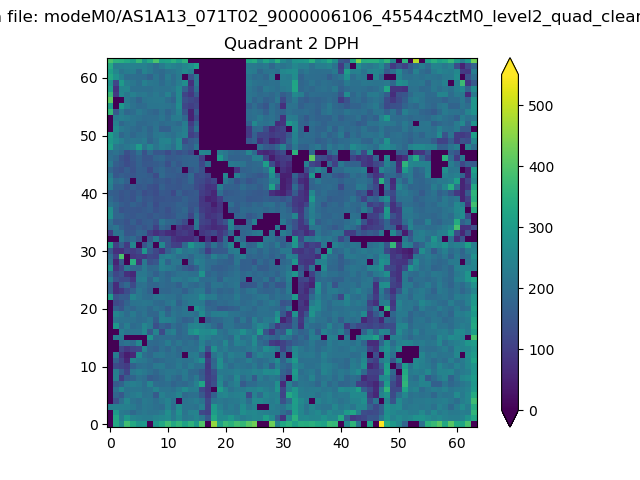
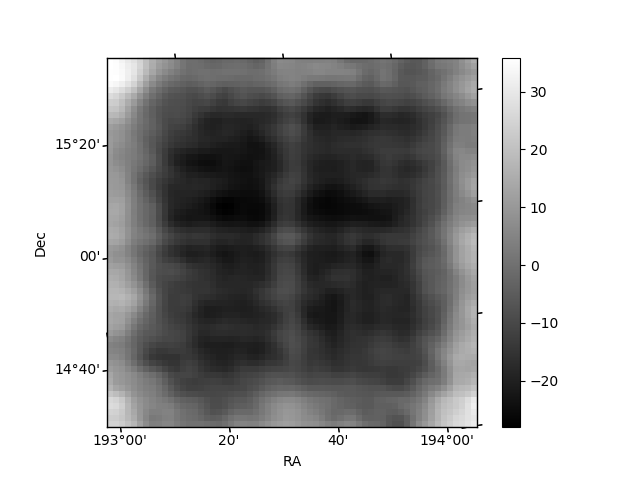
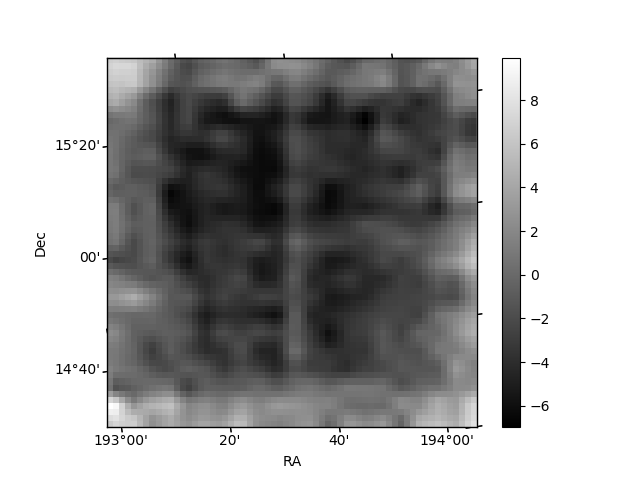
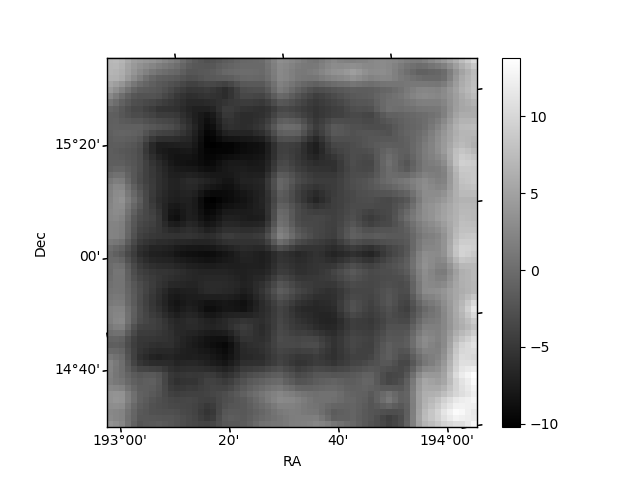
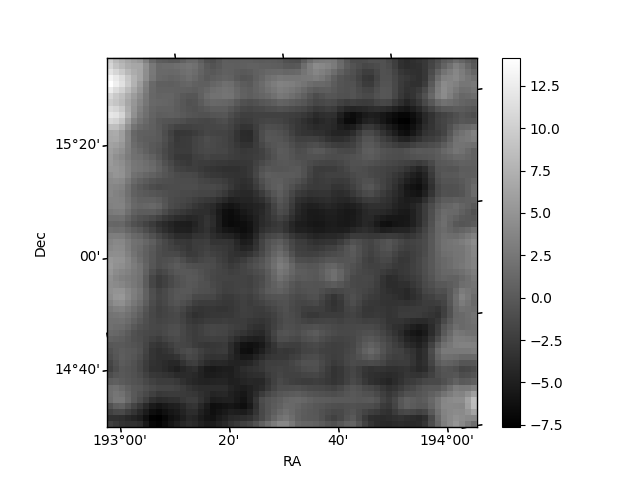
Histogram calculated using DETX and DETY for each event in the final _common_clean file
| Quadrant A | 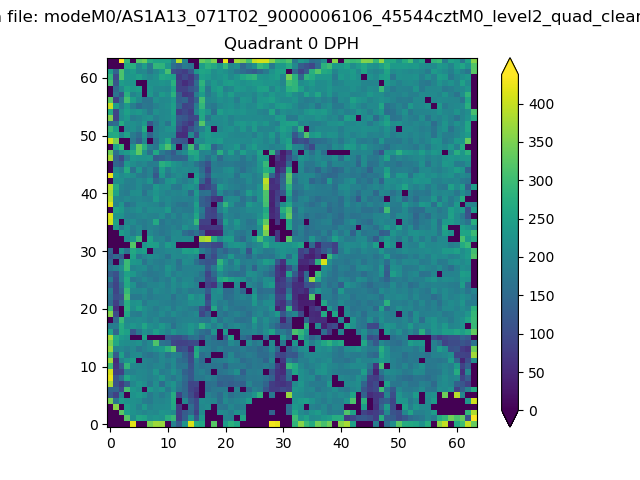 |
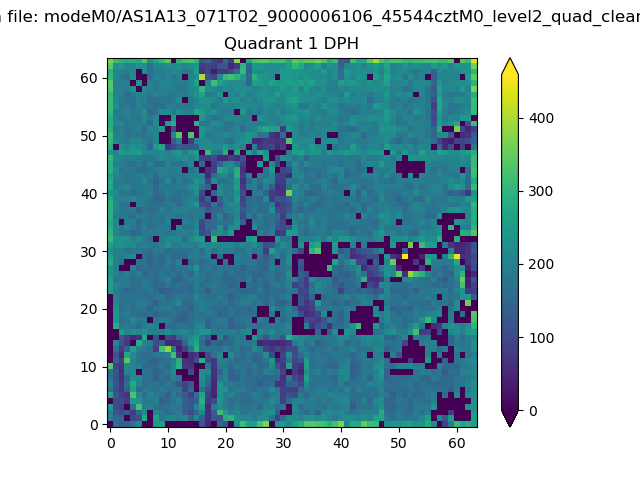 |
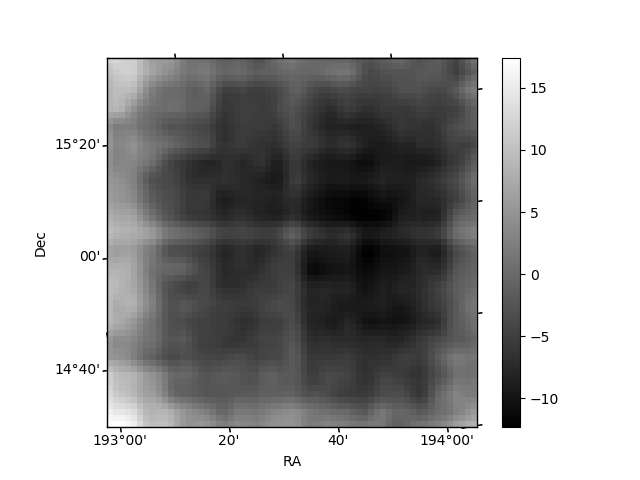
Quadrant B |
|---|---|---|---|
| Quadrant D | 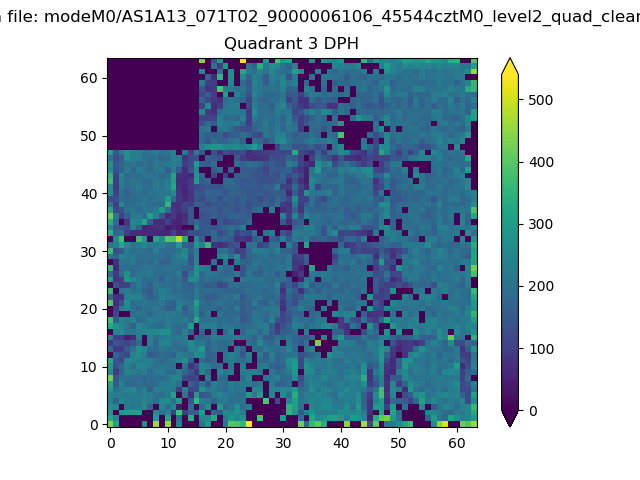 |
 |
Quadrant C |
| Plot type | Count rate plots | Images |
|---|---|---|
| Comparison with Poisson distribution Blue bars denote a histogram of data divided into 1 sec bins. Red curve is a Poisson curve with rate = median count rate of data. |
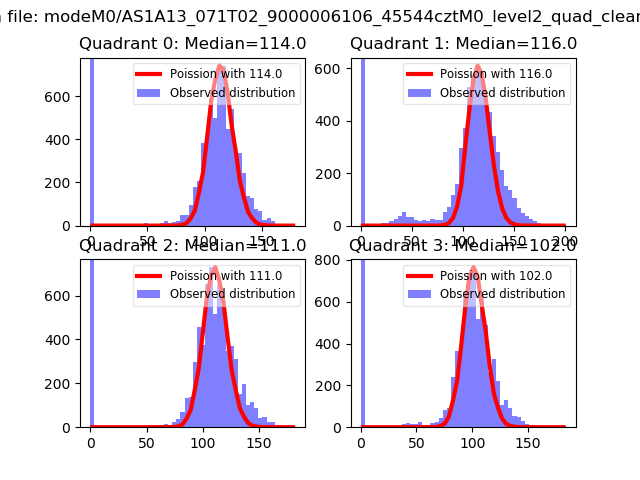 |
 |
| Quadrant-wise count rates Data is divided into 100 sec bins |
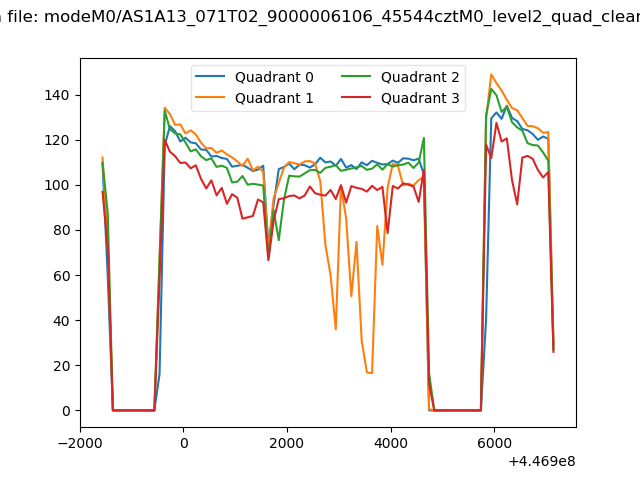 |
|
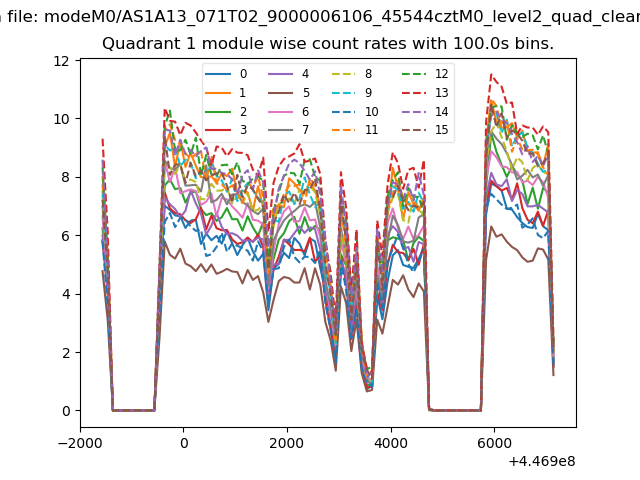
| Module-wise count rates for Quadrant A Data is divided into 100 sec bins |
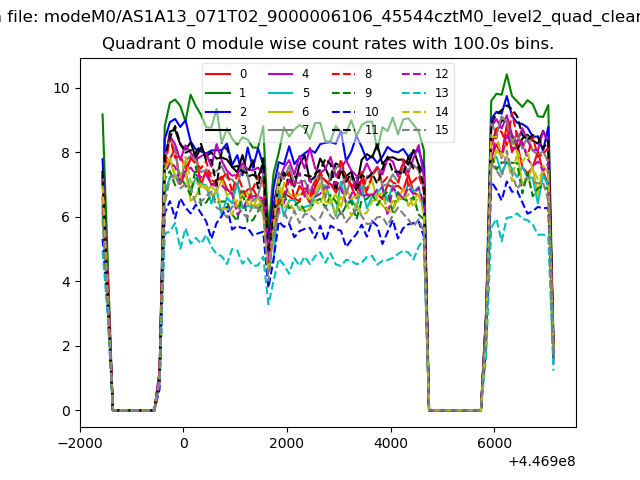 |
 |
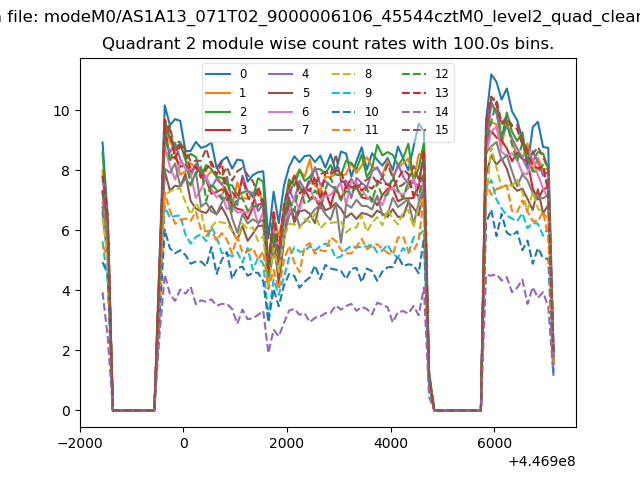
| Module-wise count rates for Quadrant B Data is divided into 100 sec bins |
 |
 |
| Module-wise count rates for Quadrant C Data is divided into 100 sec bins |
 |
 |
| Module-wise count rates for Quadrant D Data is divided into 100 sec bins |
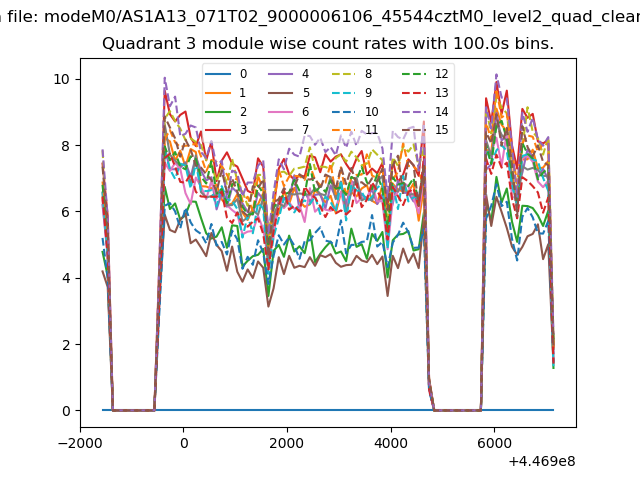 |
 |
| Parameter | Plot |
|---|---|
| CZT HV Monitor | 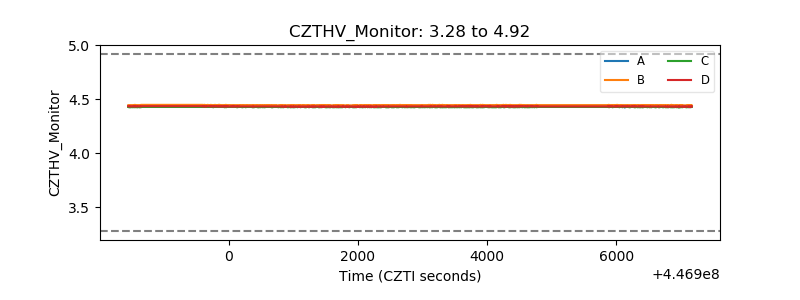 |
| D_VDD | 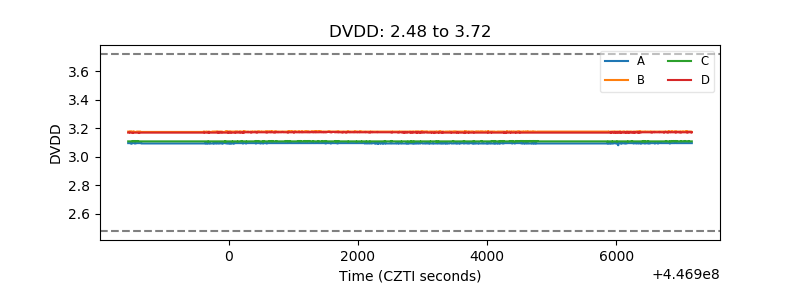 |
| Temperature 1 | 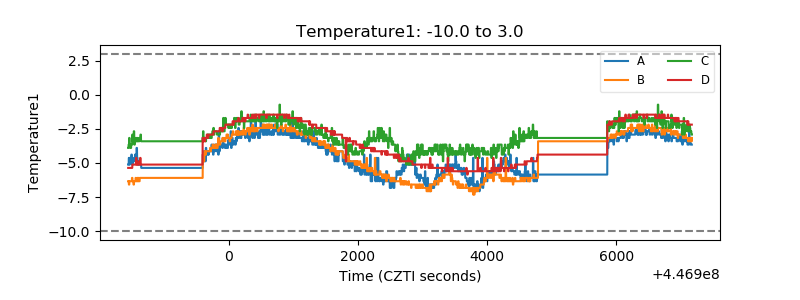 |
| Veto HV Monitor | 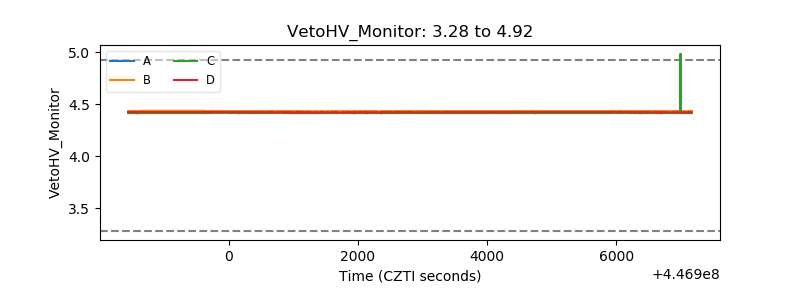 |
| Veto LLD | 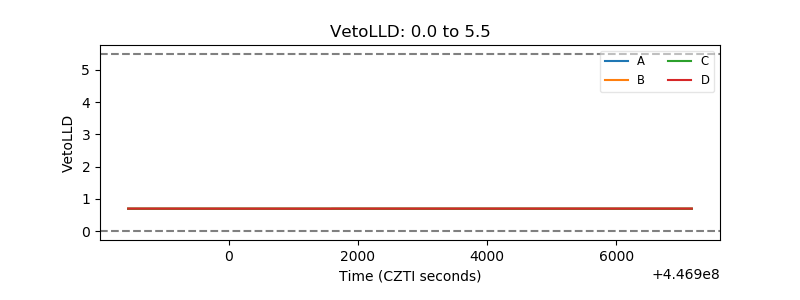 |
| Alpha Counter | 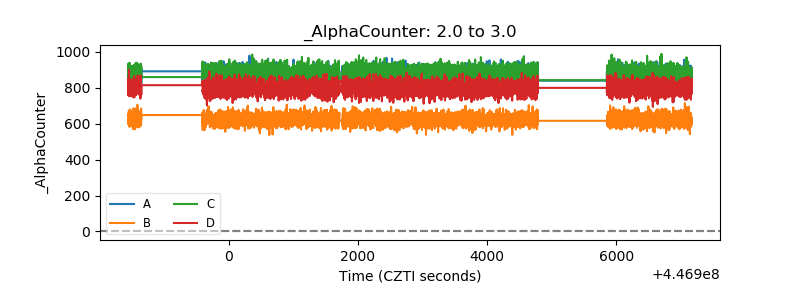 |
| _CPM_Rate | 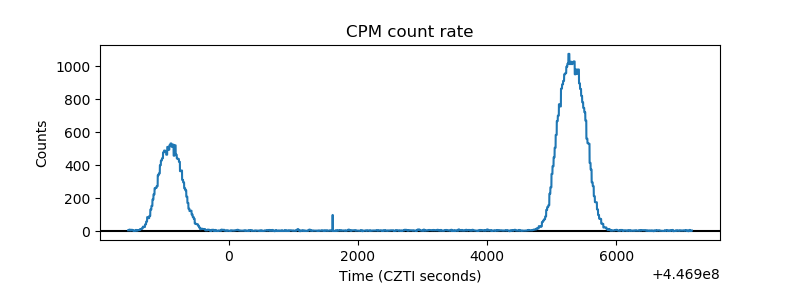 |
| CZT Counter | 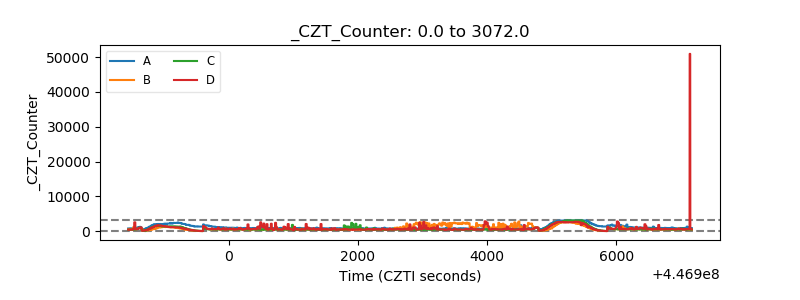 |
| +2.5 Volts monitor |  |
| +5 Volts monitor | 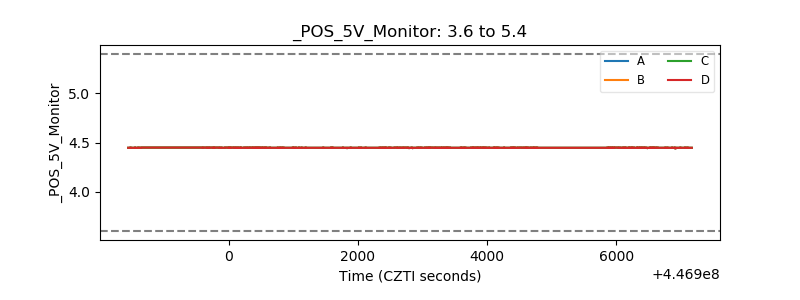 |
| _ROLL_ROT | 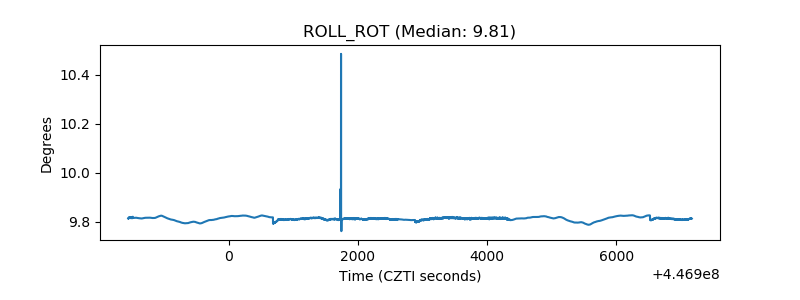 |
| _Roll_DEC | 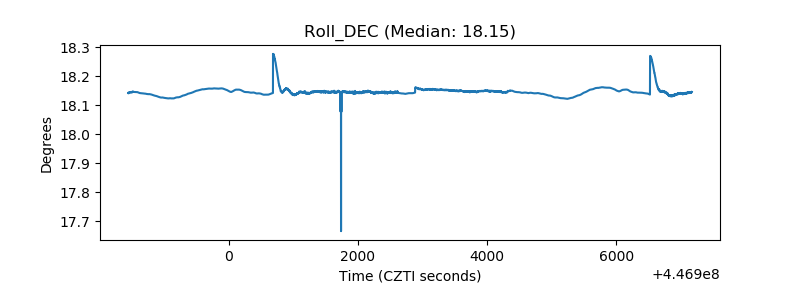 |
| _Roll_RA | 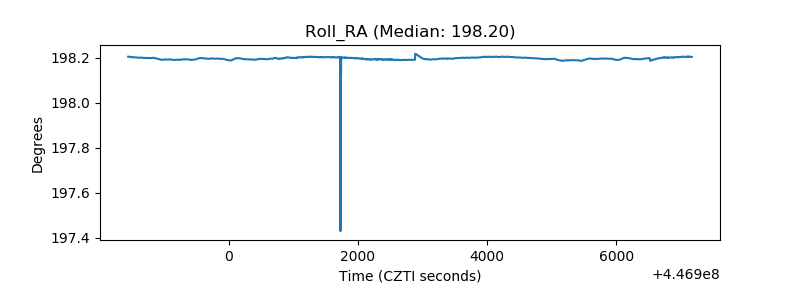 |
| Veto Counter | 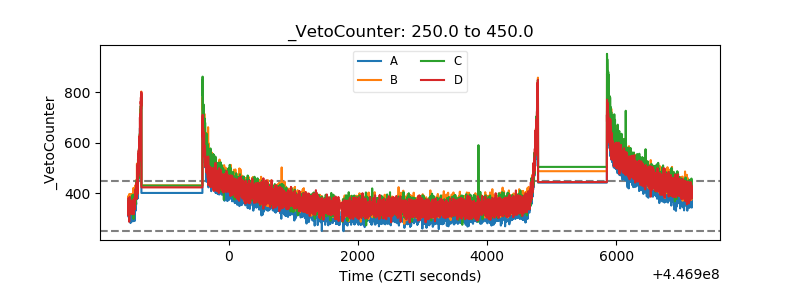 |