| Param | Original file | Final file |
|---|---|---|
| Filename | modeM0/AS1A13_071T02_9000006106_45545cztM0_level2.fits | modeM0/AS1A13_071T02_9000006106_45545cztM0_level2_quad_clean.evt |
| Size (bytes) | 484,545,600 | 113,417,280 |
| Size | 462.1 MB | 108.2 MB |
| Events in quadrant A | 6,003,186 | 753,235 |
| Events in quadrant B | 3,432,699 | 796,679 |
| Events in quadrant C | 3,383,342 | 758,627 |
| Events in quadrant D | 4,617,357 | 677,241 |
| Mode M0 | |||
|---|---|---|---|
| Quadrant | BADHDUFLAG | Total packets | Discarded packets |
| A | 0 | 22324 | 1 |
| B | 0 | 14366 | 1 |
| C | 0 | 14306 | 1 |
| D | 0 | 18156 | 1 |
| Mode SS | |||
|---|---|---|---|
| Quadrant | BADHDUFLAG | Total packets | Discarded packets |
| A | 0 | 130 | 0 |
| B | 0 | 130 | 0 |
| C | 0 | 130 | 0 |
| D | 0 | 130 | 0 |
| Mode M9 | |||
|---|---|---|---|
| Quadrant | BADHDUFLAG | Total packets | Discarded packets |
| A | 0 | 23 | 0 |
| B | 0 | 23 | 0 |
| C | 0 | 23 | 0 |
| D | 0 | 23 | 0 |
| Quadrant | Total seconds | Saturated seconds | Saturation percentage |
|---|---|---|---|
| A | 6438 | 326 | 5.063684% |
| B | 6439 | 154 | 2.391676% |
| C | 6439 | 132 | 2.050008% |
| D | 6439 | 326 | 5.062898% |
Noise dominated data is calculated using 1-second bins in cleaned event files. If a bin has >2000 counts, and if more than 50% of those come from <1% of pixels, then it is considered to be noise-dominated and hence unusable.
| Quadrant | # 1 sec bins | Bins with >0 counts | Bins with >2000 counts | High rate bins dominated by noise | Noise dominated (total time) | Noise dominated (detector-on time) | Marked lightcurve |
|---|---|---|---|---|---|---|---|
| A | 8674 | 6440 | 48 | 48 | 0.55% | 0.75% | 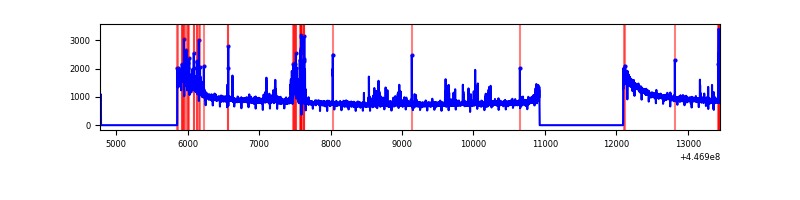 |
| B | 8675 | 6441 | 41 | 41 | 0.47% | 0.64% | 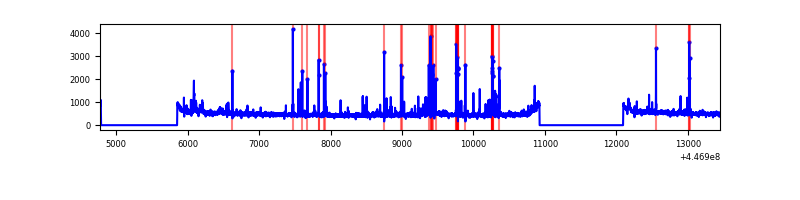 |
| C | 8675 | 6441 | 51 | 51 | 0.59% | 0.79% | 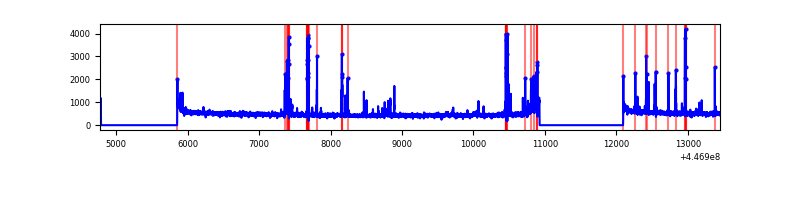 |
| D | 8675 | 6441 | 180 | 180 | 2.07% | 2.79% | 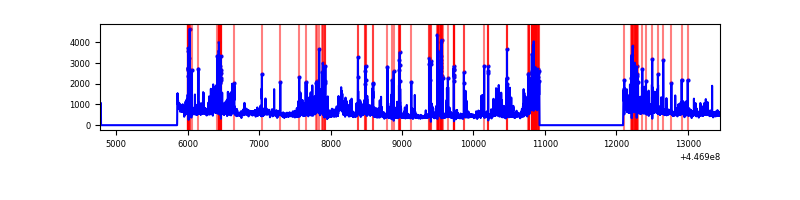 |
Top three noisy pixels from each quadrant. If the there are fewer than three noisy pixels in the level2.evt file, extra rows are filled as -1
| Pixel properties | Quadrant properties | ||||||
|---|---|---|---|---|---|---|---|
| Quadrant | DetID | PixID | Counts | Sigma | Mean | Median | Sigma |
| A | 10 | 83 | 2655383 | 16526.85 | 780 | 764 | 160.6 |
| A | 13 | 248 | 153814 | 952.84 | 780 | 764 | 160.6 |
| A | 15 | 174 | 142701 | 883.66 | 780 | 764 | 160.6 |
| B | 5 | 172 | 201377 | 1302.57 | 783 | 760 | 154.0 |
| B | 15 | 201 | 93815 | 604.19 | 783 | 760 | 154.0 |
| B | 0 | 186 | 34121 | 216.61 | 783 | 760 | 154.0 |
| C | 14 | 254 | 266853 | 1449.23 | 778 | 783 | 183.6 |
| C | 12 | 2 | 74444 | 401.22 | 778 | 783 | 183.6 |
| C | 1 | 3 | 5500 | 25.69 | 778 | 783 | 183.6 |
| D | 13 | 249 | 699086 | 3626.55 | 765 | 743 | 192.6 |
| D | 1 | 52 | 414222 | 2147.23 | 765 | 743 | 192.6 |
| D | 5 | 222 | 157566 | 814.39 | 765 | 743 | 192.6 |
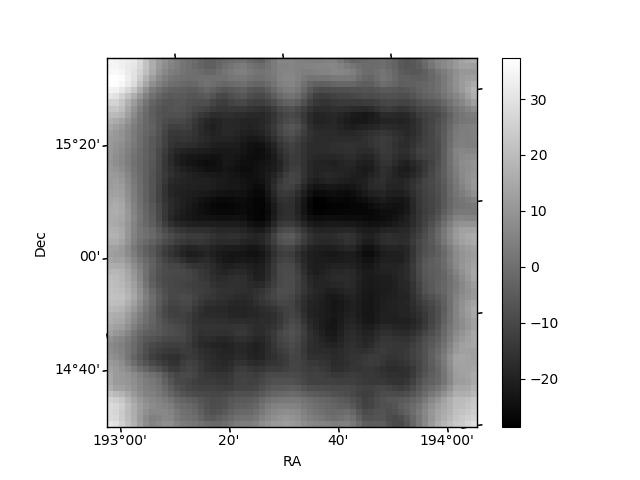
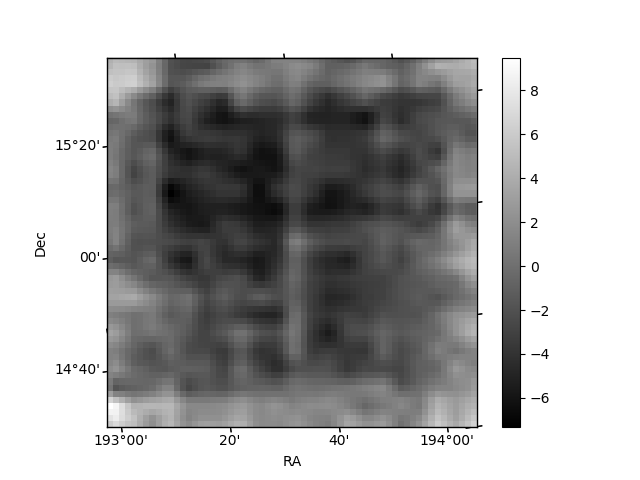
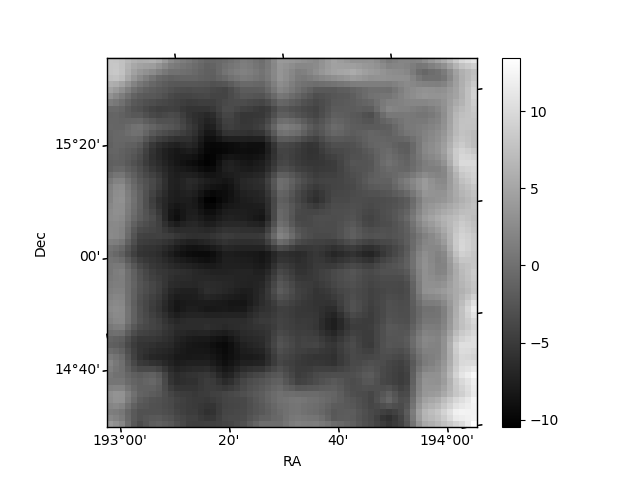
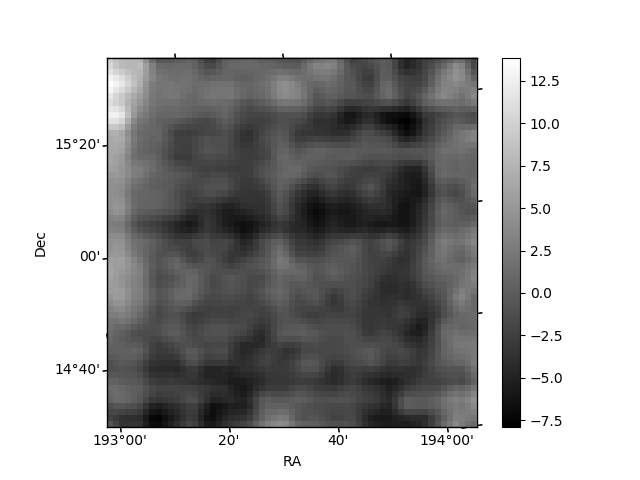
Histogram calculated using DETX and DETY for each event in the final _common_clean file
| Quadrant A | 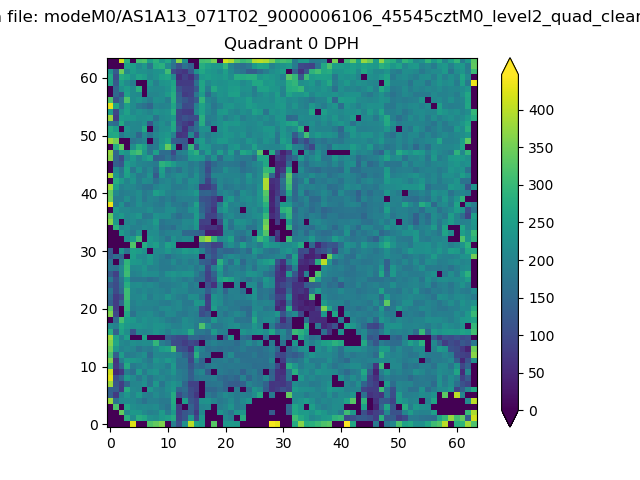 |
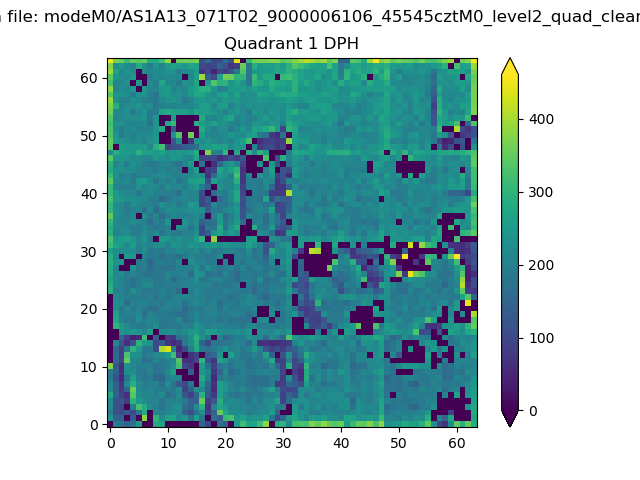 |
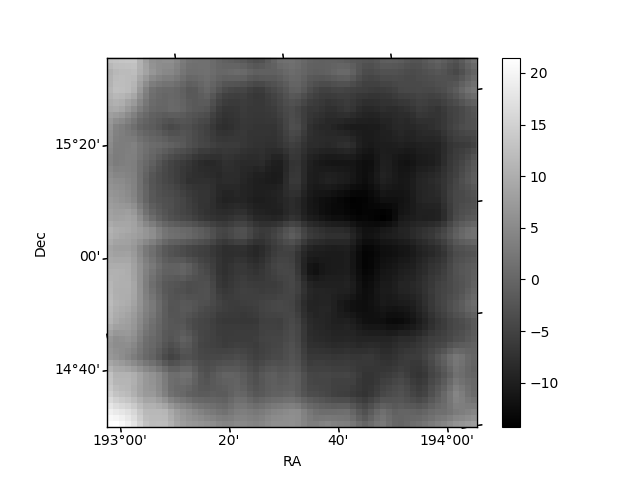
Quadrant B |
|---|---|---|---|
| Quadrant D | 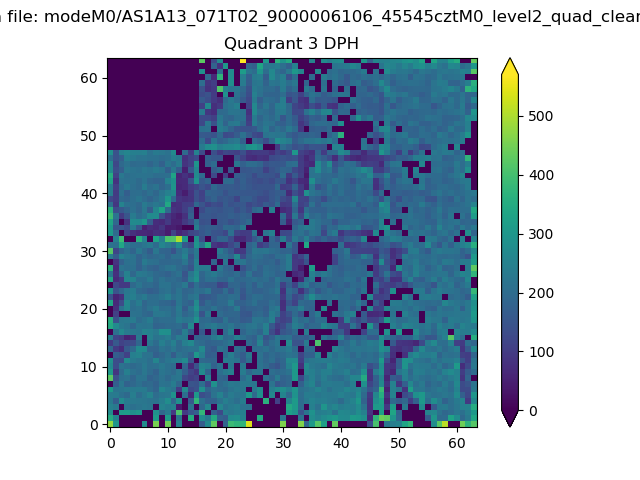 |
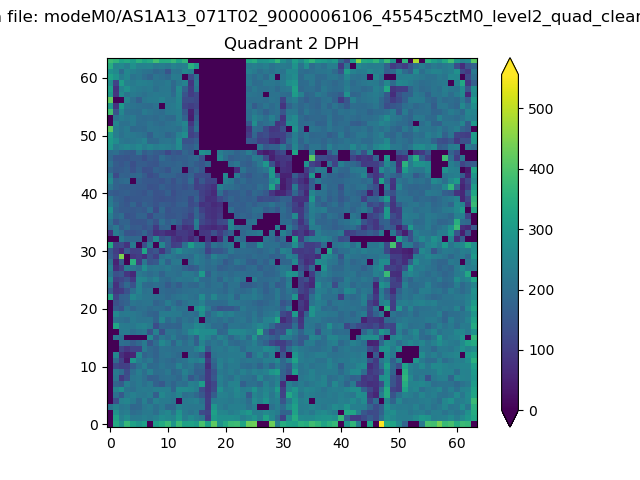 |
Quadrant C |
| Plot type | Count rate plots | Images |
|---|---|---|
| Comparison with Poisson distribution Blue bars denote a histogram of data divided into 1 sec bins. Red curve is a Poisson curve with rate = median count rate of data. |
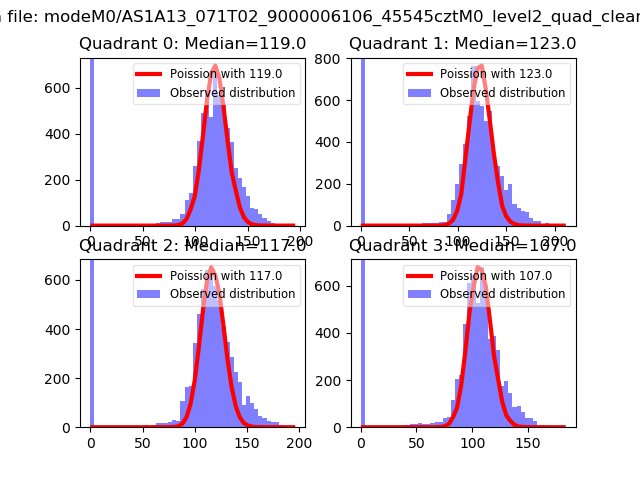 |
 |
| Quadrant-wise count rates Data is divided into 100 sec bins |
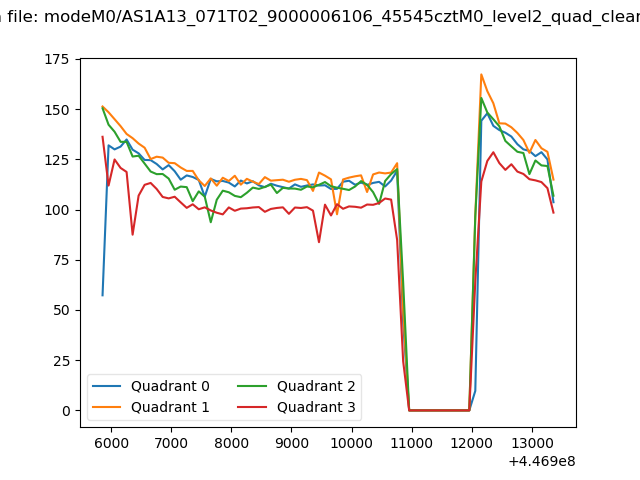 |
|
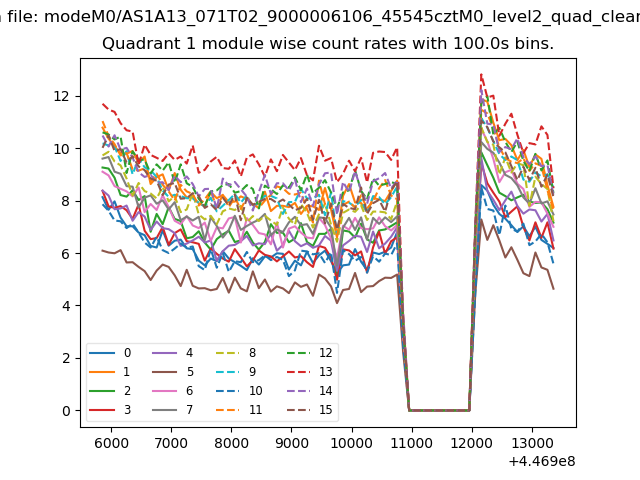
| Module-wise count rates for Quadrant A Data is divided into 100 sec bins |
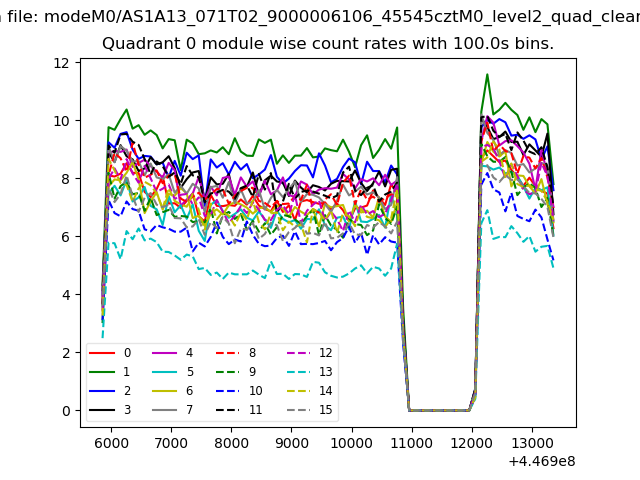 |
 |
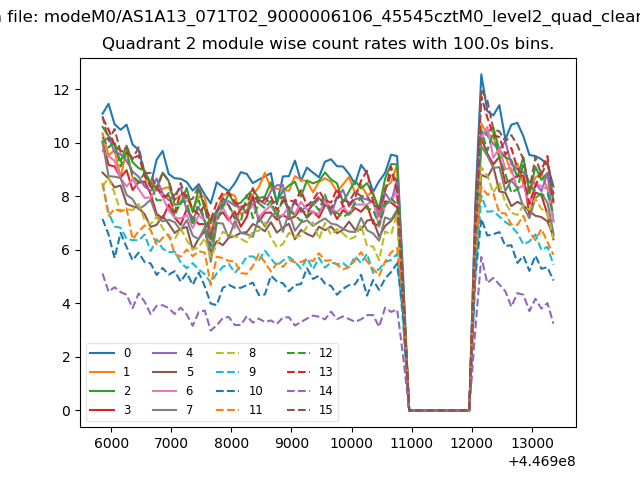
| Module-wise count rates for Quadrant B Data is divided into 100 sec bins |
 |
 |
| Module-wise count rates for Quadrant C Data is divided into 100 sec bins |
 |
 |
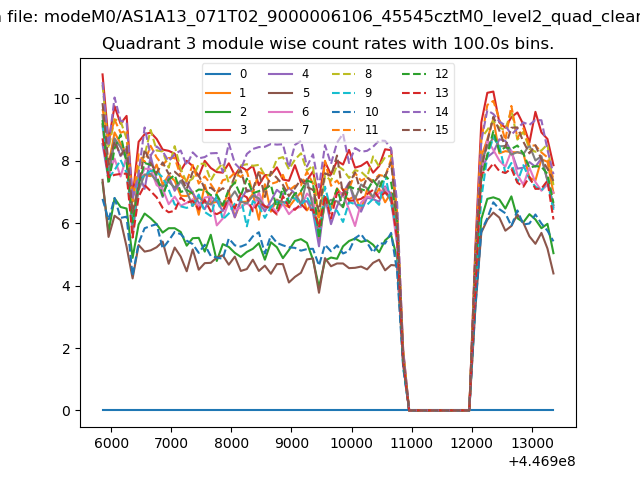
| Module-wise count rates for Quadrant D Data is divided into 100 sec bins |
 |
 |
| Parameter | Plot |
|---|---|
| CZT HV Monitor | 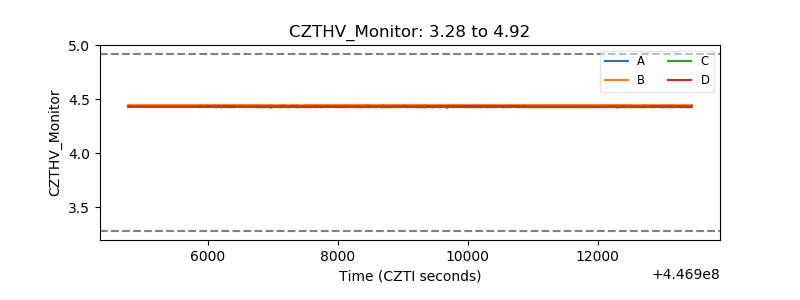 |
| D_VDD | 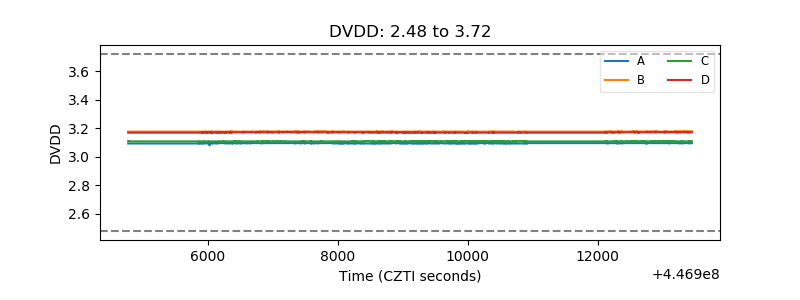 |
| Temperature 1 | 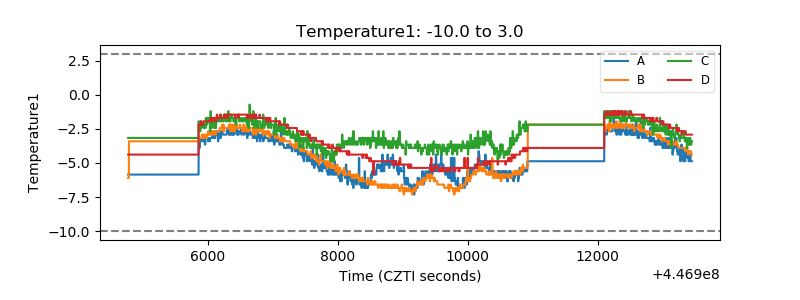 |
| Veto HV Monitor | 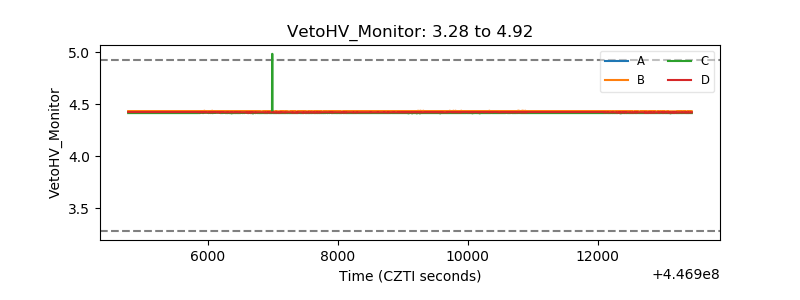 |
| Veto LLD | 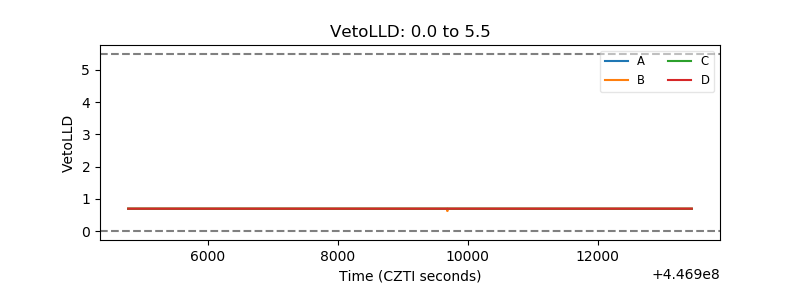 |
| Alpha Counter | 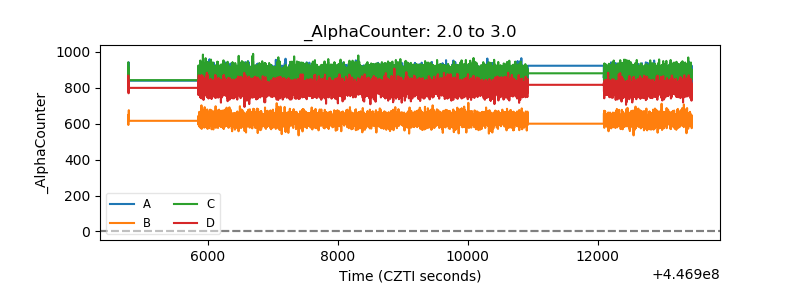 |
| _CPM_Rate | 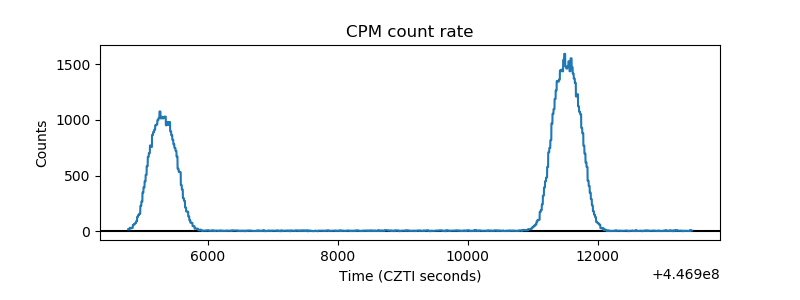 |
| CZT Counter | 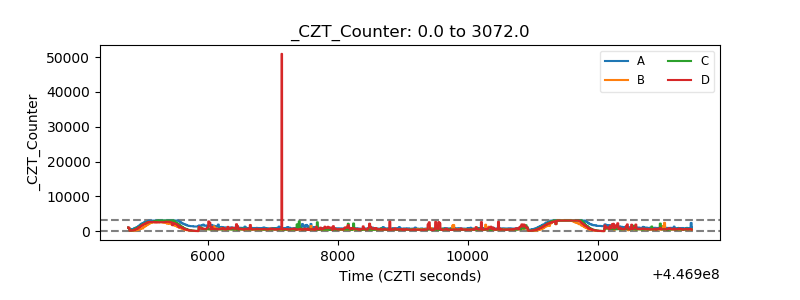 |
| +2.5 Volts monitor |  |
| +5 Volts monitor | 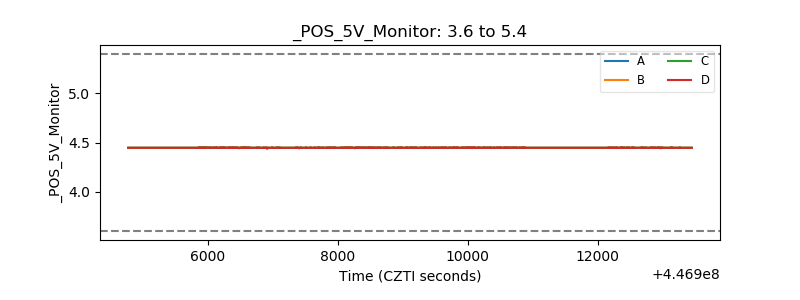 |
| _ROLL_ROT | 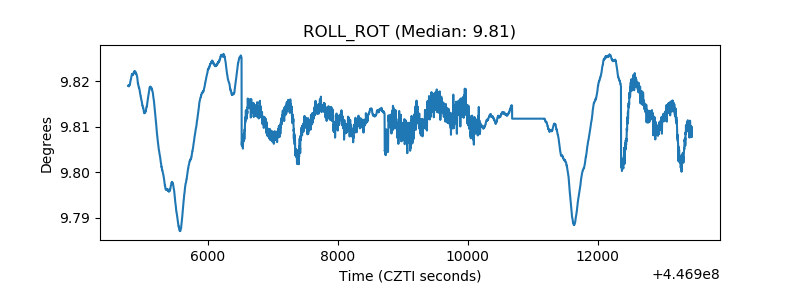 |
| _Roll_DEC | 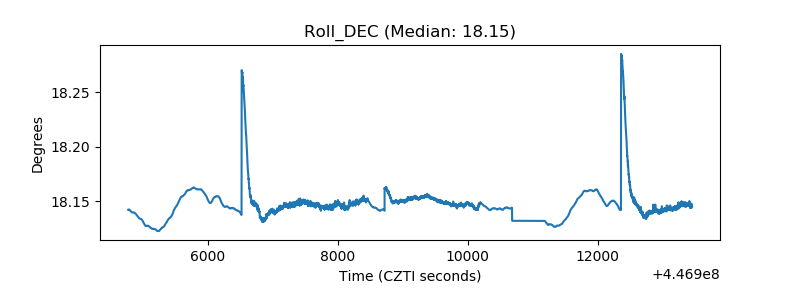 |
| _Roll_RA | 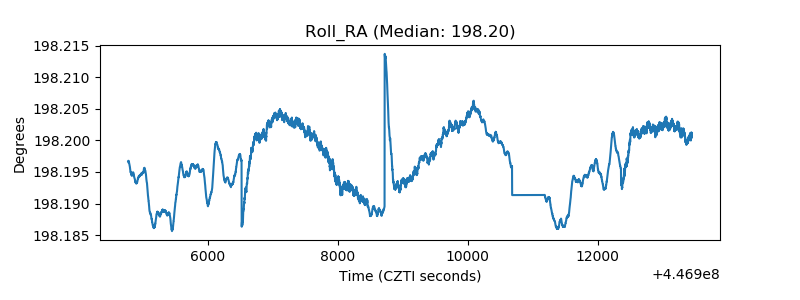 |
| Veto Counter | 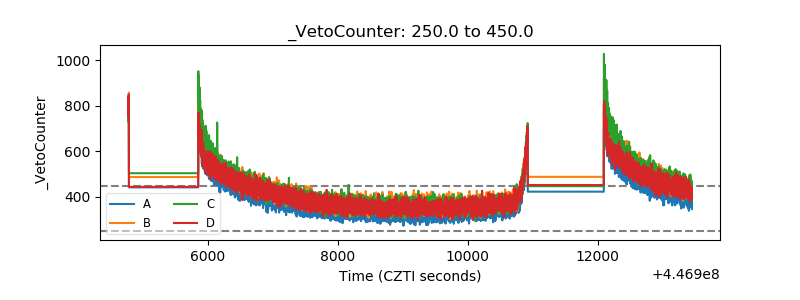 |