| Param | Original file | Final file |
|---|---|---|
| Filename | modeM0/AS1A13_071T02_9000006106_45546cztM0_level2.fits | modeM0/AS1A13_071T02_9000006106_45546cztM0_level2_quad_clean.evt |
| Size (bytes) | 495,495,360 | 116,455,680 |
| Size | 472.5 MB | 111.1 MB |
| Events in quadrant A | 5,880,195 | 773,841 |
| Events in quadrant B | 3,334,838 | 827,254 |
| Events in quadrant C | 3,549,330 | 784,579 |
| Events in quadrant D | 5,075,968 | 690,030 |
| Mode M0 | |||
|---|---|---|---|
| Quadrant | BADHDUFLAG | Total packets | Discarded packets |
| A | 0 | 22013 | 3 |
| B | 0 | 14084 | 2 |
| C | 0 | 14754 | 2 |
| D | 0 | 19485 | 2 |
| Mode SS | |||
|---|---|---|---|
| Quadrant | BADHDUFLAG | Total packets | Discarded packets |
| A | 0 | 132 | 0 |
| B | 0 | 132 | 0 |
| C | 0 | 132 | 0 |
| D | 0 | 132 | 0 |
| Mode M9 | |||
|---|---|---|---|
| Quadrant | BADHDUFLAG | Total packets | Discarded packets |
| A | 0 | 20 | 0 |
| B | 0 | 21 | 0 |
| C | 0 | 21 | 0 |
| D | 0 | 21 | 0 |
| Quadrant | Total seconds | Saturated seconds | Saturation percentage |
|---|---|---|---|
| A | 6462 | 304 | 4.704426% |
| B | 6462 | 115 | 1.779635% |
| C | 6462 | 149 | 2.305788% |
| D | 6462 | 411 | 6.360260% |
Noise dominated data is calculated using 1-second bins in cleaned event files. If a bin has >2000 counts, and if more than 50% of those come from <1% of pixels, then it is considered to be noise-dominated and hence unusable.
| Quadrant | # 1 sec bins | Bins with >0 counts | Bins with >2000 counts | High rate bins dominated by noise | Noise dominated (total time) | Noise dominated (detector-on time) | Marked lightcurve |
|---|---|---|---|---|---|---|---|
| A | 7662 | 6463 | 28 | 28 | 0.37% | 0.43% | 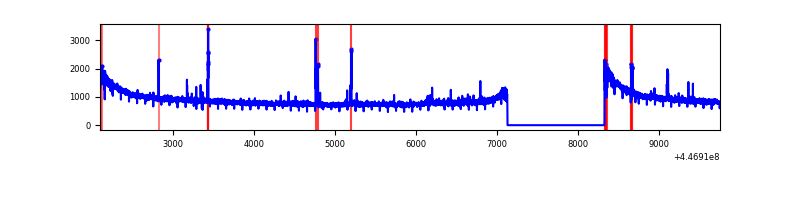 |
| B | 7662 | 6463 | 8 | 8 | 0.10% | 0.12% | 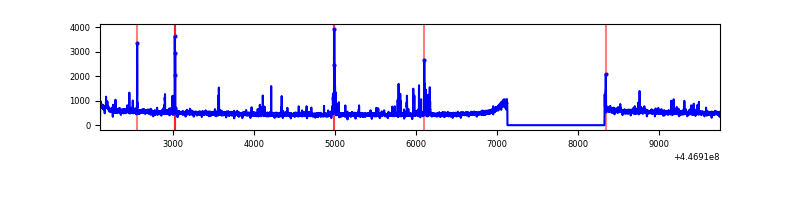 |
| C | 7662 | 6463 | 71 | 71 | 0.93% | 1.10% | 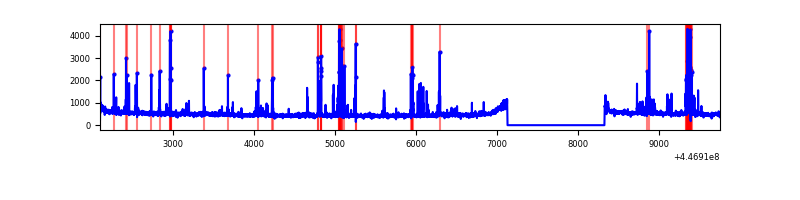 |
| D | 7662 | 6463 | 237 | 237 | 3.09% | 3.67% | 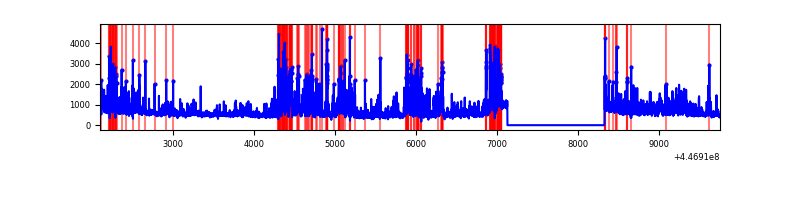 |
Top three noisy pixels from each quadrant. If the there are fewer than three noisy pixels in the level2.evt file, extra rows are filled as -1
| Pixel properties | Quadrant properties | ||||||
|---|---|---|---|---|---|---|---|
| Quadrant | DetID | PixID | Counts | Sigma | Mean | Median | Sigma |
| A | 10 | 83 | 2684553 | 16204.8 | 797 | 778 | 165.6 |
| A | 2 | 79 | 88258 | 528.21 | 797 | 778 | 165.6 |
| A | 13 | 248 | 22120 | 128.86 | 797 | 778 | 165.6 |
| B | 5 | 172 | 91483 | 581.3 | 802 | 780 | 156.0 |
| B | 0 | 186 | 28734 | 179.15 | 802 | 780 | 156.0 |
| B | 12 | 111 | 19674 | 121.09 | 802 | 780 | 156.0 |
| C | 14 | 254 | 418097 | 2250.01 | 795 | 801 | 185.5 |
| C | 1 | 3 | 20124 | 104.19 | 795 | 801 | 185.5 |
| C | 12 | 249 | 5981 | 27.93 | 795 | 801 | 185.5 |
| D | 1 | 52 | 781798 | 4010.11 | 776 | 752 | 194.8 |
| D | 13 | 249 | 721832 | 3702.22 | 776 | 752 | 194.8 |
| D | 6 | 239 | 242153 | 1239.42 | 776 | 752 | 194.8 |
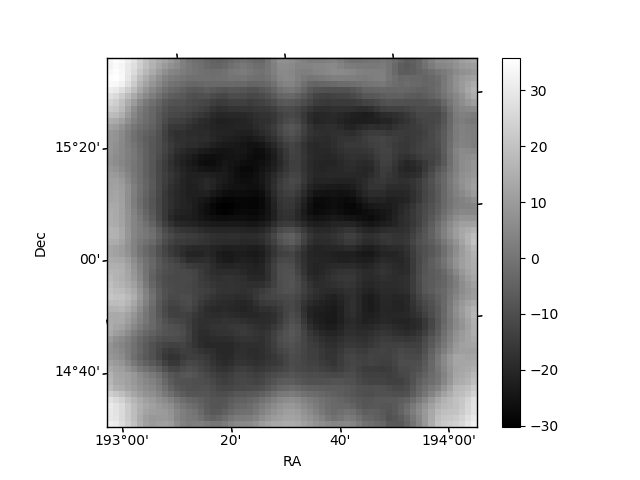
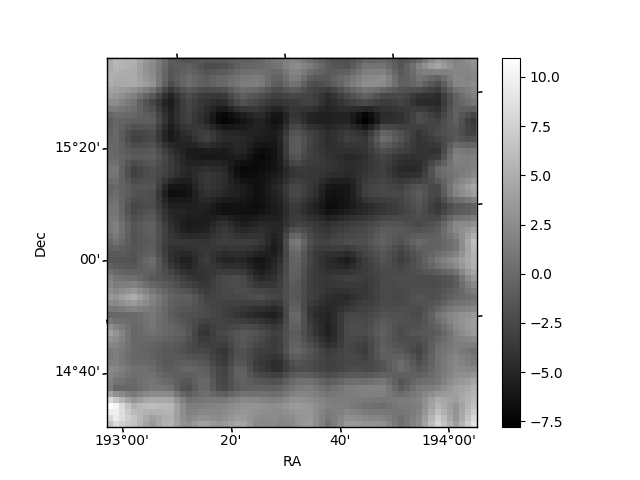
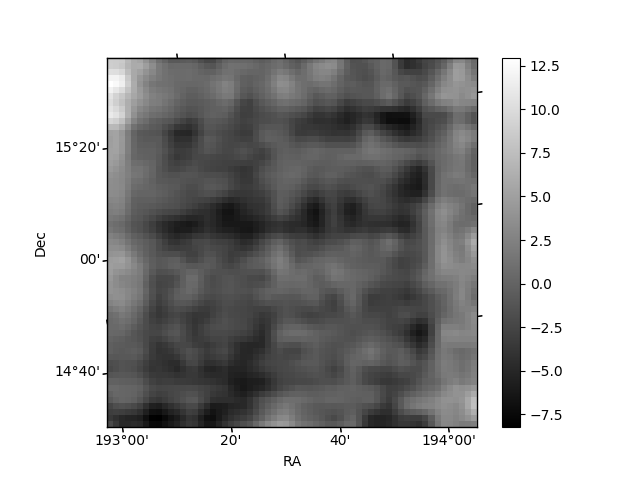
Histogram calculated using DETX and DETY for each event in the final _common_clean file
| Quadrant A | 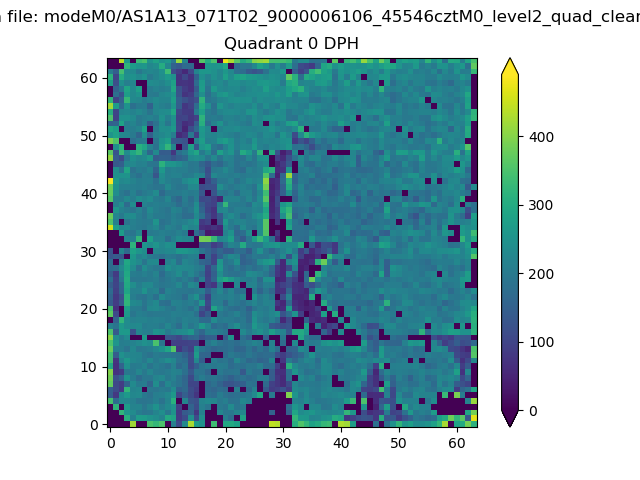 |
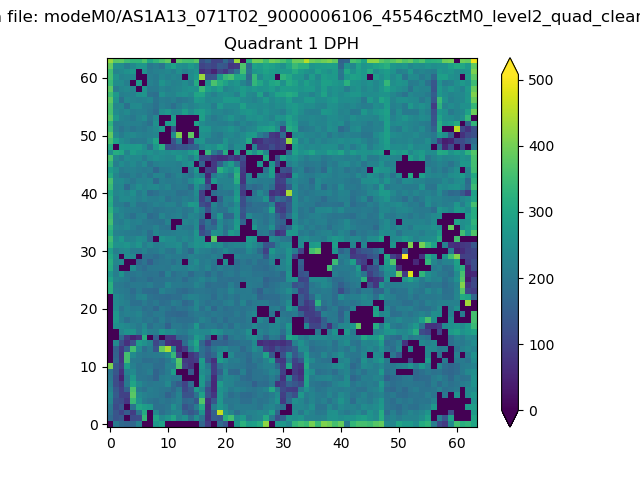 |
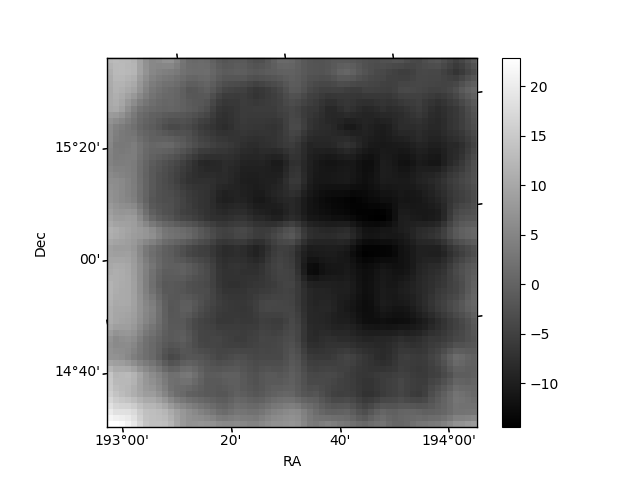
Quadrant B |
|---|---|---|---|
| Quadrant D | 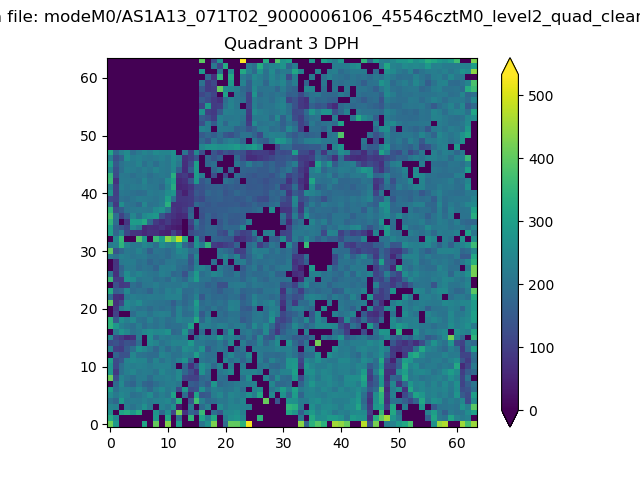 |
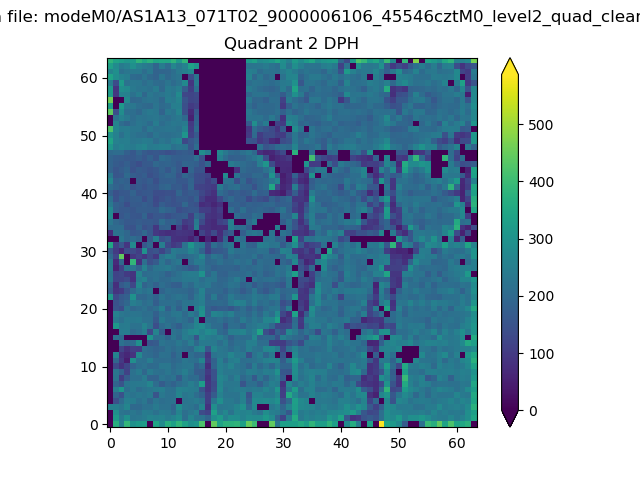 |
Quadrant C |
| Plot type | Count rate plots | Images |
|---|---|---|
| Comparison with Poisson distribution Blue bars denote a histogram of data divided into 1 sec bins. Red curve is a Poisson curve with rate = median count rate of data. |
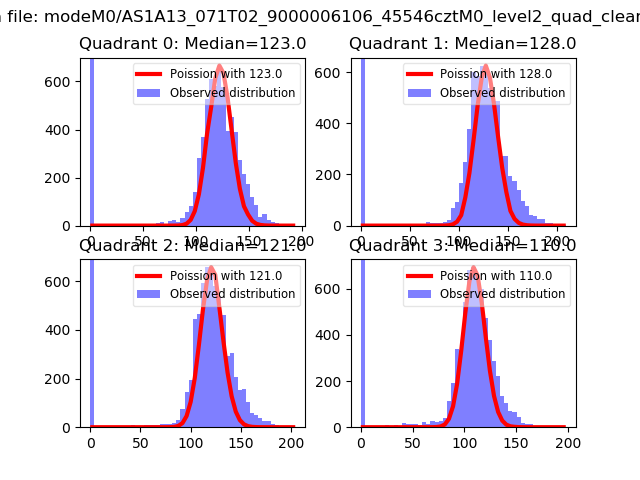 |
 |
| Quadrant-wise count rates Data is divided into 100 sec bins |
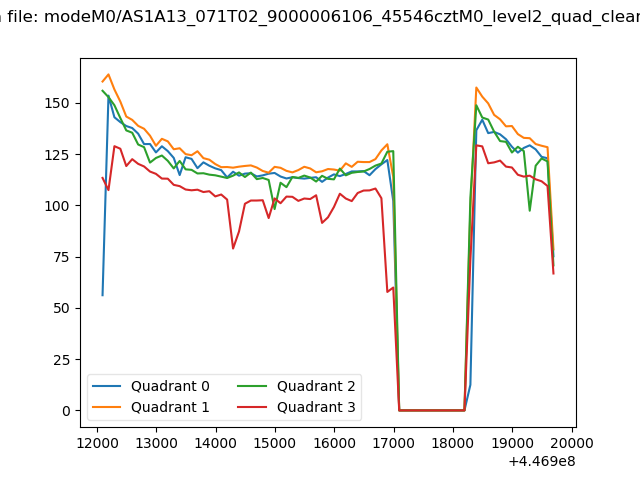 |
|
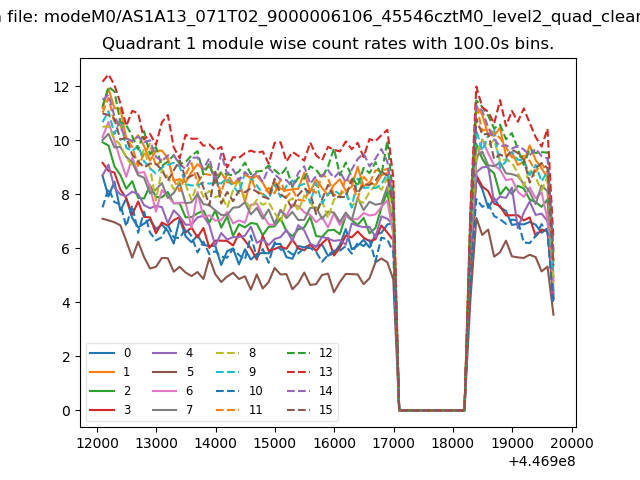
| Module-wise count rates for Quadrant A Data is divided into 100 sec bins |
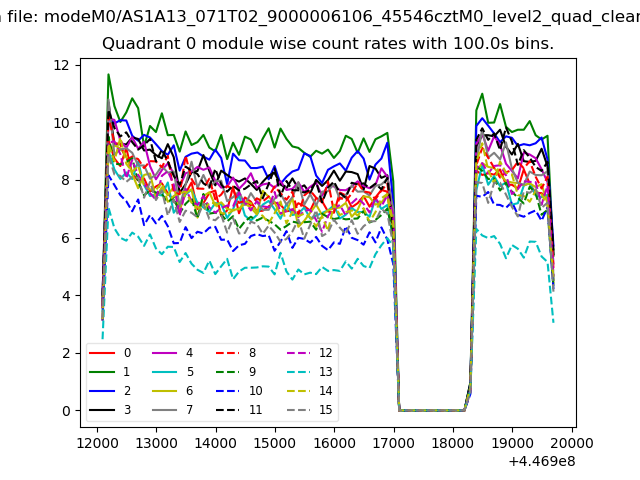 |
 |
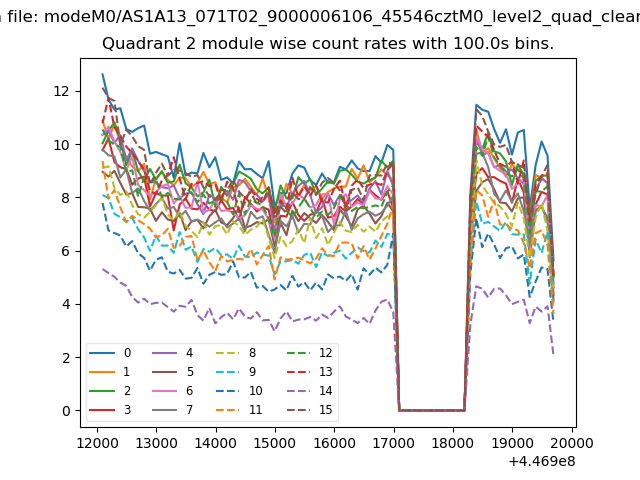
| Module-wise count rates for Quadrant B Data is divided into 100 sec bins |
 |
 |
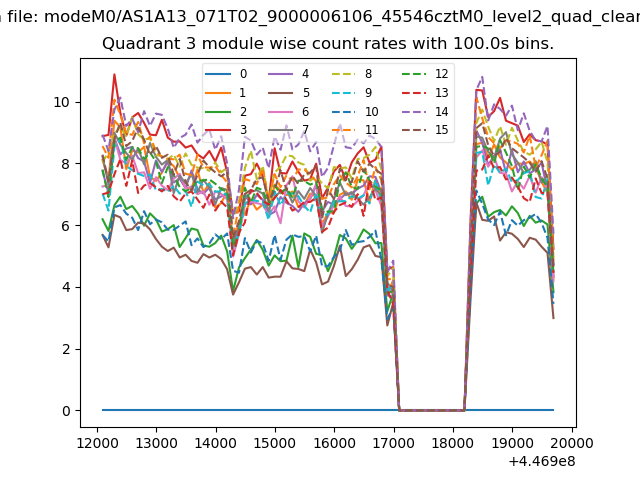
| Module-wise count rates for Quadrant C Data is divided into 100 sec bins |
 |
 |
| Module-wise count rates for Quadrant D Data is divided into 100 sec bins |
 |
 |
| Parameter | Plot |
|---|---|
| CZT HV Monitor | 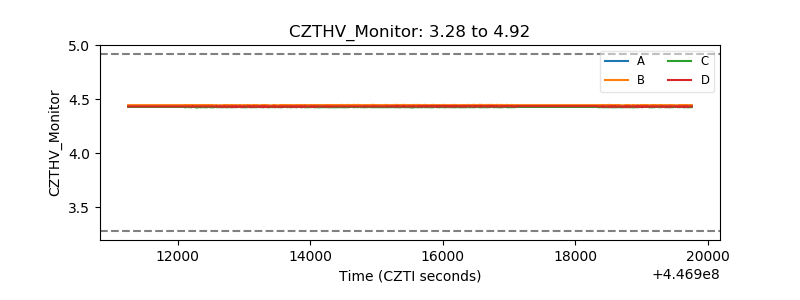 |
| D_VDD | 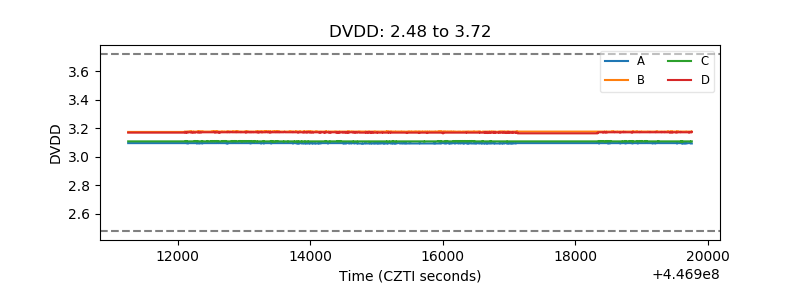 |
| Temperature 1 | 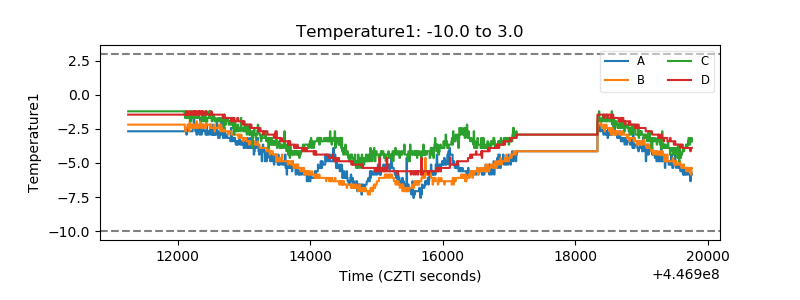 |
| Veto HV Monitor | 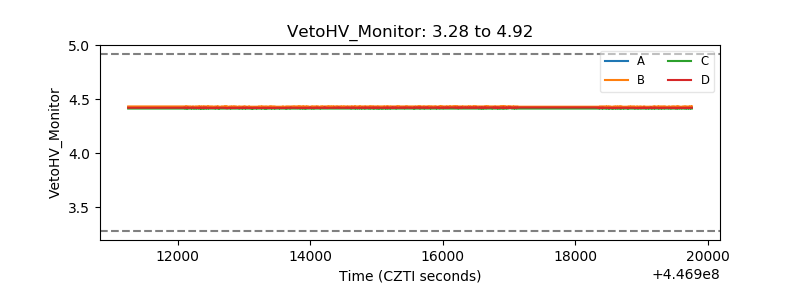 |
| Veto LLD | 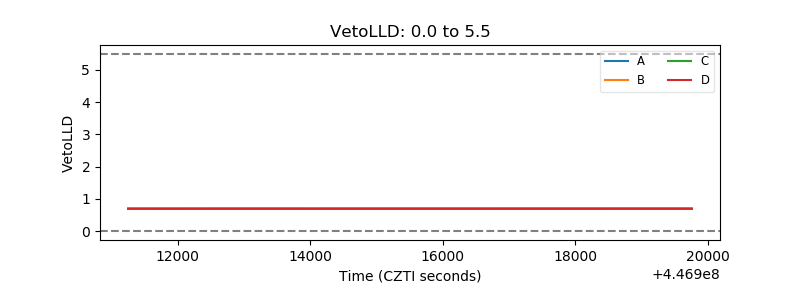 |
| Alpha Counter | 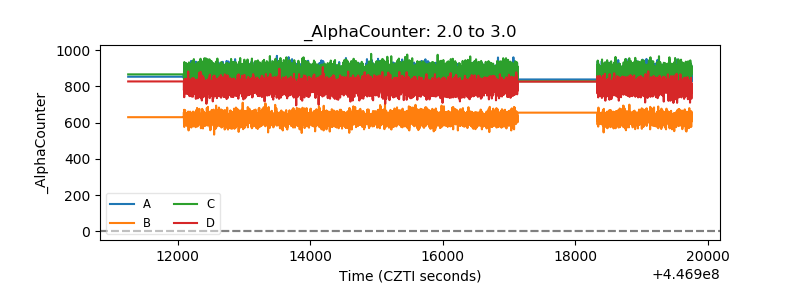 |
| _CPM_Rate | 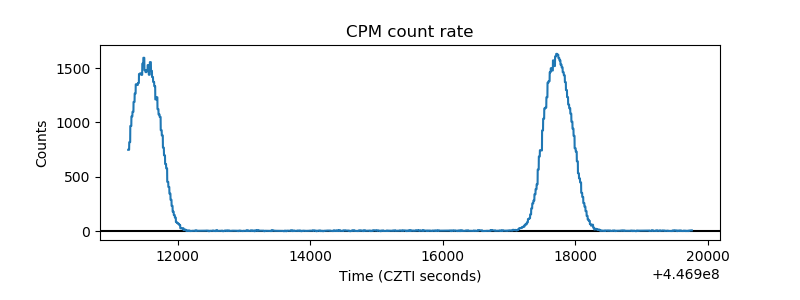 |
| CZT Counter | 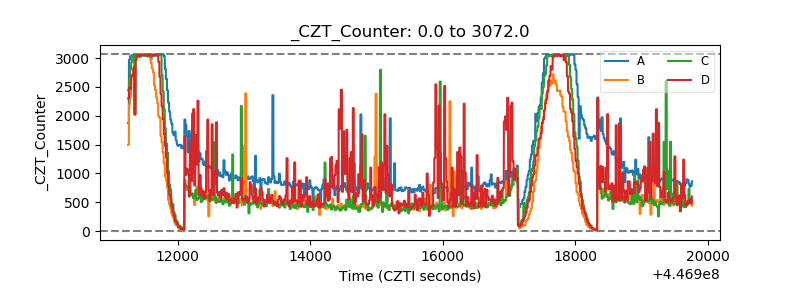 |
| +2.5 Volts monitor |  |
| +5 Volts monitor | 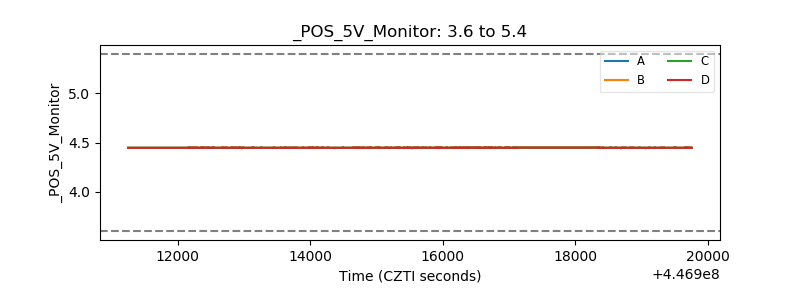 |
| _ROLL_ROT | 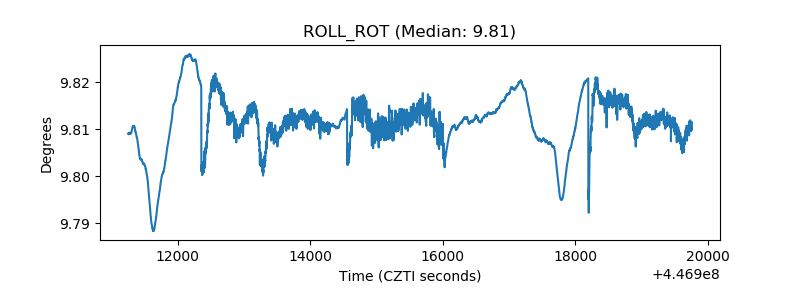 |
| _Roll_DEC | 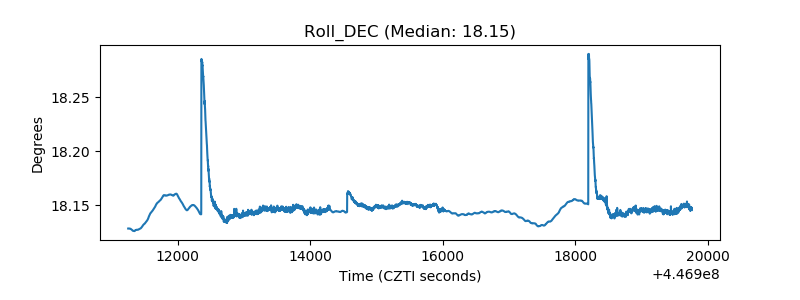 |
| _Roll_RA | 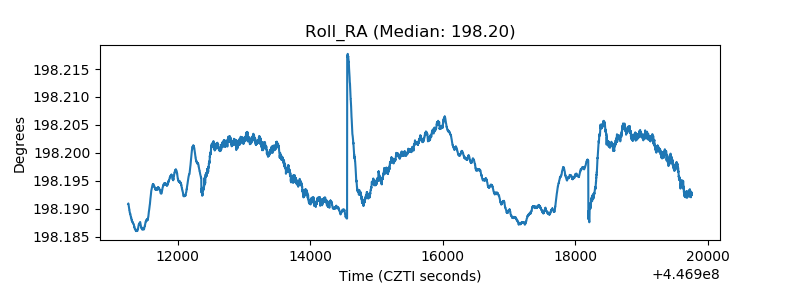 |
| Veto Counter | 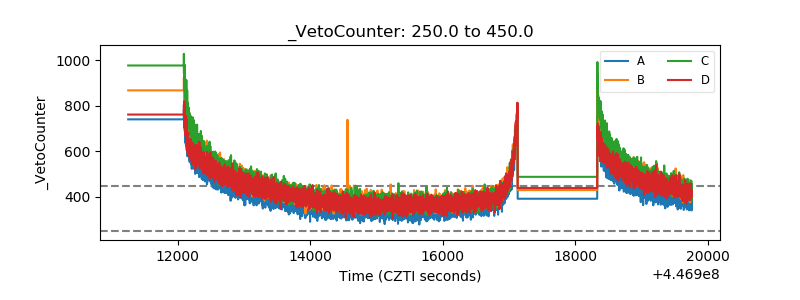 |