| Param | Original file | Final file |
|---|---|---|
| Filename | modeM0/AS1A13_071T02_9000006106_45547cztM0_level2.fits | modeM0/AS1A13_071T02_9000006106_45547cztM0_level2_quad_clean.evt |
| Size (bytes) | 461,877,120 | 109,589,760 |
| Size | 440.5 MB | 104.5 MB |
| Events in quadrant A | 5,526,828 | 735,089 |
| Events in quadrant B | 3,869,708 | 748,094 |
| Events in quadrant C | 3,137,528 | 741,002 |
| Events in quadrant D | 4,083,535 | 663,629 |
| Mode M0 | |||
|---|---|---|---|
| Quadrant | BADHDUFLAG | Total packets | Discarded packets |
| A | 0 | 20926 | 1 |
| B | 0 | 15658 | 1 |
| C | 0 | 13388 | 1 |
| D | 0 | 16309 | 1 |
| Mode SS | |||
|---|---|---|---|
| Quadrant | BADHDUFLAG | Total packets | Discarded packets |
| A | 0 | 124 | 0 |
| B | 0 | 124 | 0 |
| C | 0 | 124 | 0 |
| D | 0 | 124 | 0 |
| Mode M9 | |||
|---|---|---|---|
| Quadrant | BADHDUFLAG | Total packets | Discarded packets |
| A | 0 | 13 | 0 |
| B | 0 | 13 | 0 |
| C | 0 | 13 | 0 |
| D | 0 | 13 | 0 |
| Quadrant | Total seconds | Saturated seconds | Saturation percentage |
|---|---|---|---|
| A | 6176 | 229 | 3.707902% |
| B | 6176 | 304 | 4.922280% |
| C | 6176 | 69 | 1.117228% |
| D | 6176 | 185 | 2.995466% |
Noise dominated data is calculated using 1-second bins in cleaned event files. If a bin has >2000 counts, and if more than 50% of those come from <1% of pixels, then it is considered to be noise-dominated and hence unusable.
| Quadrant | # 1 sec bins | Bins with >0 counts | Bins with >2000 counts | High rate bins dominated by noise | Noise dominated (total time) | Noise dominated (detector-on time) | Marked lightcurve |
|---|---|---|---|---|---|---|---|
| A | 7416 | 6177 | 34 | 34 | 0.46% | 0.55% | 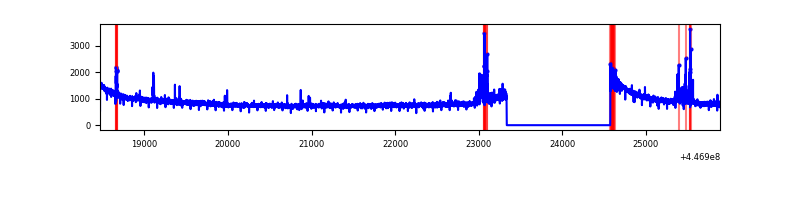 |
| B | 7416 | 6177 | 150 | 150 | 2.02% | 2.43% | 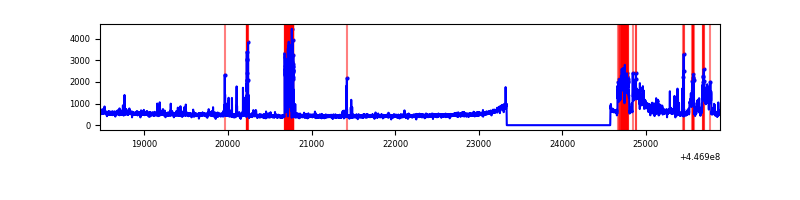 |
| C | 7416 | 6177 | 38 | 38 | 0.51% | 0.62% | 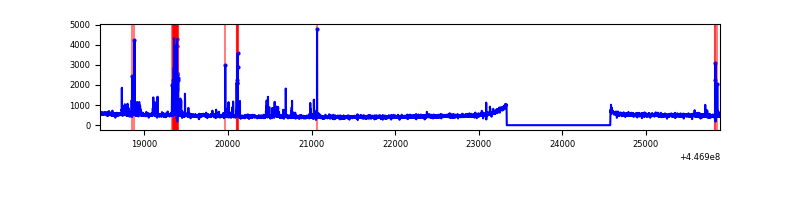 |
| D | 7416 | 6177 | 126 | 126 | 1.70% | 2.04% | 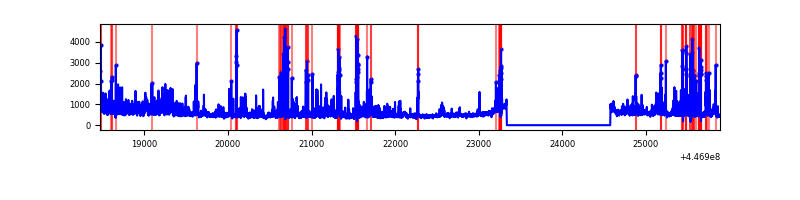 |
Top three noisy pixels from each quadrant. If the there are fewer than three noisy pixels in the level2.evt file, extra rows are filled as -1
| Pixel properties | Quadrant properties | ||||||
|---|---|---|---|---|---|---|---|
| Quadrant | DetID | PixID | Counts | Sigma | Mean | Median | Sigma |
| A | 10 | 83 | 2456550 | 16000.22 | 741 | 726 | 153.5 |
| A | 13 | 248 | 154451 | 1001.55 | 741 | 726 | 153.5 |
| A | 2 | 79 | 47792 | 306.65 | 741 | 726 | 153.5 |
| B | 15 | 201 | 815261 | 5643.75 | 738 | 716 | 144.3 |
| B | 5 | 172 | 92696 | 637.3 | 738 | 716 | 144.3 |
| B | 7 | 221 | 20025 | 133.79 | 738 | 716 | 144.3 |
| C | 14 | 254 | 238558 | 1367.64 | 740 | 747 | 173.9 |
| C | 1 | 3 | 7398 | 38.25 | 740 | 747 | 173.9 |
| C | 13 | 61 | 4798 | 23.3 | 740 | 747 | 173.9 |
| D | 1 | 52 | 430753 | 2389.8 | 728 | 708 | 179.9 |
| D | 13 | 249 | 398314 | 2209.54 | 728 | 708 | 179.9 |
| D | 6 | 239 | 110669 | 611.06 | 728 | 708 | 179.9 |
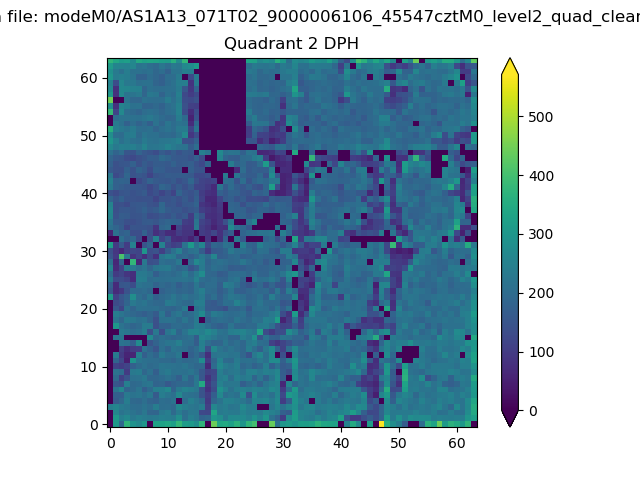
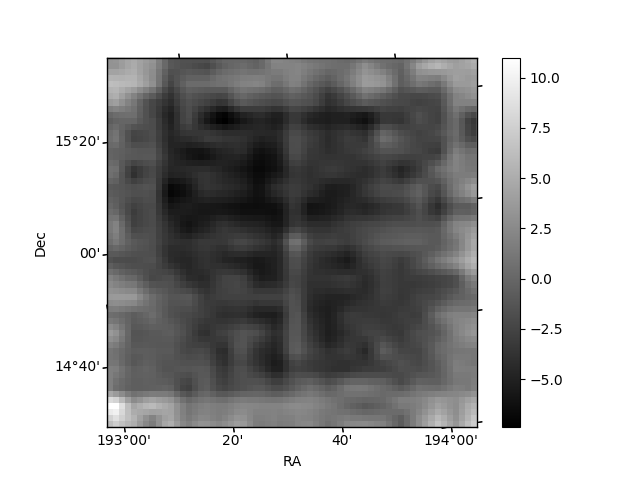
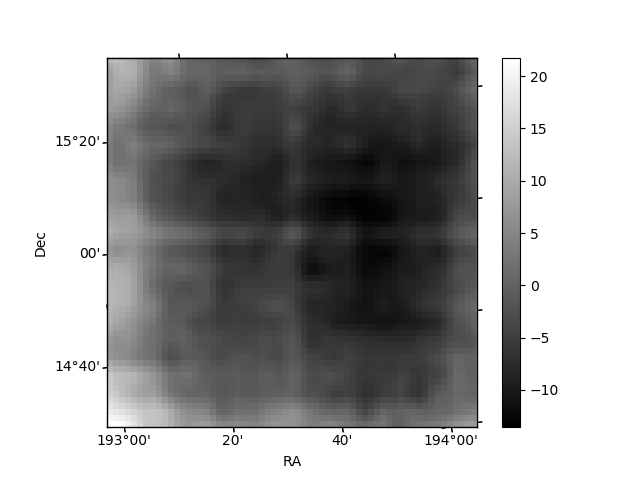
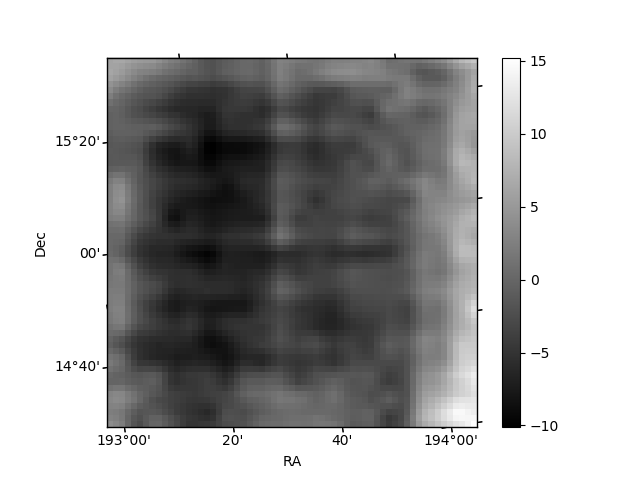
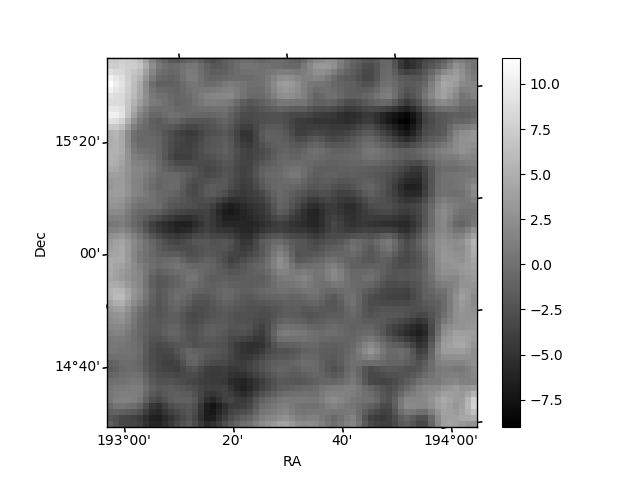
Histogram calculated using DETX and DETY for each event in the final _common_clean file
| Quadrant A | 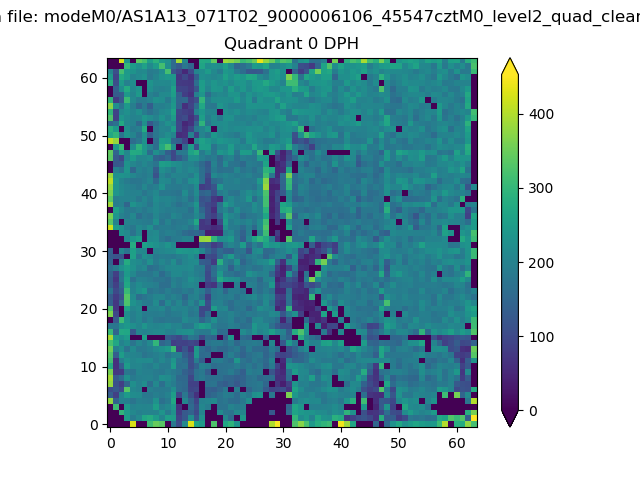 |
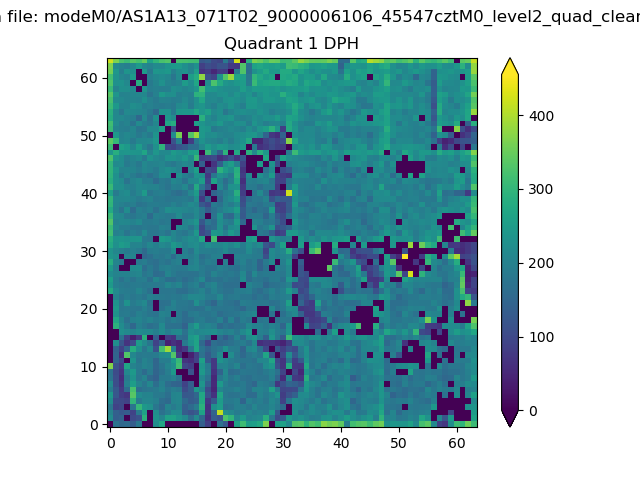 |
Quadrant B |
|---|---|---|---|
| Quadrant D | 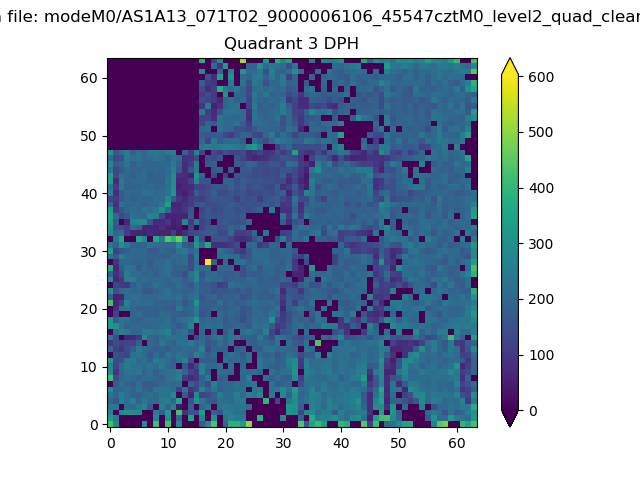 |
 |
Quadrant C |
| Plot type | Count rate plots | Images |
|---|---|---|
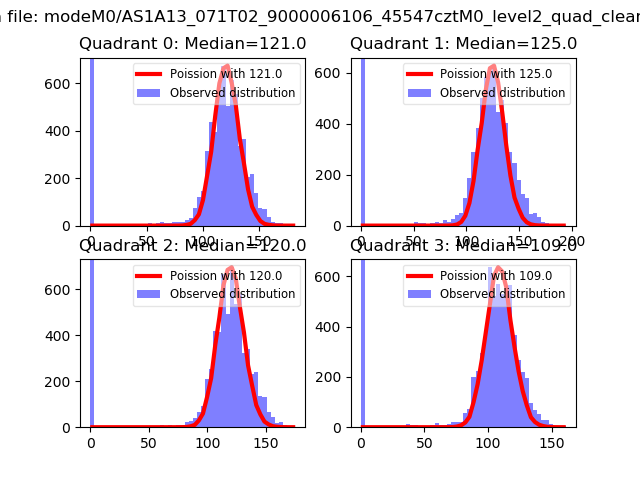
| Comparison with Poisson distribution Blue bars denote a histogram of data divided into 1 sec bins. Red curve is a Poisson curve with rate = median count rate of data. |
 |
 |
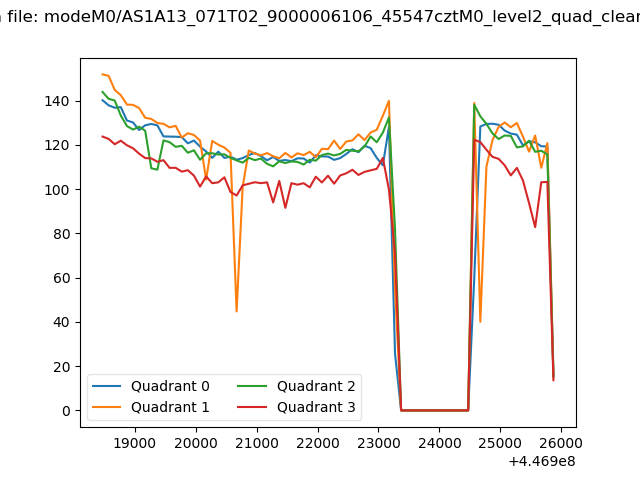
| Quadrant-wise count rates Data is divided into 100 sec bins |
 |
|
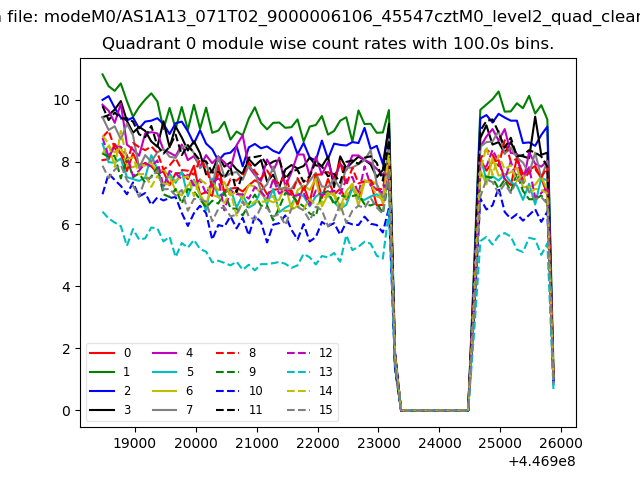
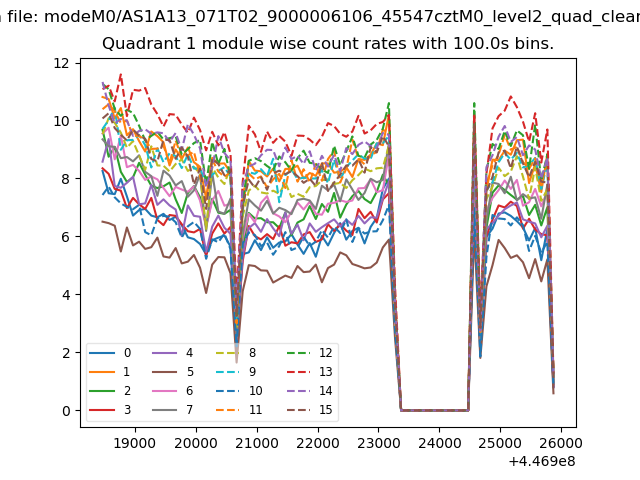
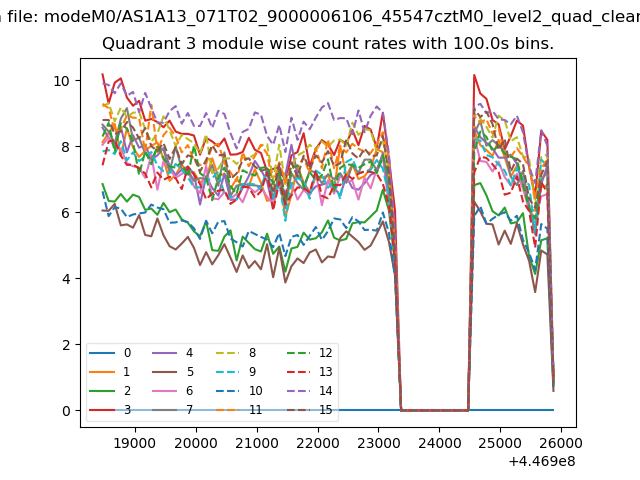
| Module-wise count rates for Quadrant A Data is divided into 100 sec bins |
 |
 |
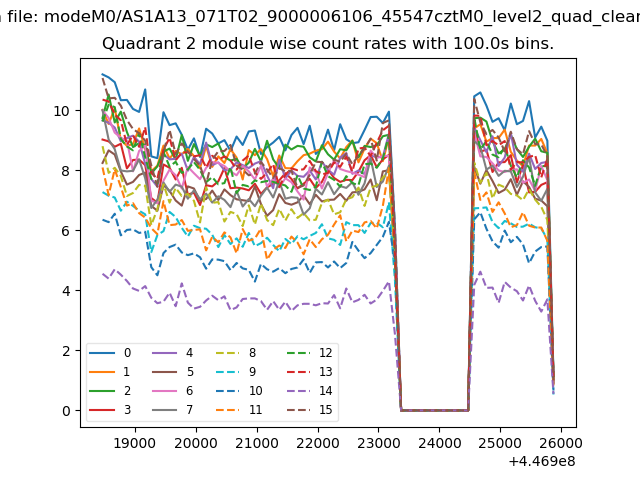
| Module-wise count rates for Quadrant B Data is divided into 100 sec bins |
 |
 |
| Module-wise count rates for Quadrant C Data is divided into 100 sec bins |
 |
 |
| Module-wise count rates for Quadrant D Data is divided into 100 sec bins |
 |
 |
| Parameter | Plot |
|---|---|
| CZT HV Monitor | 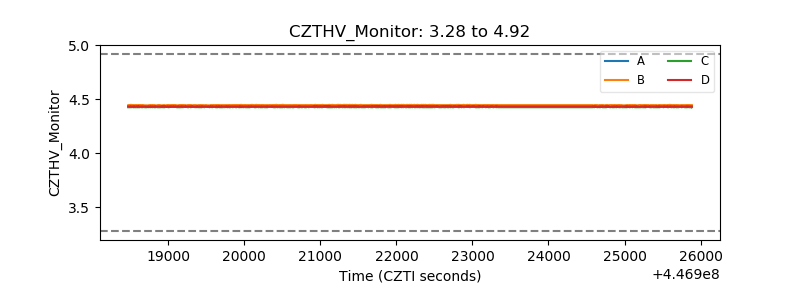 |
| D_VDD | 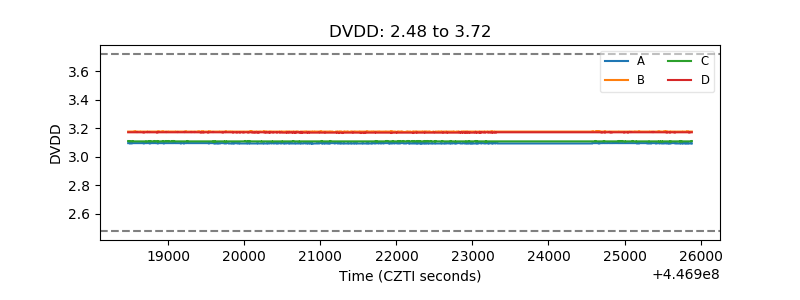 |
| Temperature 1 | 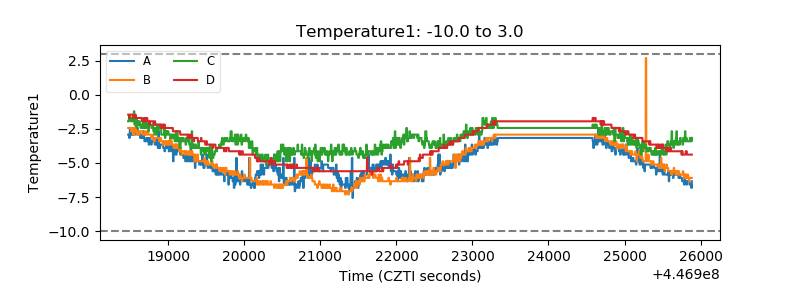 |
| Veto HV Monitor |  |
| Veto LLD | 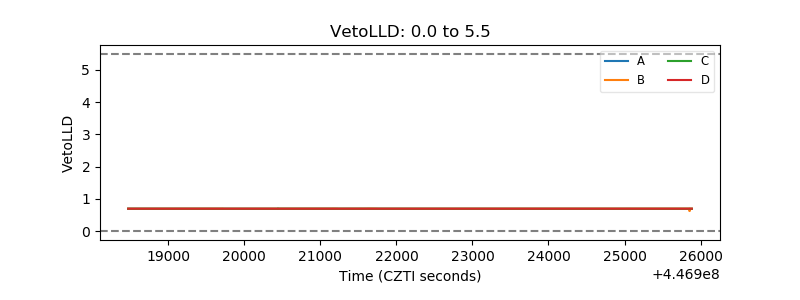 |
| Alpha Counter | 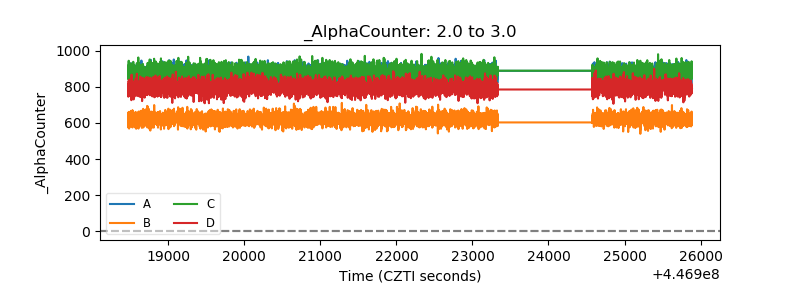 |
| _CPM_Rate | 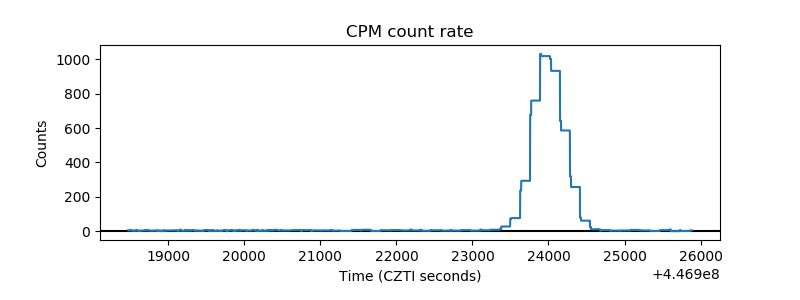 |
| CZT Counter | 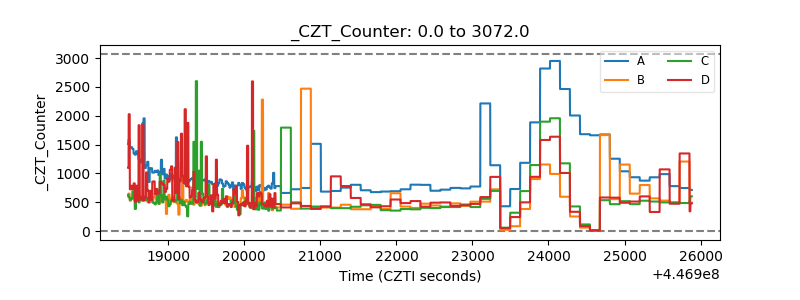 |
| +2.5 Volts monitor |  |
| +5 Volts monitor | 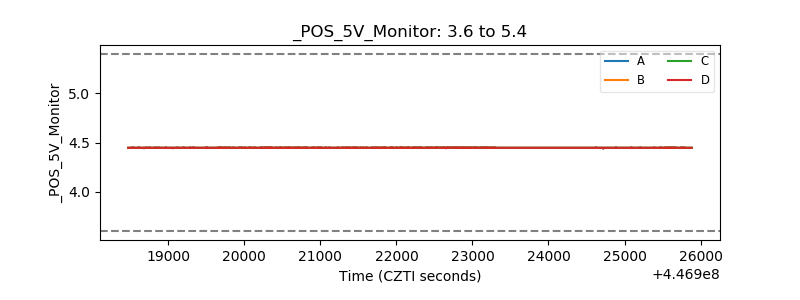 |
| _ROLL_ROT | 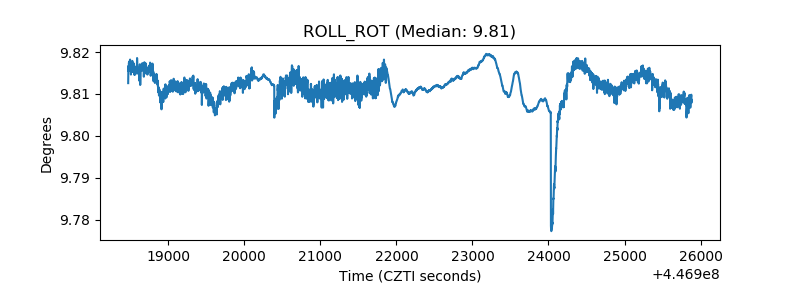 |
| _Roll_DEC | 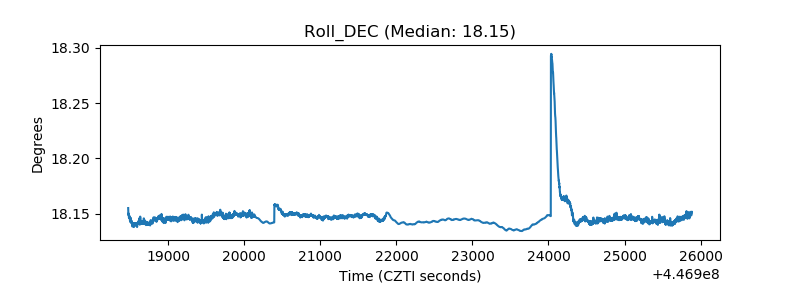 |
| _Roll_RA | 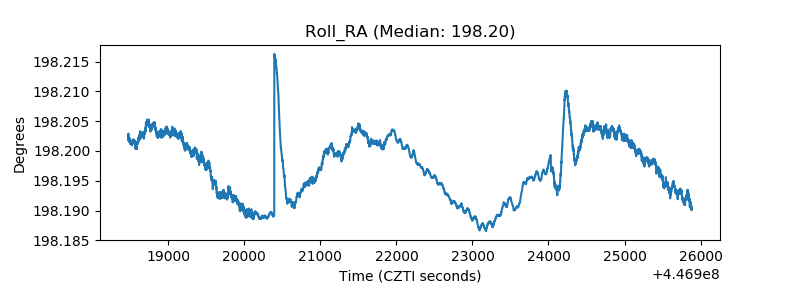 |
| Veto Counter | 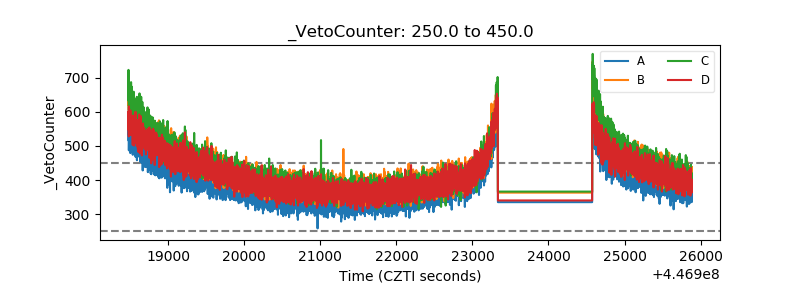 |