| Param | Original file | Final file |
|---|---|---|
| Filename | modeM0/AS1A13_071T02_9000006106_45550cztM0_level2.fits | modeM0/AS1A13_071T02_9000006106_45550cztM0_level2_quad_clean.evt |
| Size (bytes) | 482,670,720 | 111,548,160 |
| Size | 460.3 MB | 106.4 MB |
| Events in quadrant A | 5,890,568 | 738,301 |
| Events in quadrant B | 3,584,840 | 769,640 |
| Events in quadrant C | 3,464,019 | 743,974 |
| Events in quadrant D | 4,399,917 | 652,740 |
| Mode M0 | |||
|---|---|---|---|
| Quadrant | BADHDUFLAG | Total packets | Discarded packets |
| A | 0 | 22552 | 2 |
| B | 0 | 15379 | 2 |
| C | 0 | 15086 | 2 |
| D | 0 | 17767 | 2 |
| Mode SS | |||
|---|---|---|---|
| Quadrant | BADHDUFLAG | Total packets | Discarded packets |
| A | 0 | 136 | 0 |
| B | 0 | 136 | 0 |
| C | 0 | 136 | 0 |
| D | 0 | 136 | 0 |
| Mode M9 | |||
|---|---|---|---|
| Quadrant | BADHDUFLAG | Total packets | Discarded packets |
| A | 0 | 9 | 0 |
| B | 0 | 9 | 0 |
| C | 0 | 9 | 0 |
| D | 0 | 9 | 0 |
| Quadrant | Total seconds | Saturated seconds | Saturation percentage |
|---|---|---|---|
| A | 6793 | 269 | 3.959959% |
| B | 6793 | 182 | 2.679229% |
| C | 6794 | 95 | 1.398293% |
| D | 6794 | 365 | 5.372387% |
Noise dominated data is calculated using 1-second bins in cleaned event files. If a bin has >2000 counts, and if more than 50% of those come from <1% of pixels, then it is considered to be noise-dominated and hence unusable.
| Quadrant | # 1 sec bins | Bins with >0 counts | Bins with >2000 counts | High rate bins dominated by noise | Noise dominated (total time) | Noise dominated (detector-on time) | Marked lightcurve |
|---|---|---|---|---|---|---|---|
| A | 7658 | 6794 | 52 | 52 | 0.68% | 0.77% | 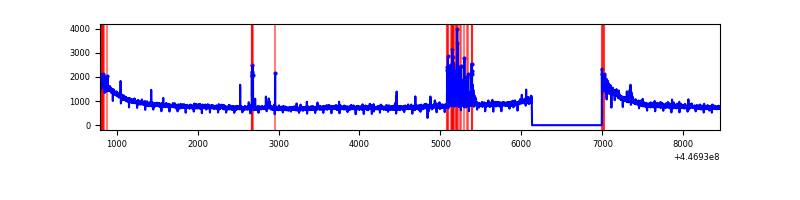 |
| B | 7658 | 6794 | 105 | 105 | 1.37% | 1.55% | 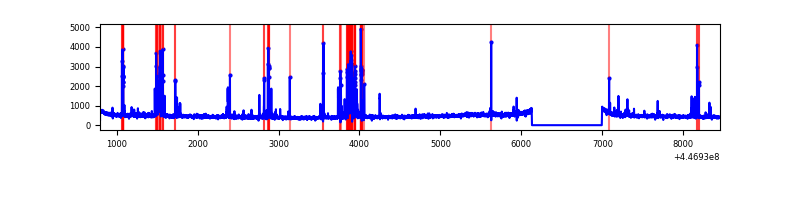 |
| C | 7659 | 6795 | 50 | 50 | 0.65% | 0.74% | 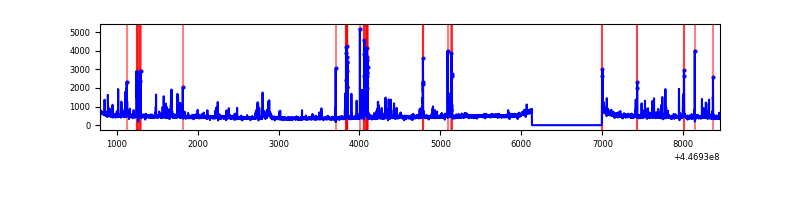 |
| D | 7659 | 6795 | 282 | 282 | 3.68% | 4.15% | 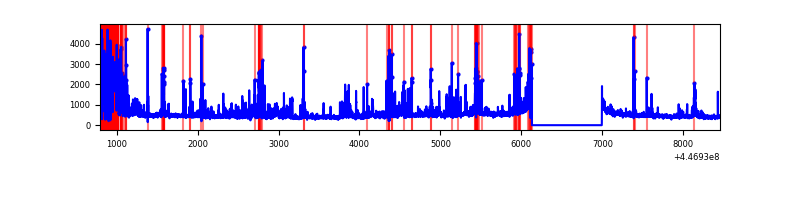 |
Top three noisy pixels from each quadrant. If the there are fewer than three noisy pixels in the level2.evt file, extra rows are filled as -1
| Pixel properties | Quadrant properties | ||||||
|---|---|---|---|---|---|---|---|
| Quadrant | DetID | PixID | Counts | Sigma | Mean | Median | Sigma |
| A | 10 | 83 | 2711788 | 16752.39 | 769 | 752 | 161.8 |
| A | 13 | 248 | 168601 | 1037.19 | 769 | 752 | 161.8 |
| A | 2 | 79 | 30617 | 184.55 | 769 | 752 | 161.8 |
| B | 5 | 172 | 480786 | 3141.92 | 772 | 747 | 152.8 |
| B | 12 | 111 | 19493 | 122.69 | 772 | 747 | 152.8 |
| B | 11 | 111 | 18010 | 112.99 | 772 | 747 | 152.8 |
| C | 14 | 254 | 427819 | 2333.61 | 768 | 773 | 183.0 |
| C | 1 | 3 | 23454 | 123.94 | 768 | 773 | 183.0 |
| C | 11 | 16 | 11886 | 60.73 | 768 | 773 | 183.0 |
| D | 13 | 249 | 690218 | 3681.47 | 738 | 715 | 187.3 |
| D | 1 | 52 | 319461 | 1701.89 | 738 | 715 | 187.3 |
| D | 11 | 192 | 143134 | 760.42 | 738 | 715 | 187.3 |
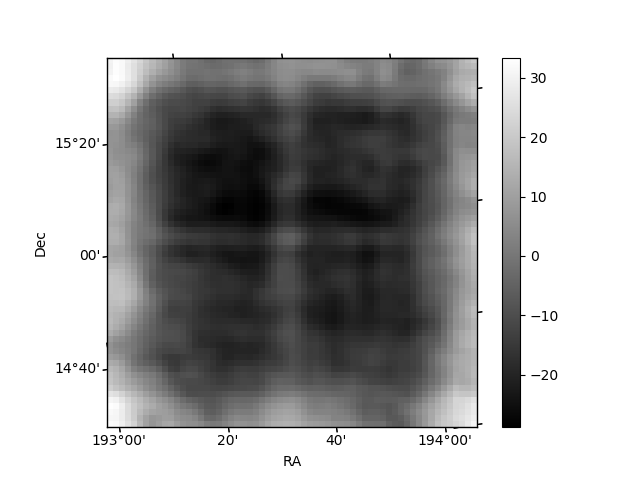
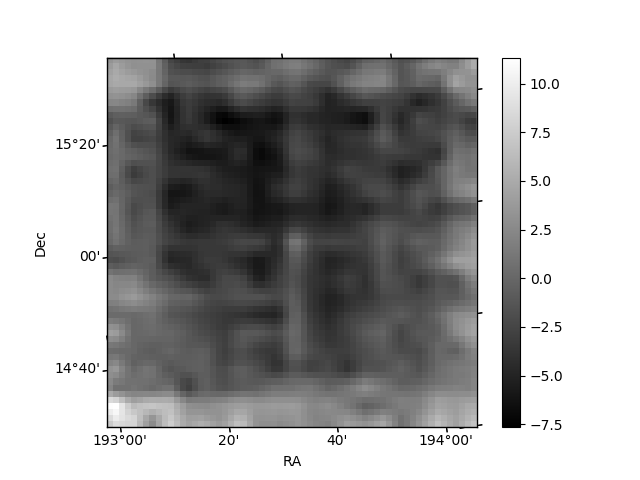
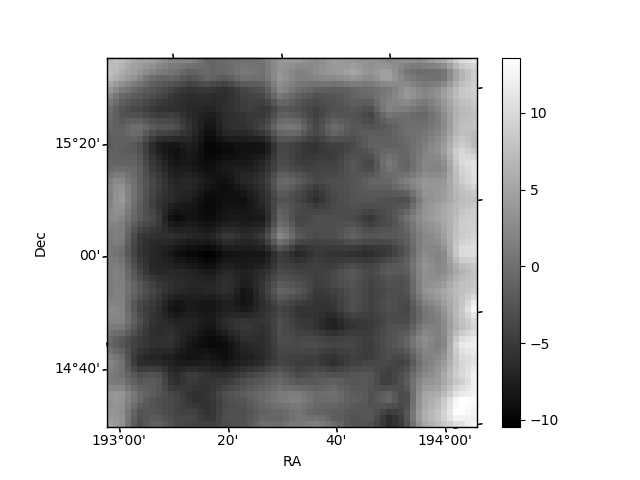
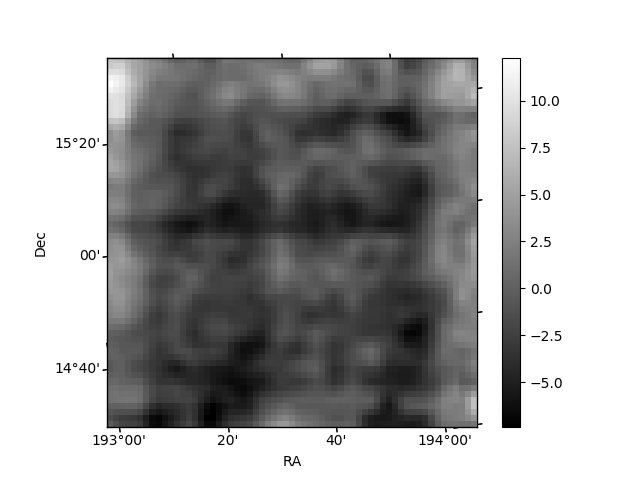
Histogram calculated using DETX and DETY for each event in the final _common_clean file
| Quadrant A | 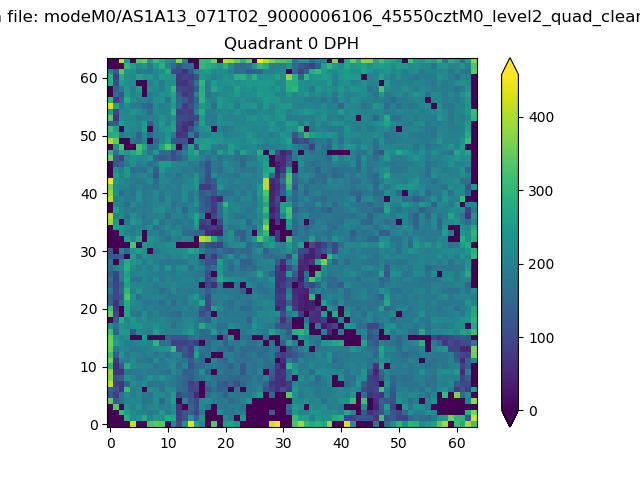 |
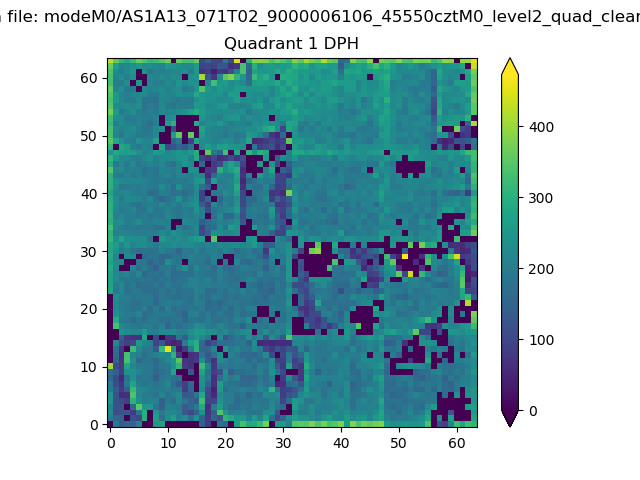 |
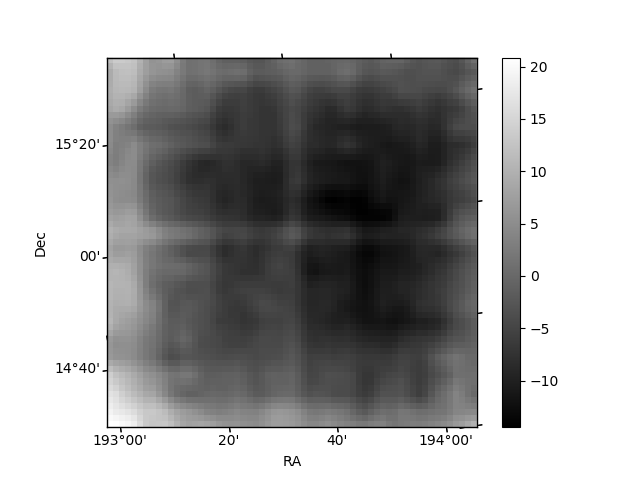
Quadrant B |
|---|---|---|---|
| Quadrant D | 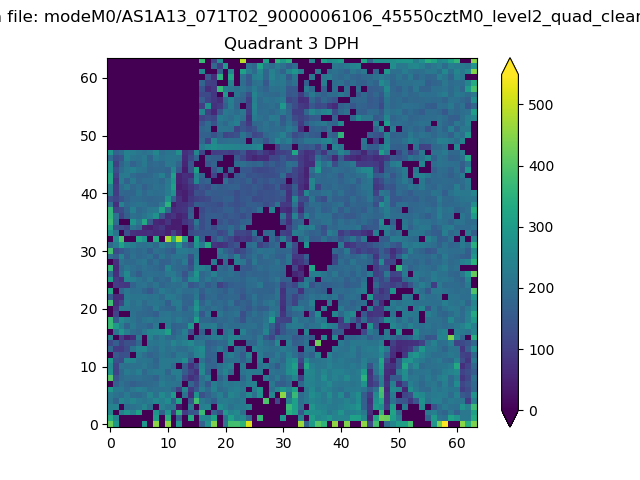 |
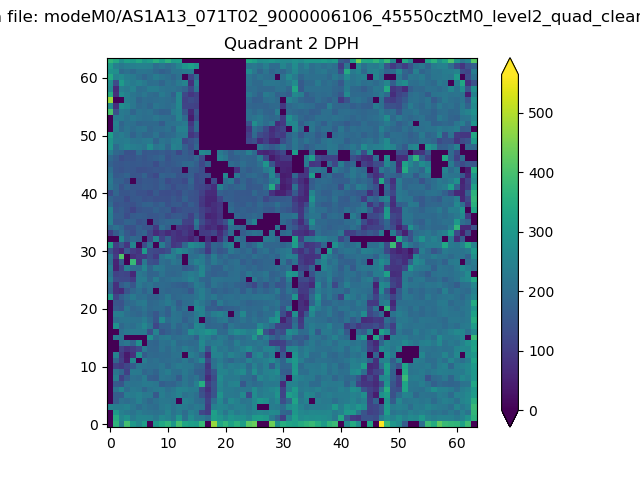 |
Quadrant C |
| Plot type | Count rate plots | Images |
|---|---|---|
| Comparison with Poisson distribution Blue bars denote a histogram of data divided into 1 sec bins. Red curve is a Poisson curve with rate = median count rate of data. |
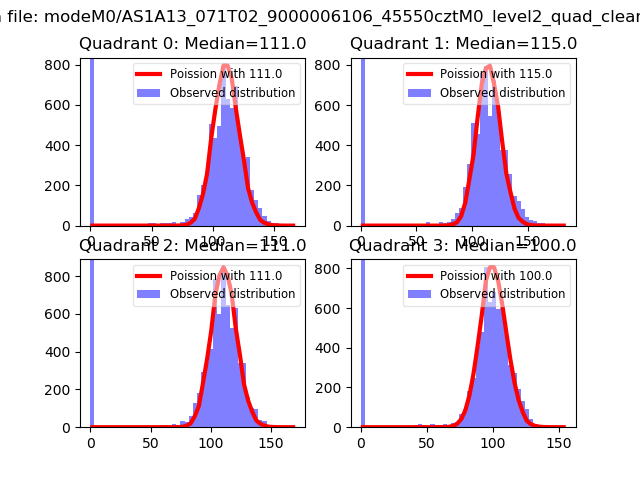 |
 |
| Quadrant-wise count rates Data is divided into 100 sec bins |
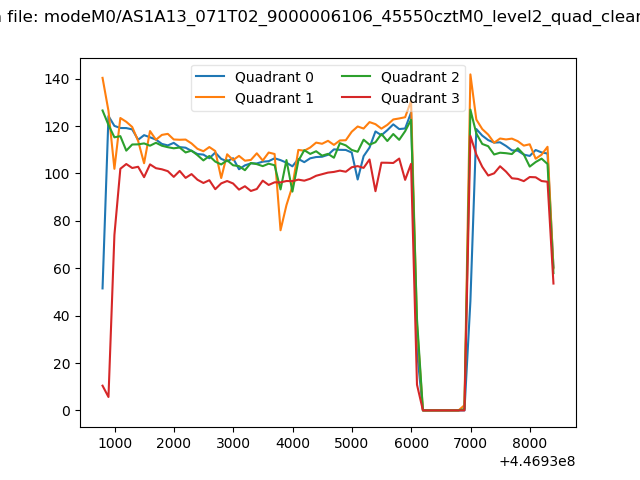 |
|
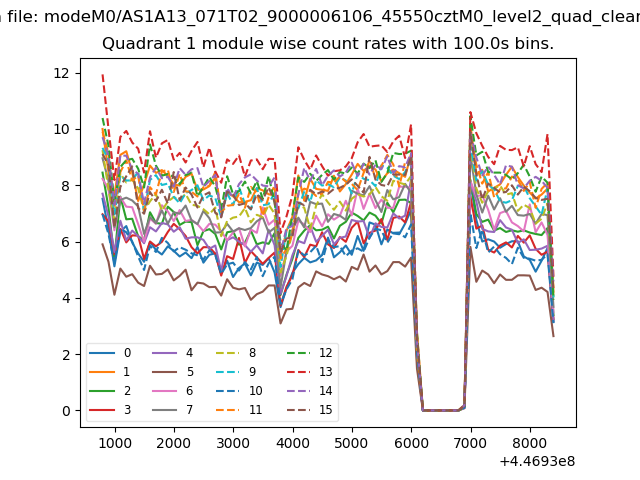
| Module-wise count rates for Quadrant A Data is divided into 100 sec bins |
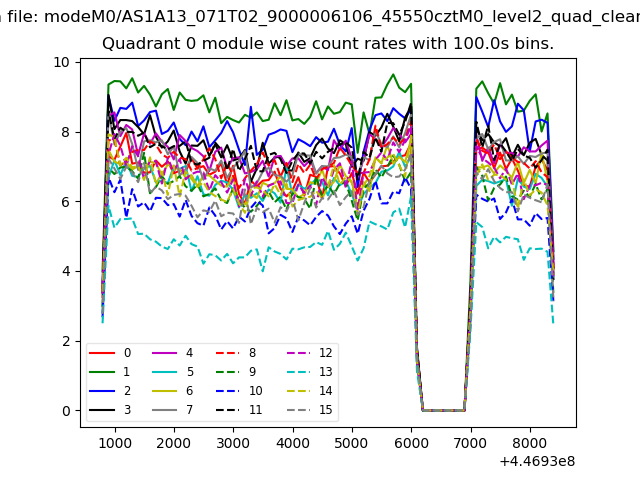 |
 |
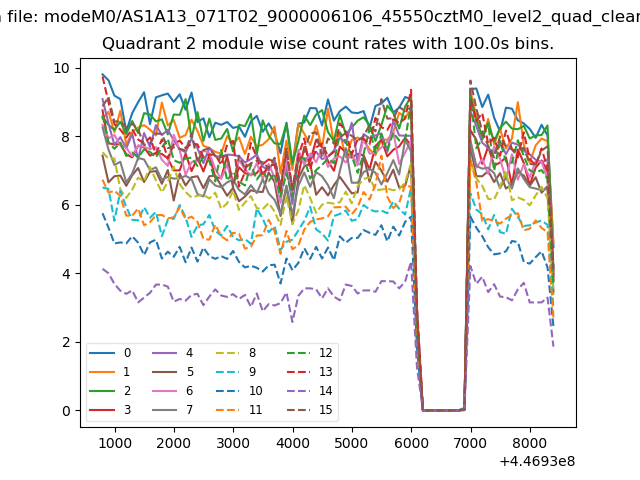
| Module-wise count rates for Quadrant B Data is divided into 100 sec bins |
 |
 |
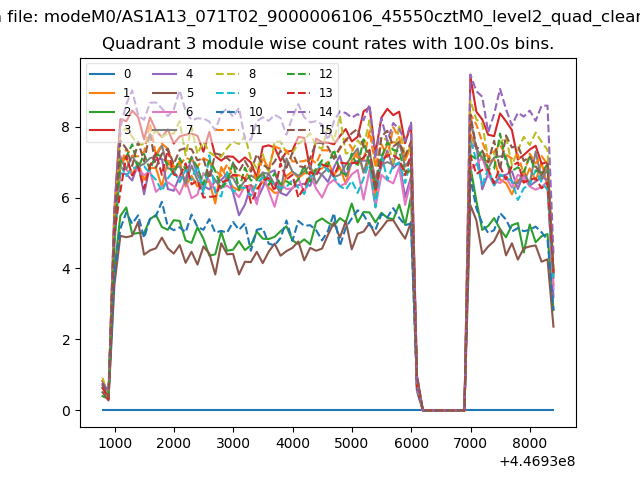
| Module-wise count rates for Quadrant C Data is divided into 100 sec bins |
 |
 |
| Module-wise count rates for Quadrant D Data is divided into 100 sec bins |
 |
 |
| Parameter | Plot |
|---|---|
| CZT HV Monitor | 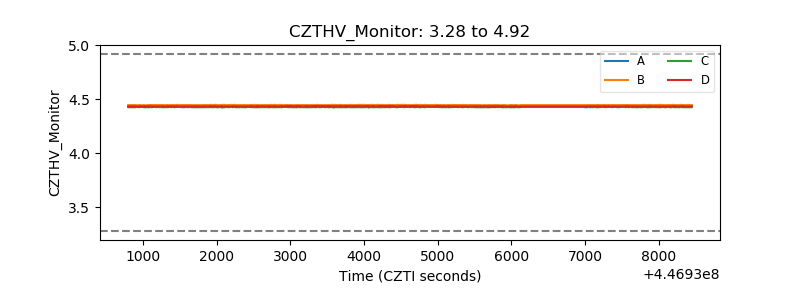 |
| D_VDD | 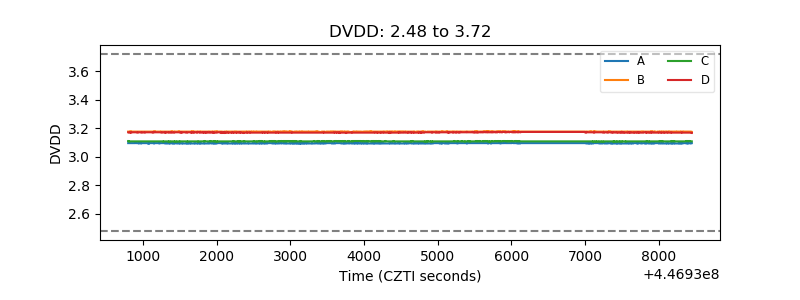 |
| Temperature 1 | 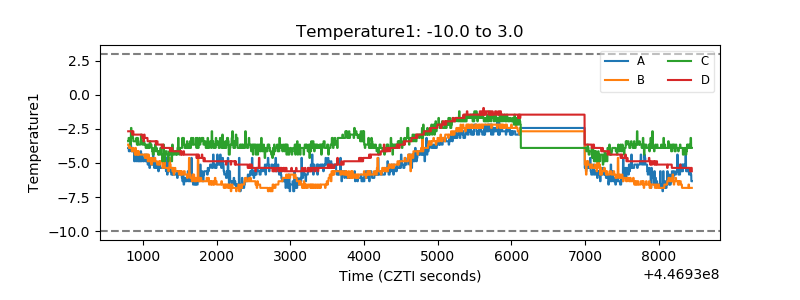 |
| Veto HV Monitor | 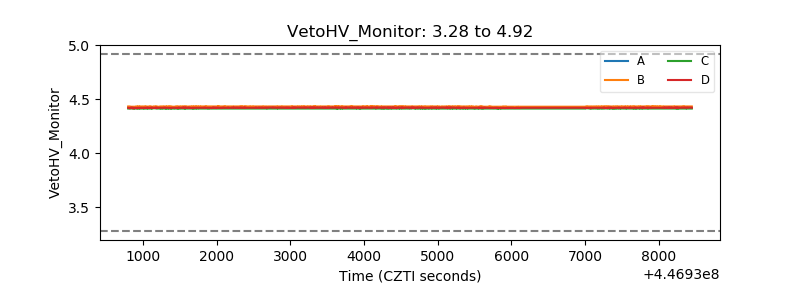 |
| Veto LLD | 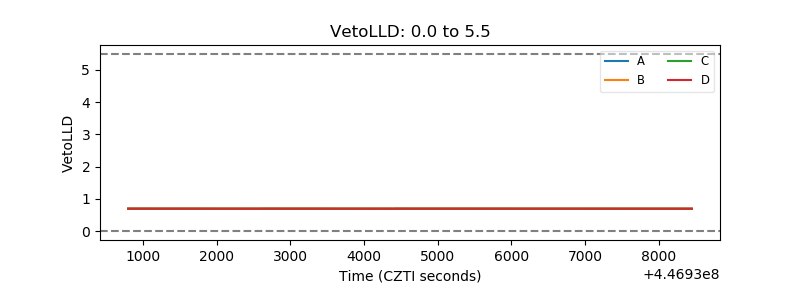 |
| Alpha Counter | 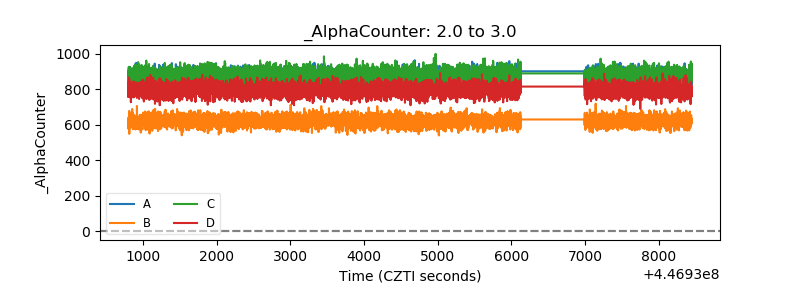 |
| _CPM_Rate | 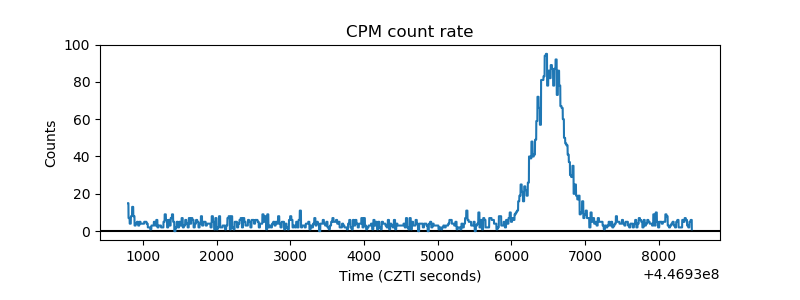 |
| CZT Counter | 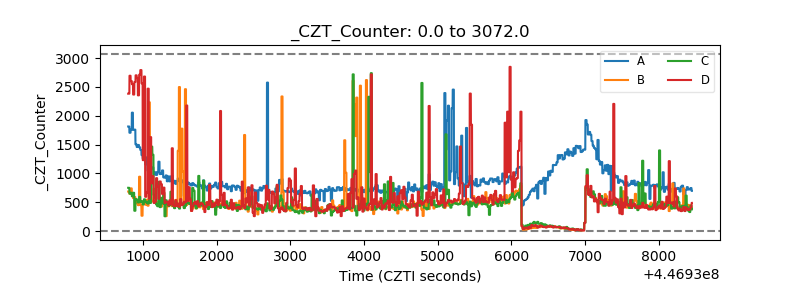 |
| +2.5 Volts monitor | 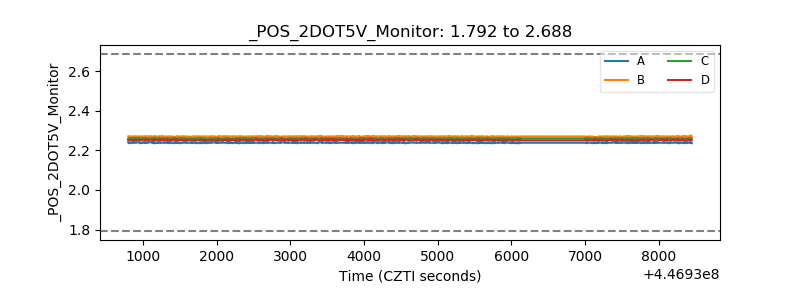 |
| +5 Volts monitor | 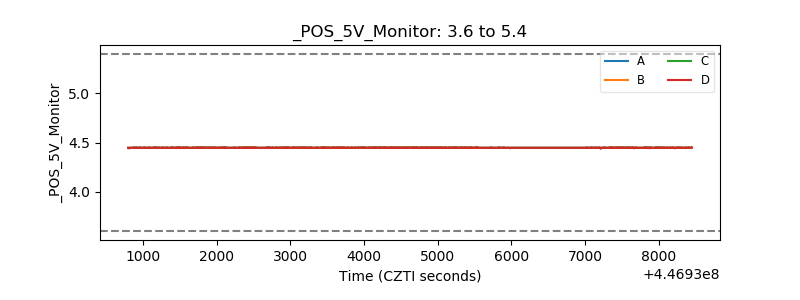 |
| _ROLL_ROT | 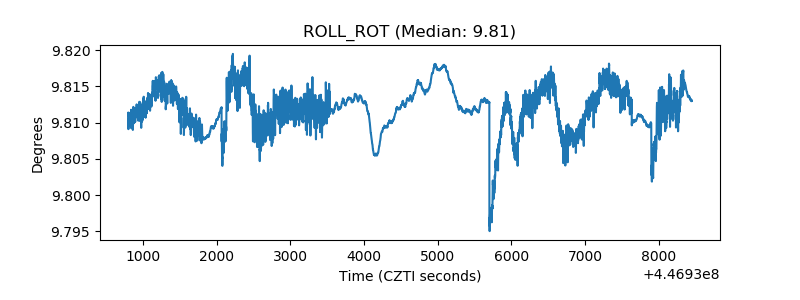 |
| _Roll_DEC | 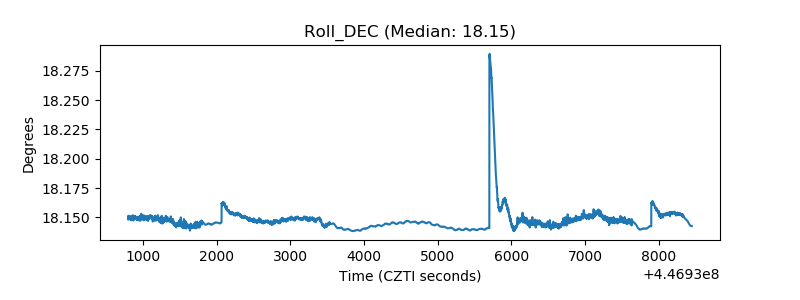 |
| _Roll_RA | 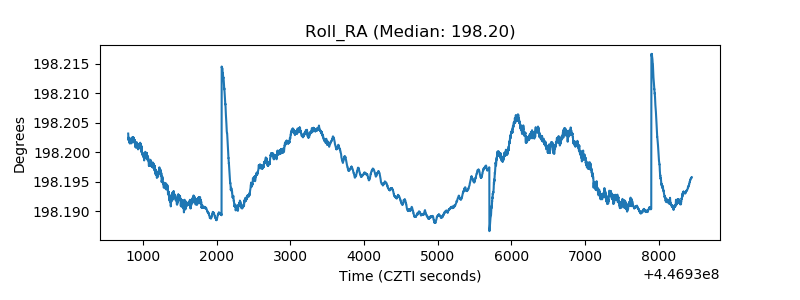 |
| Veto Counter | 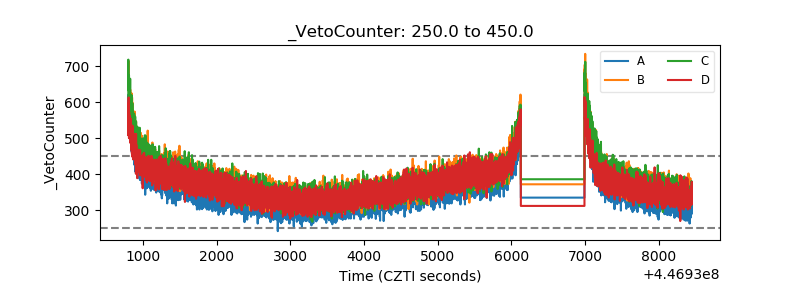 |