| Param | Original file | Final file |
|---|---|---|
| Filename | modeM0/AS1A13_093T11_9000006108_45550cztM0_level2.fits | modeM0/AS1A13_093T11_9000006108_45550cztM0_level2_quad_clean.evt |
| Size (bytes) | 360,869,760 | 82,149,120 |
| Size | 344.2 MB | 78.3 MB |
| Events in quadrant A | 4,135,035 | 551,367 |
| Events in quadrant B | 3,020,052 | 541,730 |
| Events in quadrant C | 2,867,578 | 538,506 |
| Events in quadrant D | 2,936,690 | 496,502 |
| Mode M9 | |||
|---|---|---|---|
| Quadrant | BADHDUFLAG | Total packets | Discarded packets |
| A | 0 | 4 | 0 |
| B | 0 | 4 | 0 |
| C | 0 | 4 | 0 |
| D | 0 | 4 | 0 |
| Mode M0 | |||
|---|---|---|---|
| Quadrant | BADHDUFLAG | Total packets | Discarded packets |
| A | 0 | 16107 | 2 |
| B | 0 | 12702 | 1 |
| C | 0 | 12336 | 1 |
| D | 0 | 12523 | 1 |
| Mode SS | |||
|---|---|---|---|
| Quadrant | BADHDUFLAG | Total packets | Discarded packets |
| A | 0 | 102 | 0 |
| B | 0 | 102 | 0 |
| C | 0 | 102 | 0 |
| D | 0 | 102 | 0 |
| Quadrant | Total seconds | Saturated seconds | Saturation percentage |
|---|---|---|---|
| A | 5126 | 101 | 1.970347% |
| B | 5126 | 306 | 5.969567% |
| C | 5126 | 149 | 2.906750% |
| D | 5126 | 117 | 2.282481% |
Noise dominated data is calculated using 1-second bins in cleaned event files. If a bin has >2000 counts, and if more than 50% of those come from <1% of pixels, then it is considered to be noise-dominated and hence unusable.
| Quadrant | # 1 sec bins | Bins with >0 counts | Bins with >2000 counts | High rate bins dominated by noise | Noise dominated (total time) | Noise dominated (detector-on time) | Marked lightcurve |
|---|---|---|---|---|---|---|---|
| A | 5551 | 5127 | 0 | 0 | 0.00% | 0.00% | 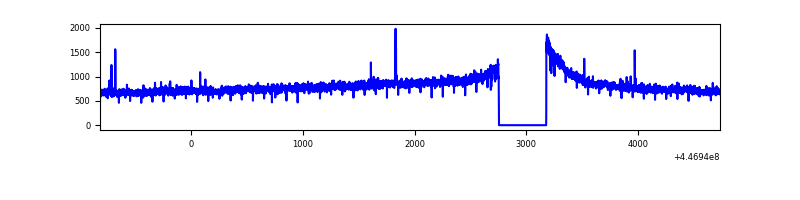 |
| B | 5551 | 5127 | 200 | 200 | 3.60% | 3.90% | 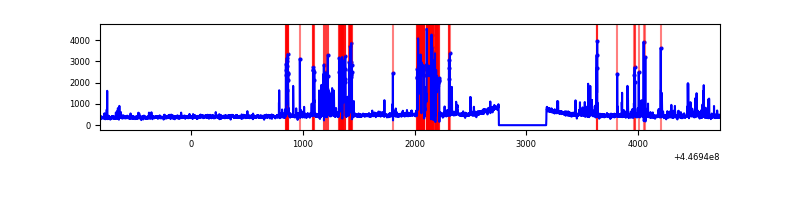 |
| C | 5551 | 5127 | 100 | 100 | 1.80% | 1.95% | 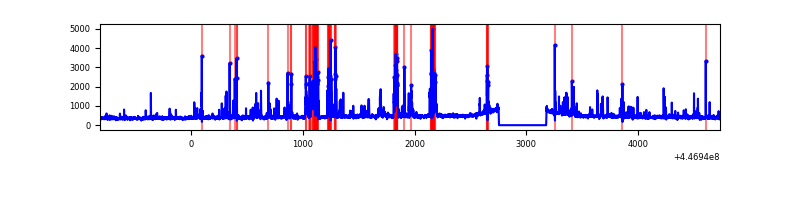 |
| D | 5551 | 5127 | 78 | 78 | 1.41% | 1.52% | 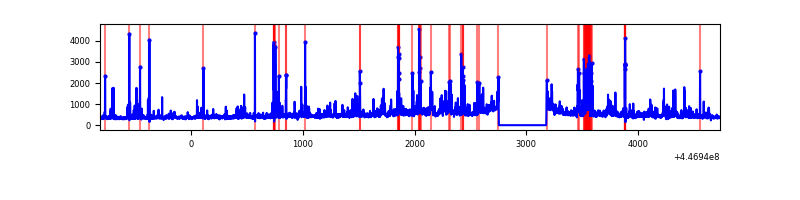 |
Top three noisy pixels from each quadrant. If the there are fewer than three noisy pixels in the level2.evt file, extra rows are filled as -1
| Pixel properties | Quadrant properties | ||||||
|---|---|---|---|---|---|---|---|
| Quadrant | DetID | PixID | Counts | Sigma | Mean | Median | Sigma |
| A | 10 | 83 | 1896154 | 15806.85 | 571 | 558 | 119.9 |
| A | 2 | 79 | 8967 | 70.12 | 571 | 558 | 119.9 |
| A | 15 | 174 | 7188 | 55.29 | 571 | 558 | 119.9 |
| B | 5 | 172 | 469475 | 4286.94 | 550 | 532 | 109.4 |
| B | 15 | 201 | 347257 | 3169.66 | 550 | 532 | 109.4 |
| B | 12 | 111 | 14181 | 124.78 | 550 | 532 | 109.4 |
| C | 14 | 254 | 396969 | 3006.84 | 556 | 560 | 131.8 |
| C | 12 | 2 | 287551 | 2176.89 | 556 | 560 | 131.8 |
| C | 2 | 14 | 8677 | 61.57 | 556 | 560 | 131.8 |
| D | 1 | 52 | 294117 | 2093.89 | 557 | 539 | 140.2 |
| D | 11 | 224 | 209217 | 1488.36 | 557 | 539 | 140.2 |
| D | 2 | 249 | 88338 | 626.21 | 557 | 539 | 140.2 |
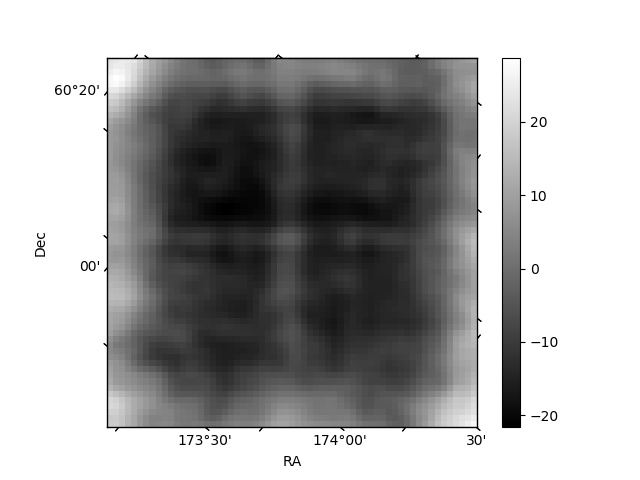
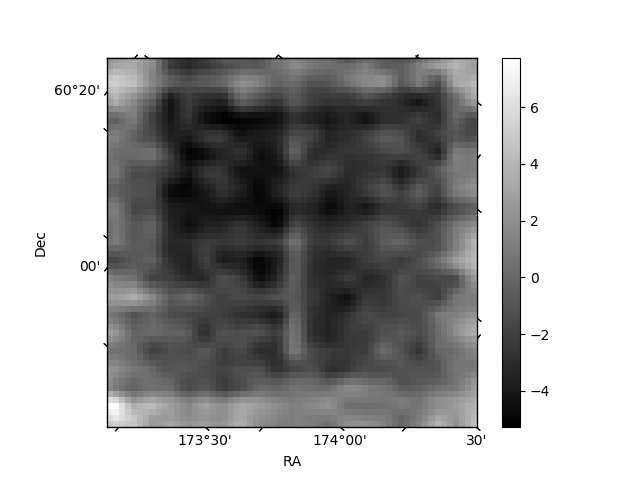
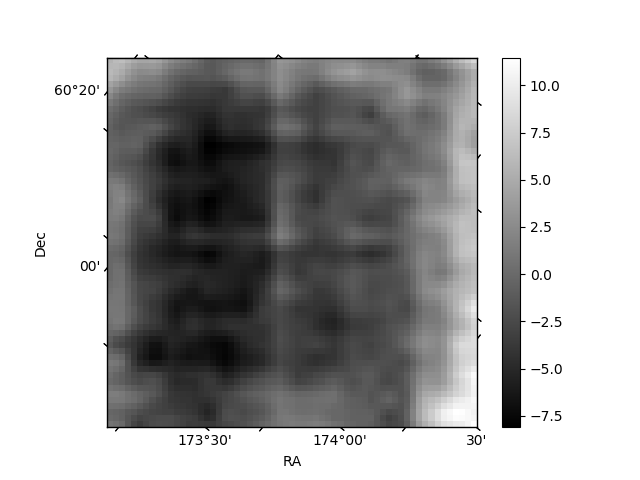
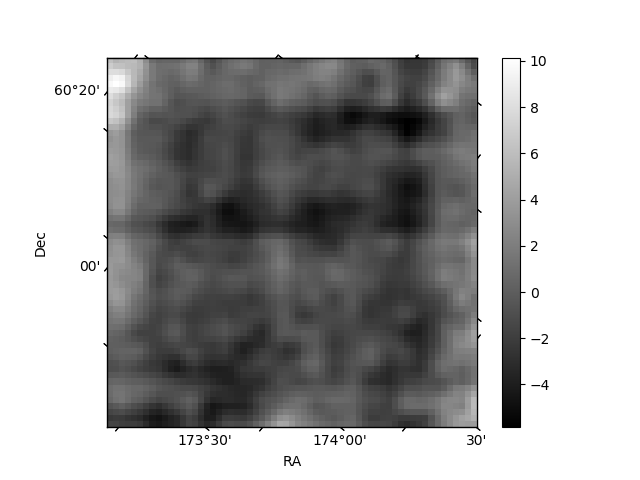
Histogram calculated using DETX and DETY for each event in the final _common_clean file
| Quadrant A | 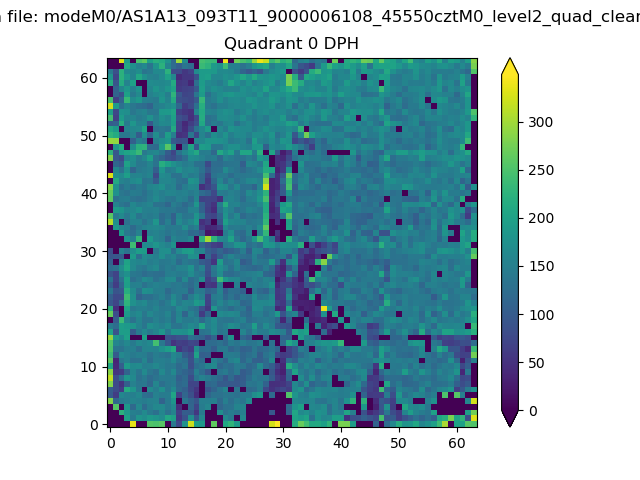 |
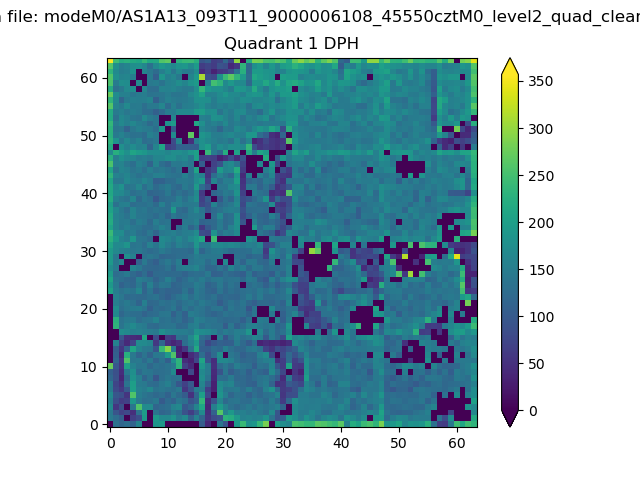 |
Quadrant B |
|---|---|---|---|
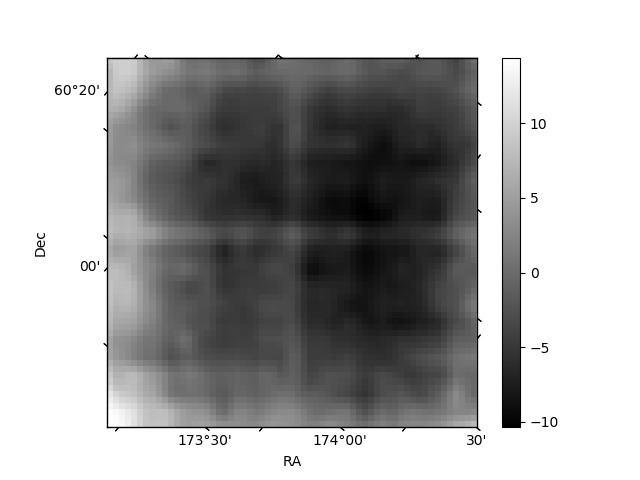
| Quadrant D | 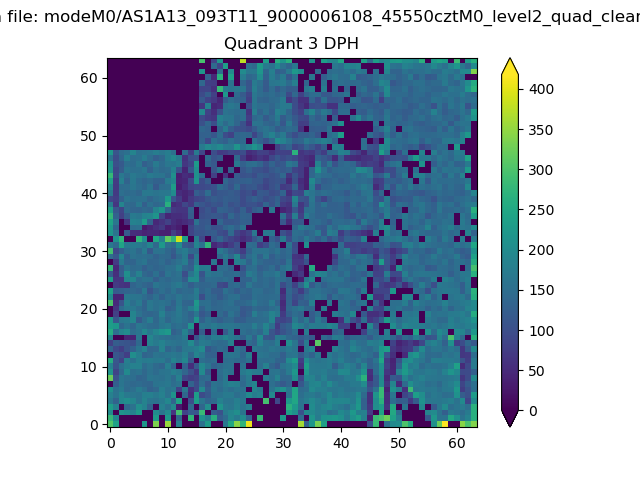 |
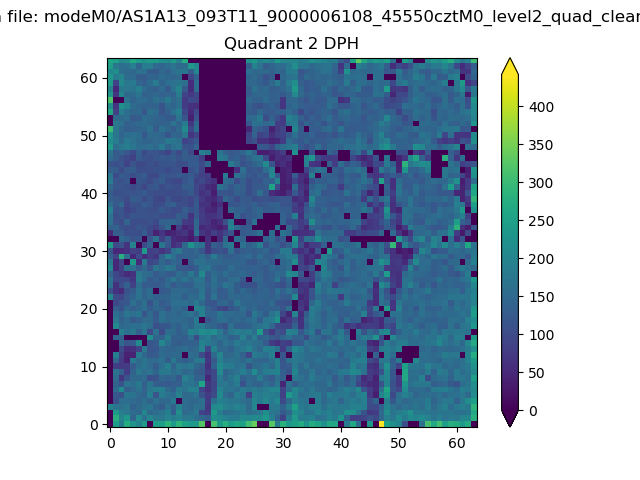 |
Quadrant C |
| Plot type | Count rate plots | Images |
|---|---|---|
| Comparison with Poisson distribution Blue bars denote a histogram of data divided into 1 sec bins. Red curve is a Poisson curve with rate = median count rate of data. |
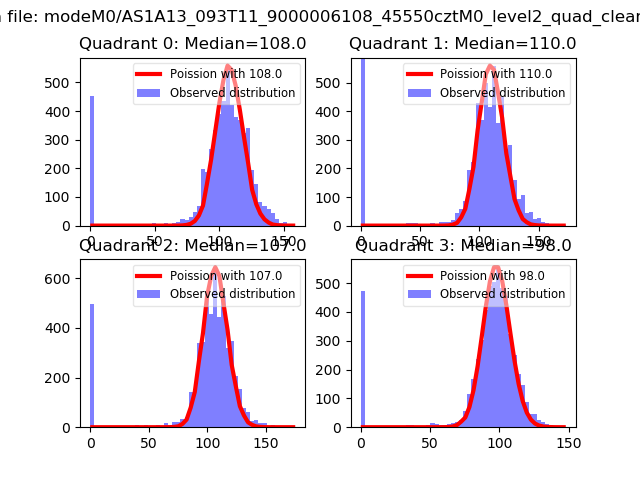 |
 |
| Quadrant-wise count rates Data is divided into 100 sec bins |
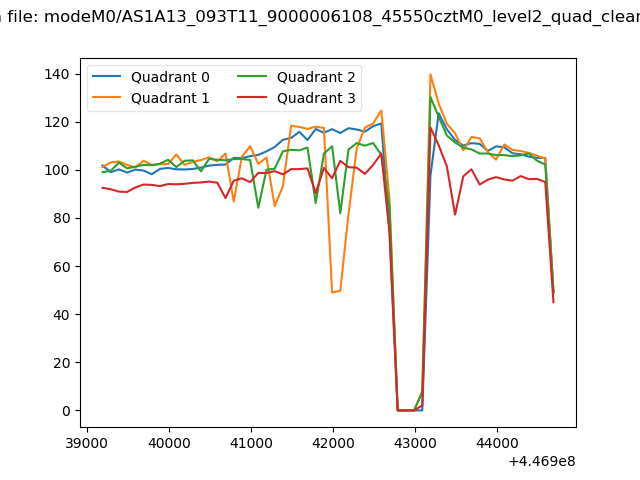 |
|
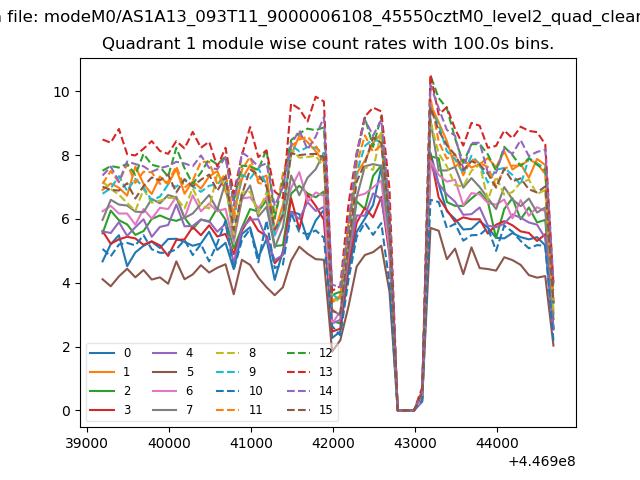
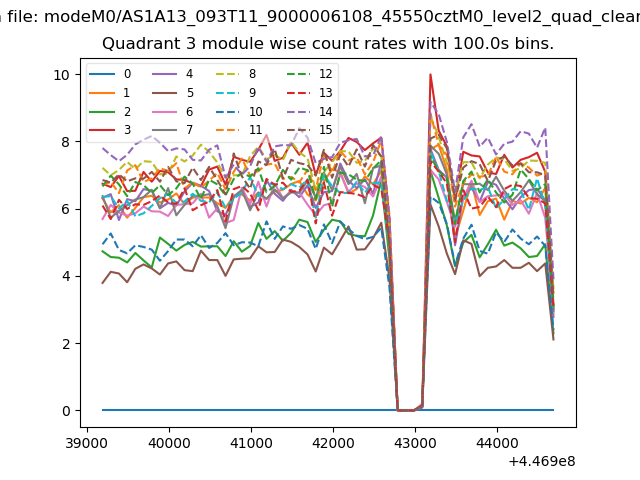
| Module-wise count rates for Quadrant A Data is divided into 100 sec bins |
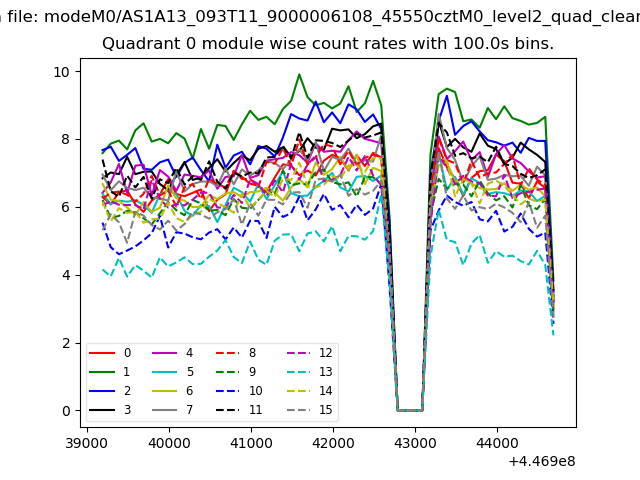 |
 |
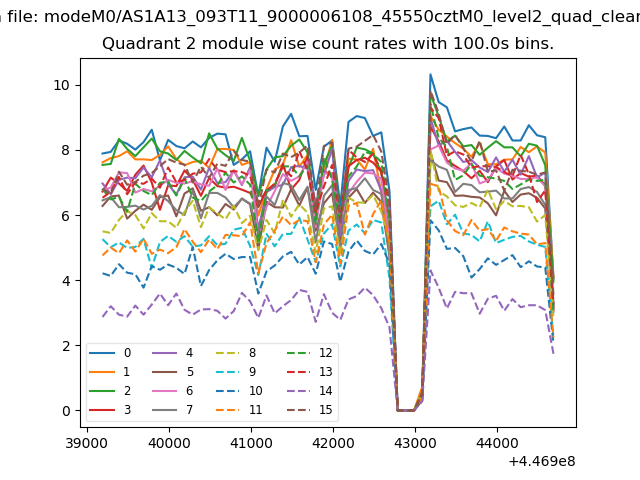
| Module-wise count rates for Quadrant B Data is divided into 100 sec bins |
 |
 |
| Module-wise count rates for Quadrant C Data is divided into 100 sec bins |
 |
 |
| Module-wise count rates for Quadrant D Data is divided into 100 sec bins |
 |
 |
| Parameter | Plot |
|---|---|
| CZT HV Monitor | 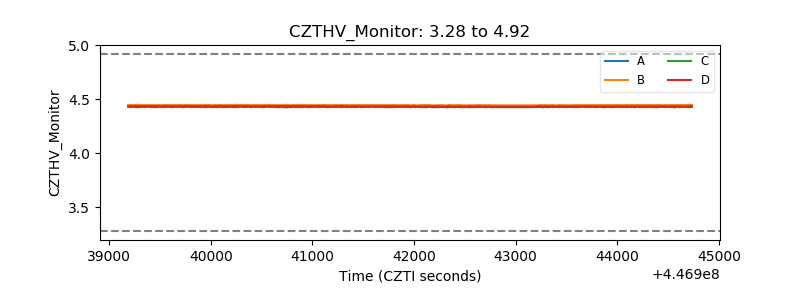 |
| D_VDD | 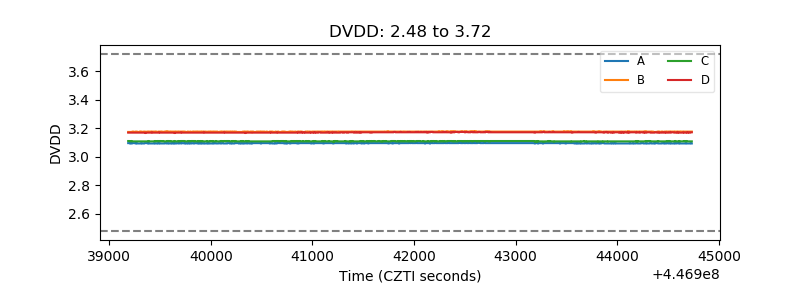 |
| Temperature 1 | 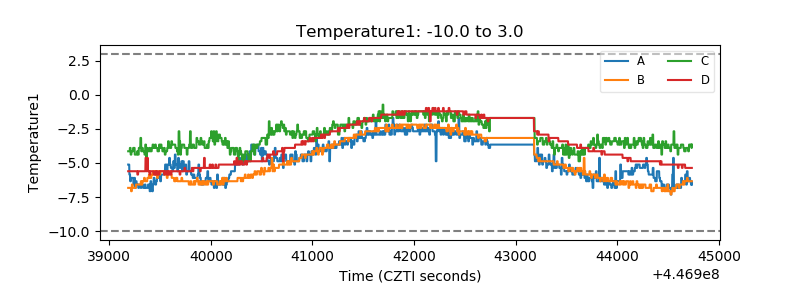 |
| Veto HV Monitor |  |
| Veto LLD | 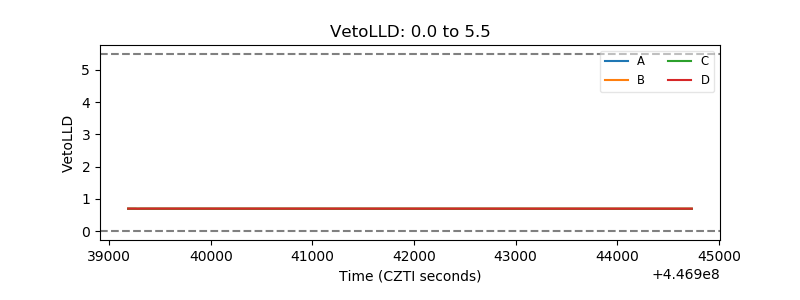 |
| Alpha Counter | 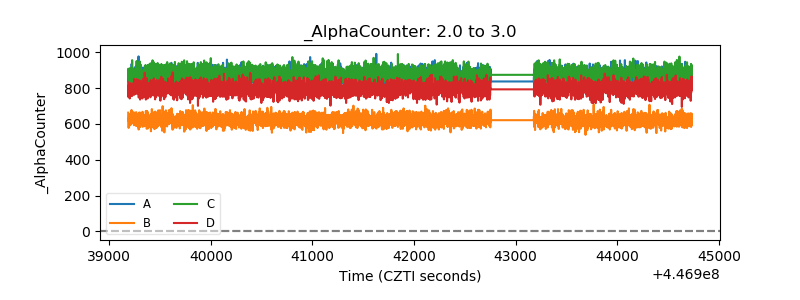 |
| _CPM_Rate | 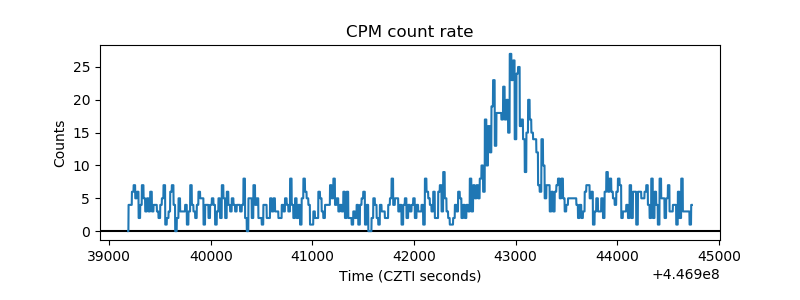 |
| CZT Counter | 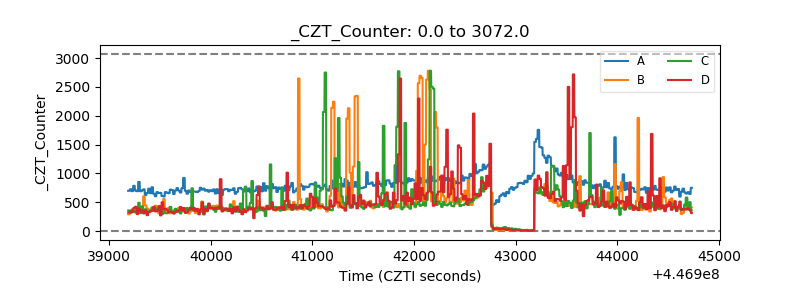 |
| +2.5 Volts monitor | 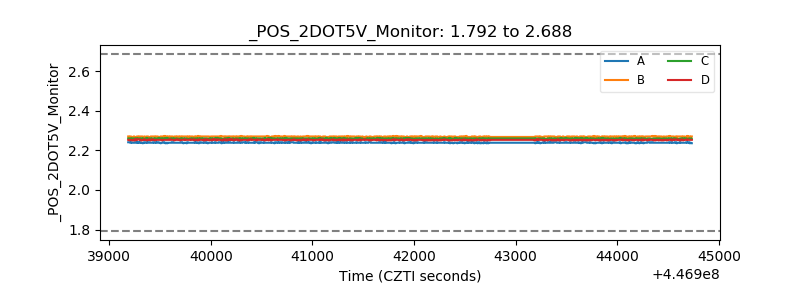 |
| +5 Volts monitor |  |
| _ROLL_ROT | 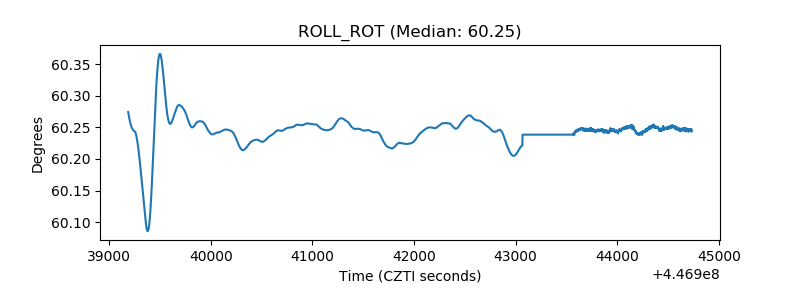 |
| _Roll_DEC | 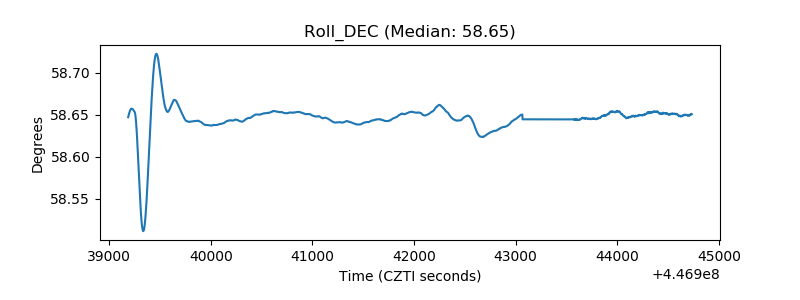 |
| _Roll_RA | 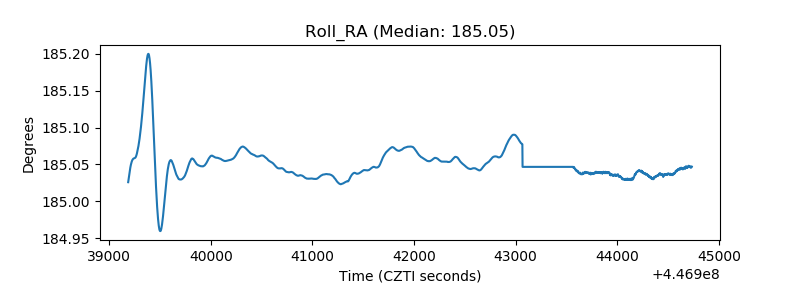 |
| Veto Counter | 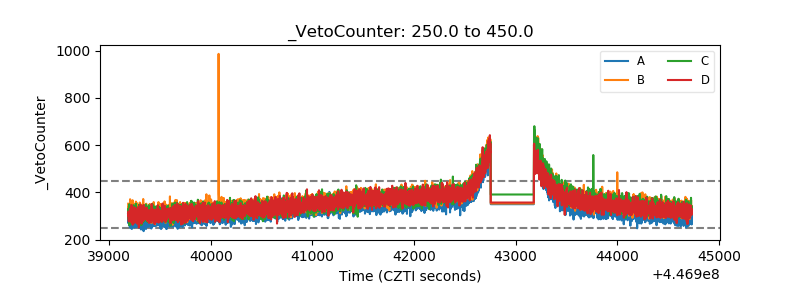 |