| Param | Original file | Final file |
|---|---|---|
| Filename | modeM0/AS1A13_093T11_9000006108_45551cztM0_level2.fits | modeM0/AS1A13_093T11_9000006108_45551cztM0_level2_quad_clean.evt |
| Size (bytes) | 541,385,280 | 123,837,120 |
| Size | 516.3 MB | 118.1 MB |
| Events in quadrant A | 6,354,838 | 829,889 |
| Events in quadrant B | 4,333,899 | 829,842 |
| Events in quadrant C | 3,881,235 | 813,267 |
| Events in quadrant D | 4,868,655 | 737,421 |
| Mode M0 | |||
|---|---|---|---|
| Quadrant | BADHDUFLAG | Total packets | Discarded packets |
| A | 0 | 24769 | 0 |
| B | 0 | 18472 | 0 |
| C | 0 | 17327 | 0 |
| D | 0 | 20060 | 0 |
| Mode SS | |||
|---|---|---|---|
| Quadrant | BADHDUFLAG | Total packets | Discarded packets |
| A | 0 | 154 | 0 |
| B | 0 | 154 | 0 |
| C | 0 | 154 | 0 |
| D | 0 | 154 | 0 |
| Quadrant | Total seconds | Saturated seconds | Saturation percentage |
|---|---|---|---|
| A | 7755 | 122 | 1.573179% |
| B | 7756 | 285 | 3.674575% |
| C | 7756 | 132 | 1.701908% |
| D | 7756 | 255 | 3.287777% |
Noise dominated data is calculated using 1-second bins in cleaned event files. If a bin has >2000 counts, and if more than 50% of those come from <1% of pixels, then it is considered to be noise-dominated and hence unusable.
| Quadrant | # 1 sec bins | Bins with >0 counts | Bins with >2000 counts | High rate bins dominated by noise | Noise dominated (total time) | Noise dominated (detector-on time) | Marked lightcurve |
|---|---|---|---|---|---|---|---|
| A | 7755 | 7755 | 67 | 67 | 0.86% | 0.86% | 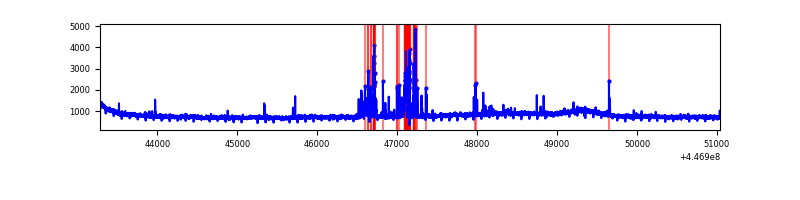 |
| B | 7756 | 7756 | 203 | 203 | 2.62% | 2.62% | 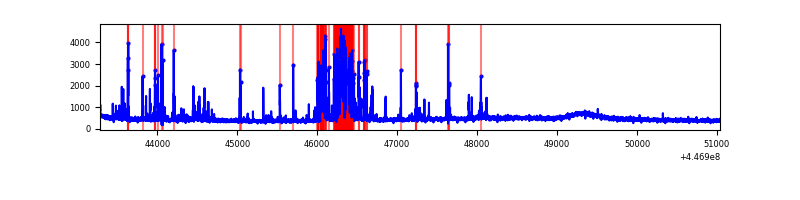 |
| C | 7756 | 7756 | 76 | 76 | 0.98% | 0.98% | 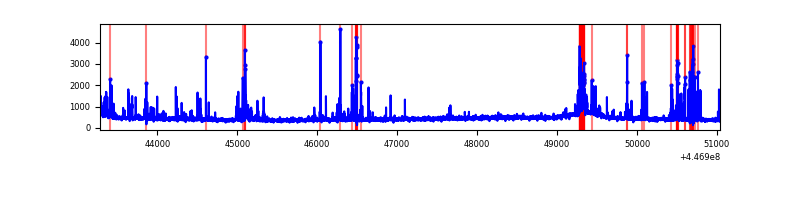 |
| D | 7756 | 7756 | 186 | 186 | 2.40% | 2.40% | 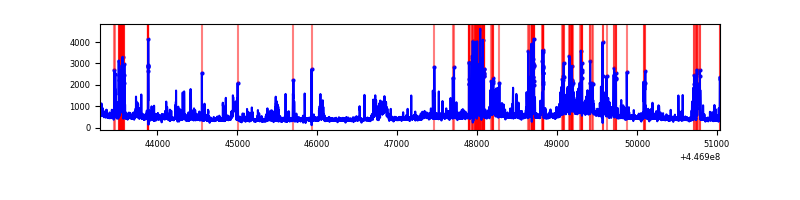 |
Top three noisy pixels from each quadrant. If the there are fewer than three noisy pixels in the level2.evt file, extra rows are filled as -1
| Pixel properties | Quadrant properties | ||||||
|---|---|---|---|---|---|---|---|
| Quadrant | DetID | PixID | Counts | Sigma | Mean | Median | Sigma |
| A | 10 | 83 | 2717415 | 15330.05 | 847 | 826 | 177.2 |
| A | 10 | 248 | 303166 | 1706.14 | 847 | 826 | 177.2 |
| A | 2 | 79 | 46567 | 258.12 | 847 | 826 | 177.2 |
| B | 5 | 172 | 916911 | 5515.83 | 841 | 816 | 166.1 |
| B | 15 | 201 | 39822 | 234.86 | 841 | 816 | 166.1 |
| B | 12 | 111 | 21294 | 123.3 | 841 | 816 | 166.1 |
| C | 12 | 2 | 377219 | 1898.76 | 840 | 844 | 198.2 |
| C | 14 | 254 | 205187 | 1030.88 | 840 | 844 | 198.2 |
| C | 2 | 14 | 10514 | 48.78 | 840 | 844 | 198.2 |
| D | 11 | 224 | 564156 | 2728.41 | 826 | 801 | 206.5 |
| D | 1 | 52 | 383113 | 1851.59 | 826 | 801 | 206.5 |
| D | 10 | 1 | 99863 | 479.77 | 826 | 801 | 206.5 |
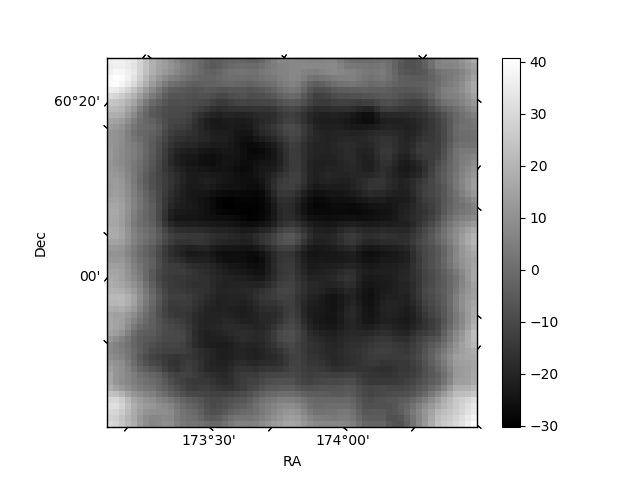
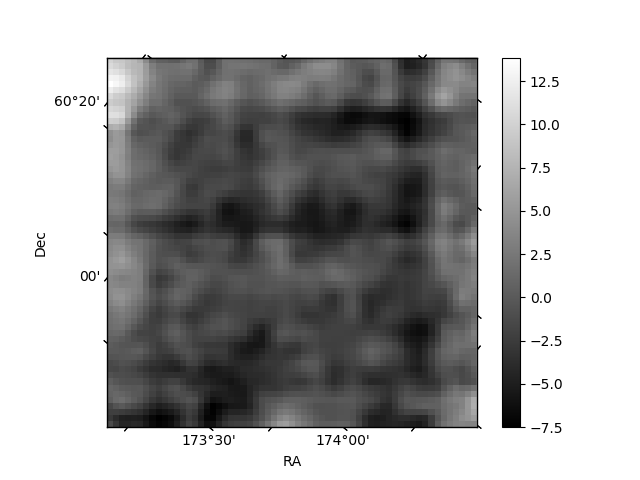
Histogram calculated using DETX and DETY for each event in the final _common_clean file
| Quadrant A | 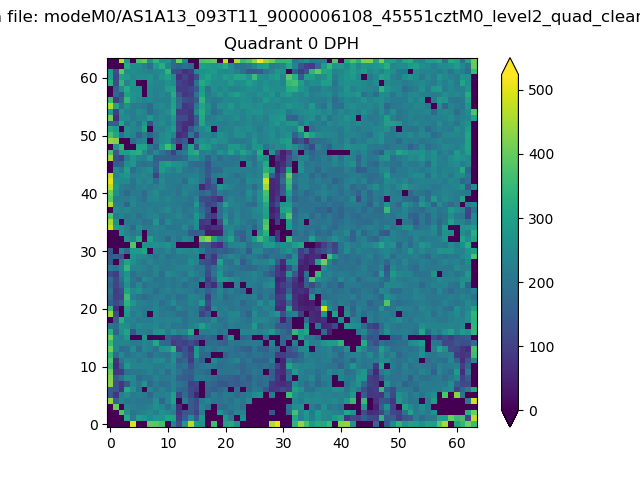 |
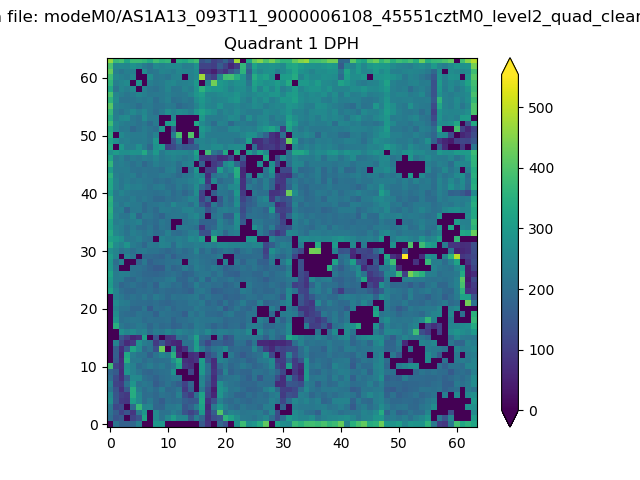 |
Quadrant B |
|---|---|---|---|
| Quadrant D | 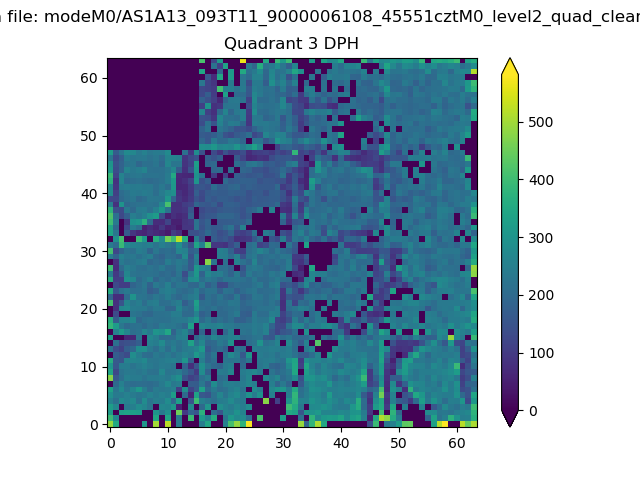 |
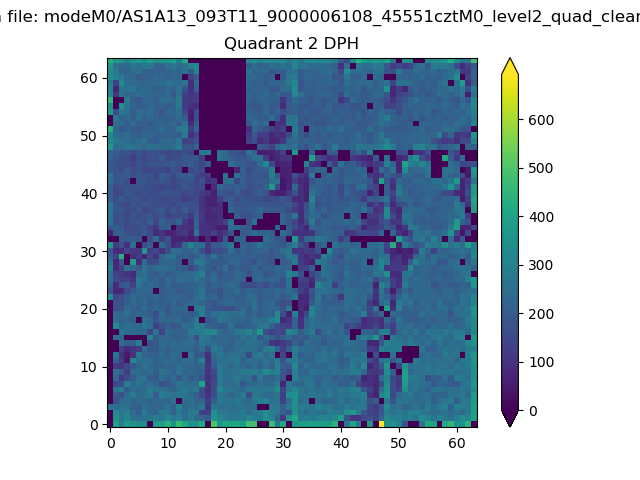 |
Quadrant C |
| Plot type | Count rate plots | Images |
|---|---|---|
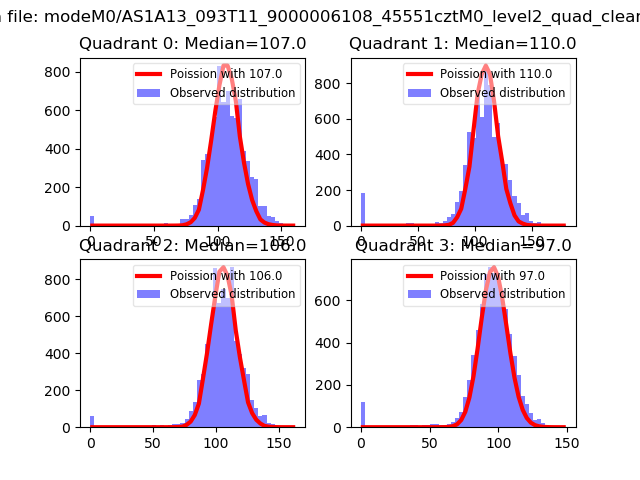
| Comparison with Poisson distribution Blue bars denote a histogram of data divided into 1 sec bins. Red curve is a Poisson curve with rate = median count rate of data. |
 |
 |
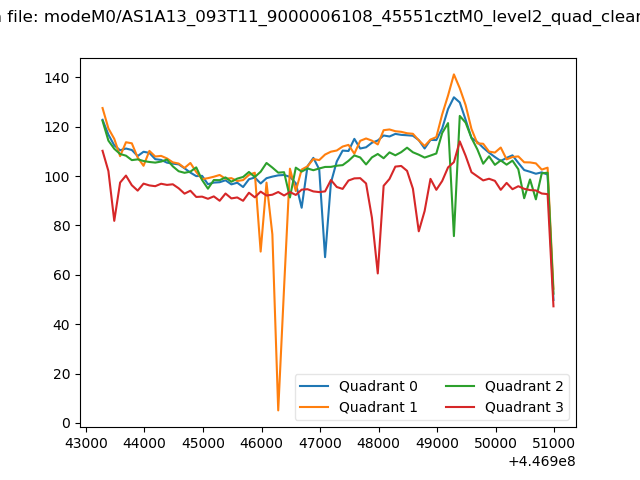
| Quadrant-wise count rates Data is divided into 100 sec bins |
 |
|
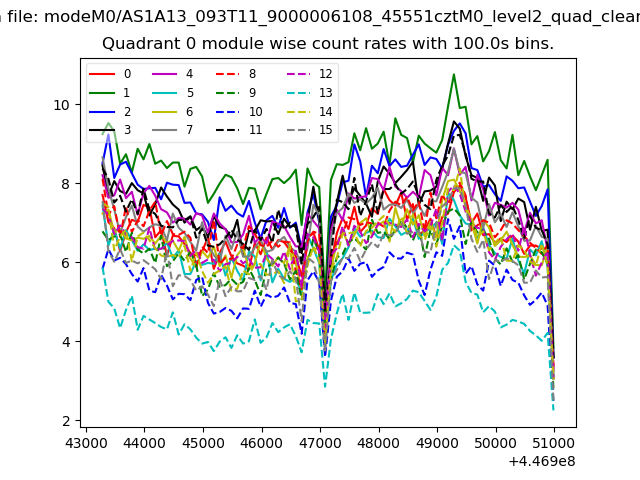
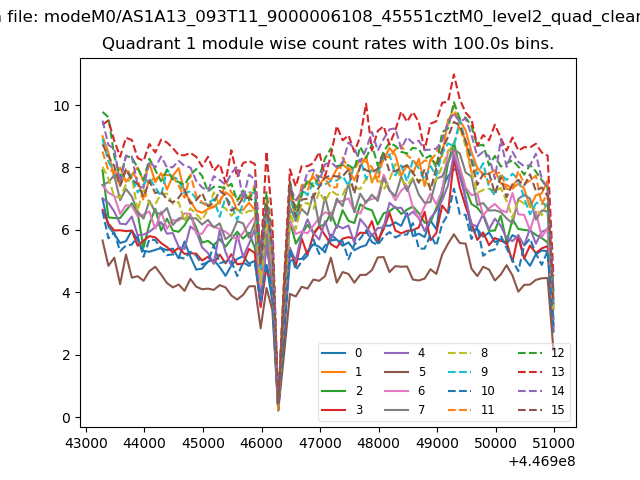
| Module-wise count rates for Quadrant A Data is divided into 100 sec bins |
 |
 |
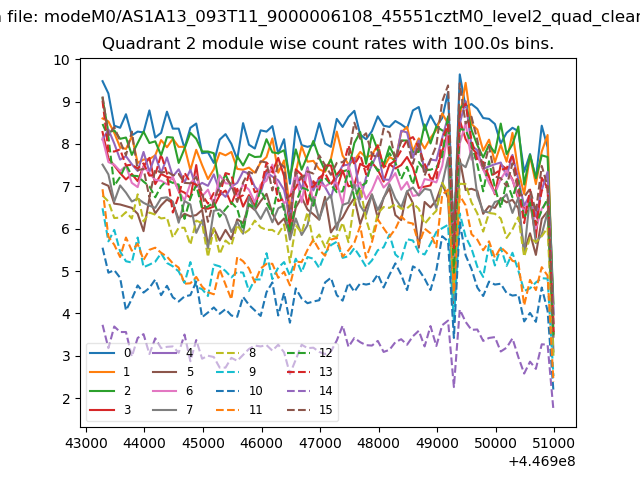
| Module-wise count rates for Quadrant B Data is divided into 100 sec bins |
 |
 |
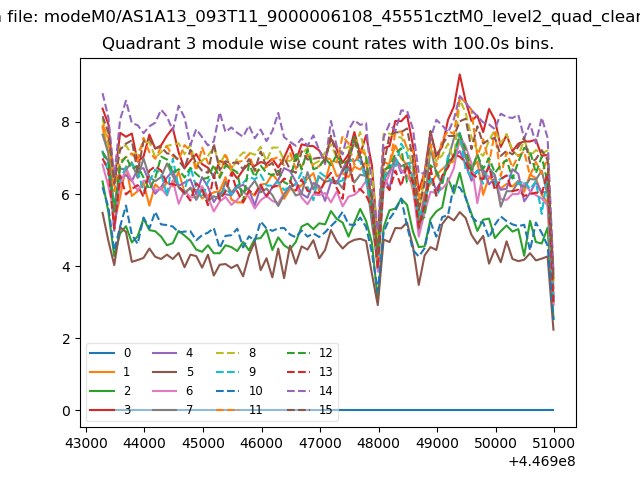
| Module-wise count rates for Quadrant C Data is divided into 100 sec bins |
 |
 |
| Module-wise count rates for Quadrant D Data is divided into 100 sec bins |
 |
 |
| Parameter | Plot |
|---|---|
| CZT HV Monitor | 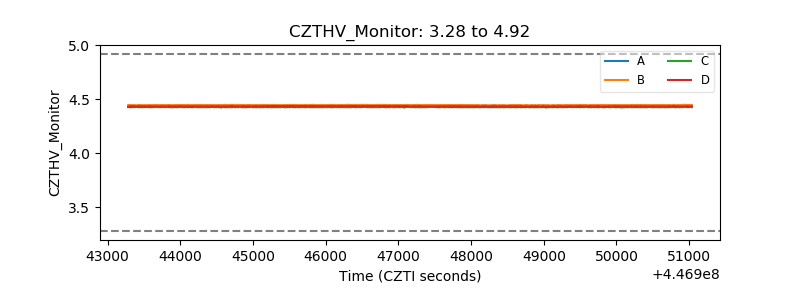 |
| D_VDD | 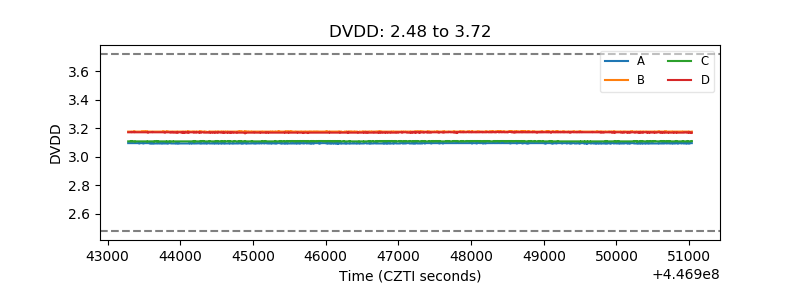 |
| Temperature 1 | 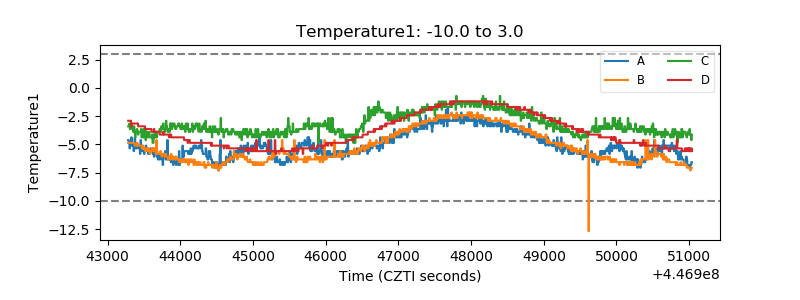 |
| Veto HV Monitor | 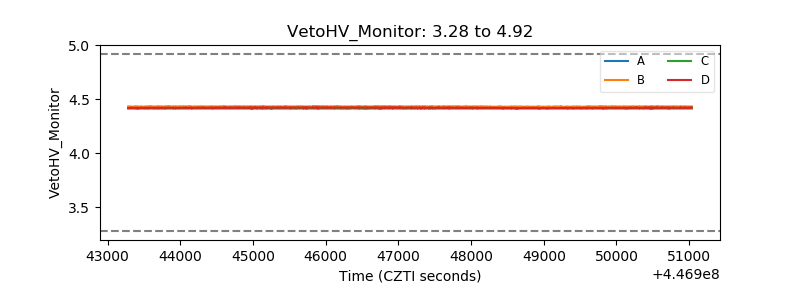 |
| Veto LLD | 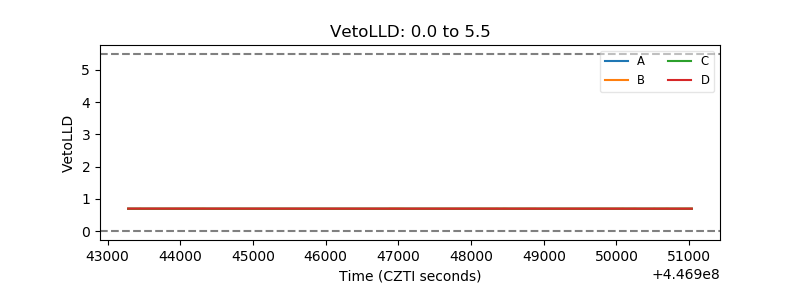 |
| Alpha Counter | 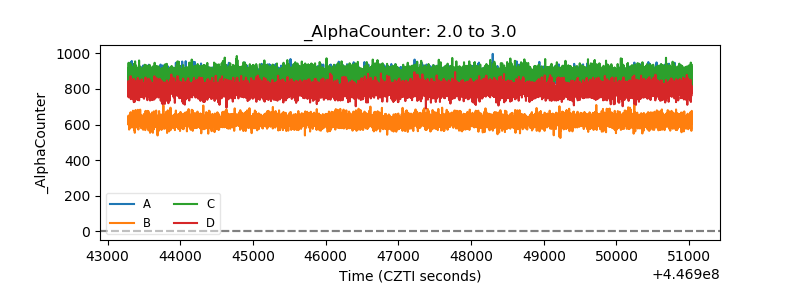 |
| _CPM_Rate | 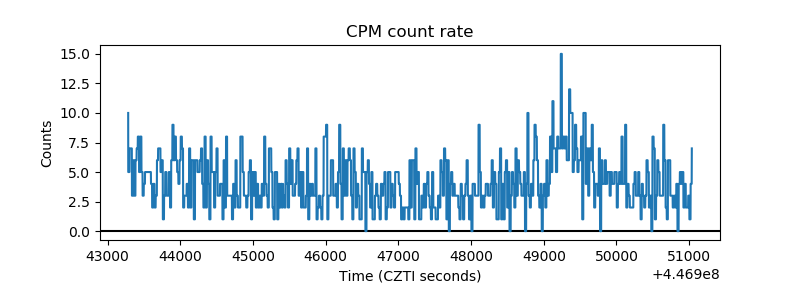 |
| CZT Counter | 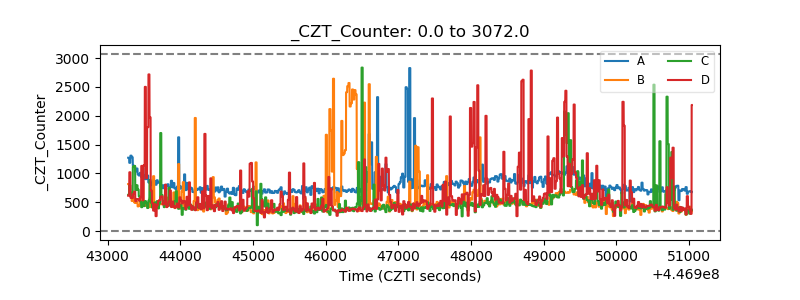 |
| +2.5 Volts monitor | 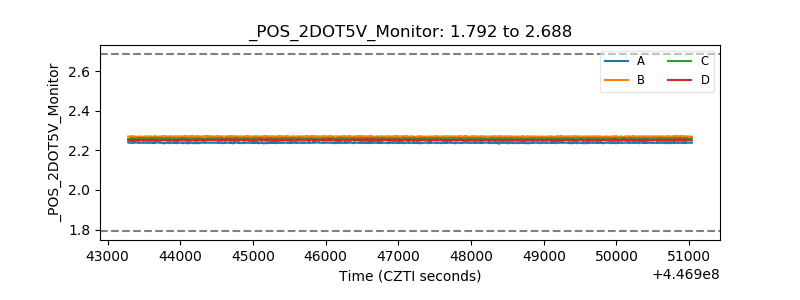 |
| +5 Volts monitor | 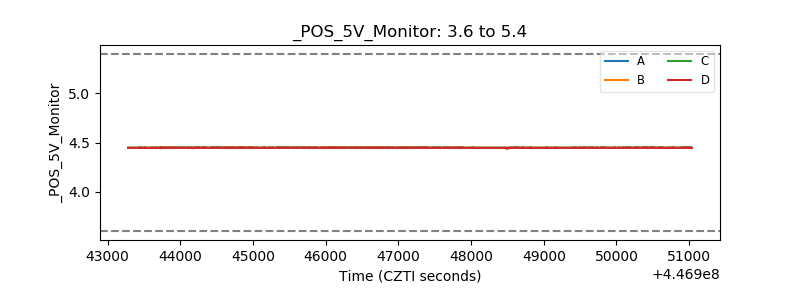 |
| _ROLL_ROT |  |
| _Roll_DEC | 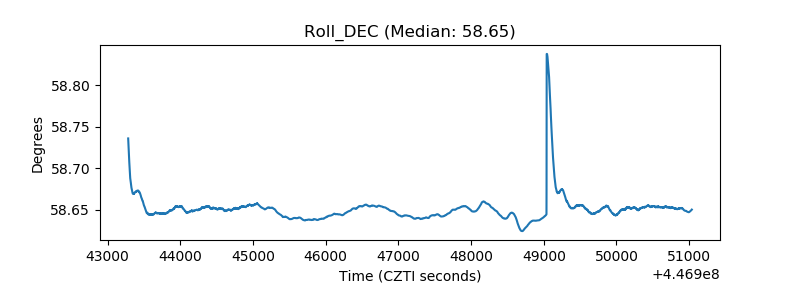 |
| _Roll_RA | 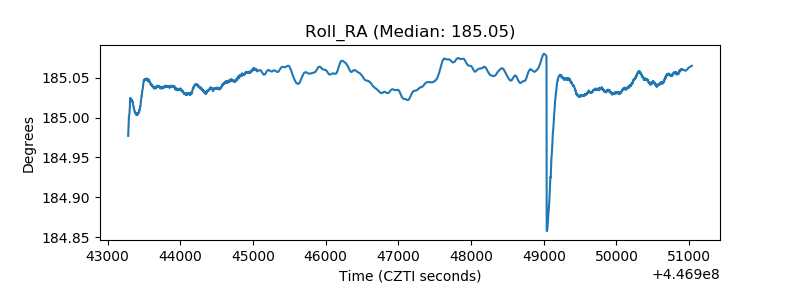 |
| Veto Counter | 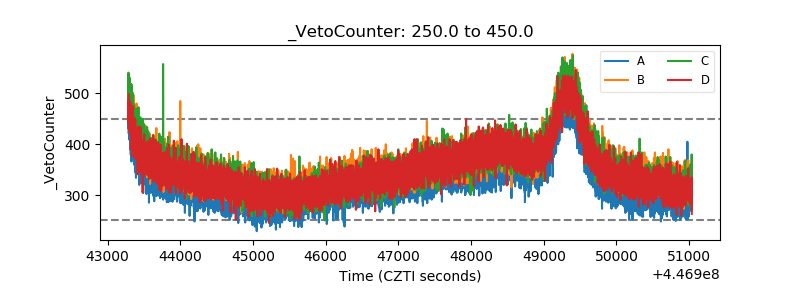 |