| Param | Original file | Final file |
|---|---|---|
| Filename | modeM0/AS1A13_093T11_9000006108_45552cztM0_level2.fits | modeM0/AS1A13_093T11_9000006108_45552cztM0_level2_quad_clean.evt |
| Size (bytes) | 569,257,920 | 130,559,040 |
| Size | 542.9 MB | 124.5 MB |
| Events in quadrant A | 6,448,807 | 872,889 |
| Events in quadrant B | 3,942,003 | 895,273 |
| Events in quadrant C | 4,865,609 | 836,465 |
| Events in quadrant D | 5,182,992 | 781,123 |
| Mode M0 | |||
|---|---|---|---|
| Quadrant | BADHDUFLAG | Total packets | Discarded packets |
| A | 0 | 25207 | 0 |
| B | 0 | 17780 | 0 |
| C | 0 | 20443 | 0 |
| D | 0 | 21415 | 0 |
| Mode SS | |||
|---|---|---|---|
| Quadrant | BADHDUFLAG | Total packets | Discarded packets |
| A | 0 | 164 | 0 |
| B | 0 | 164 | 0 |
| C | 0 | 164 | 0 |
| D | 0 | 164 | 0 |
| Quadrant | Total seconds | Saturated seconds | Saturation percentage |
|---|---|---|---|
| A | 8159 | 51 | 0.625077% |
| B | 8160 | 64 | 0.784314% |
| C | 8160 | 330 | 4.044118% |
| D | 8160 | 207 | 2.536765% |
Noise dominated data is calculated using 1-second bins in cleaned event files. If a bin has >2000 counts, and if more than 50% of those come from <1% of pixels, then it is considered to be noise-dominated and hence unusable.
| Quadrant | # 1 sec bins | Bins with >0 counts | Bins with >2000 counts | High rate bins dominated by noise | Noise dominated (total time) | Noise dominated (detector-on time) | Marked lightcurve |
|---|---|---|---|---|---|---|---|
| A | 8159 | 8159 | 3 | 3 | 0.04% | 0.04% |  |
| B | 8160 | 8160 | 34 | 34 | 0.42% | 0.42% | 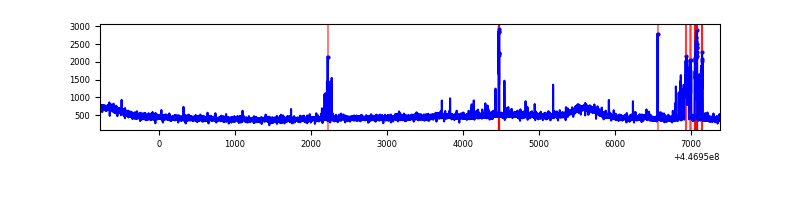 |
| C | 8160 | 8160 | 247 | 247 | 3.03% | 3.03% | 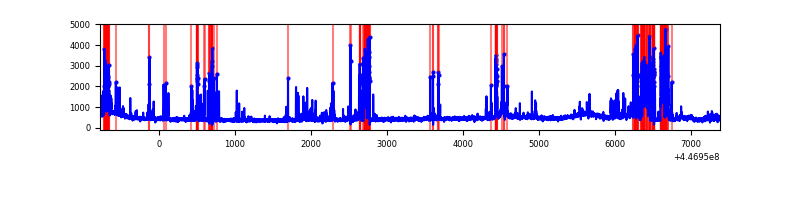 |
| D | 8160 | 8160 | 146 | 146 | 1.79% | 1.79% | 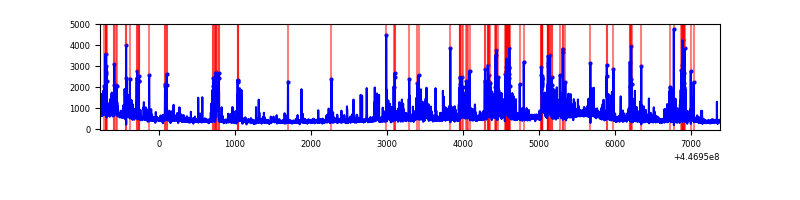 |
Top three noisy pixels from each quadrant. If the there are fewer than three noisy pixels in the level2.evt file, extra rows are filled as -1
| Pixel properties | Quadrant properties | ||||||
|---|---|---|---|---|---|---|---|
| Quadrant | DetID | PixID | Counts | Sigma | Mean | Median | Sigma |
| A | 10 | 83 | 2865315 | 15308.56 | 902 | 881 | 187.1 |
| A | 2 | 79 | 44264 | 231.85 | 902 | 881 | 187.1 |
| A | 10 | 248 | 28355 | 146.83 | 902 | 881 | 187.1 |
| B | 15 | 201 | 271652 | 1512.83 | 907 | 878 | 179.0 |
| B | 0 | 189 | 44025 | 241.06 | 907 | 878 | 179.0 |
| B | 0 | 183 | 25215 | 135.97 | 907 | 878 | 179.0 |
| C | 12 | 2 | 1193644 | 5682.81 | 883 | 883 | 209.9 |
| C | 14 | 254 | 222123 | 1054.08 | 883 | 883 | 209.9 |
| C | 13 | 61 | 5920 | 24.0 | 883 | 883 | 209.9 |
| D | 1 | 52 | 932504 | 4199.77 | 880 | 853 | 221.8 |
| D | 12 | 1 | 127164 | 569.39 | 880 | 853 | 221.8 |
| D | 10 | 1 | 99961 | 446.77 | 880 | 853 | 221.8 |
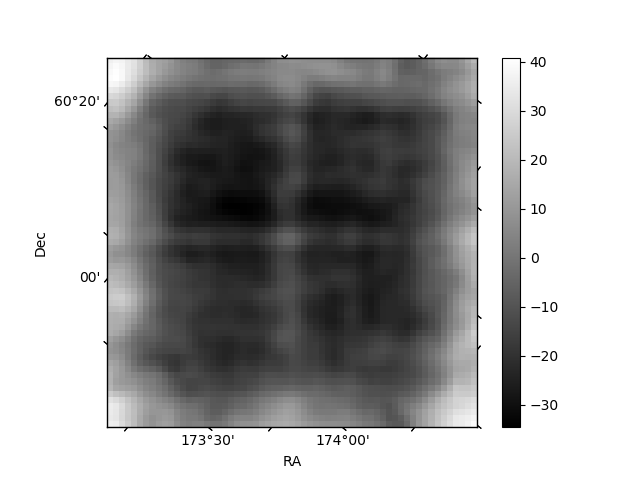
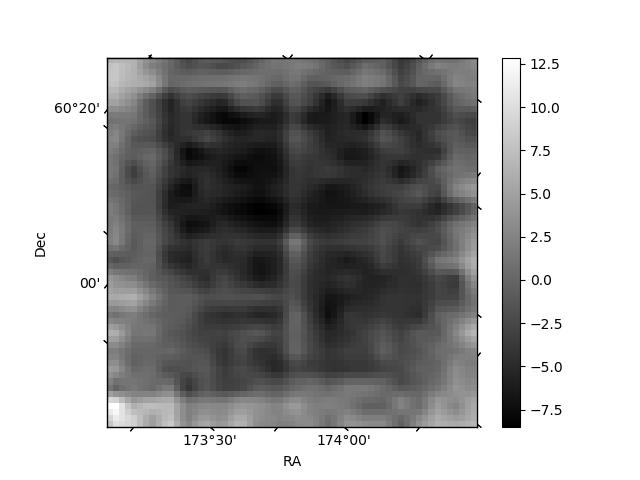
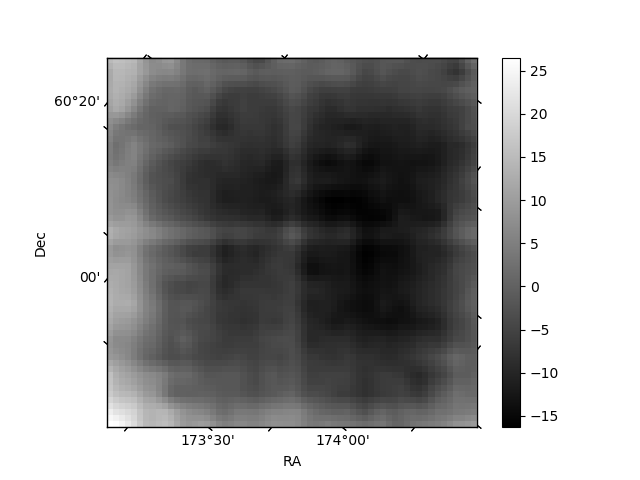
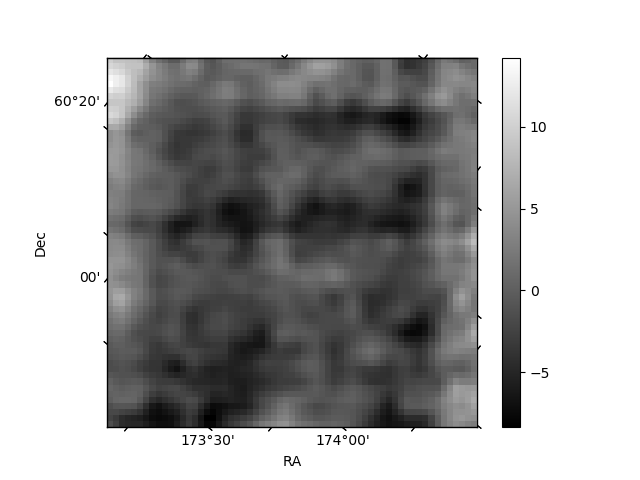
Histogram calculated using DETX and DETY for each event in the final _common_clean file
| Quadrant A | 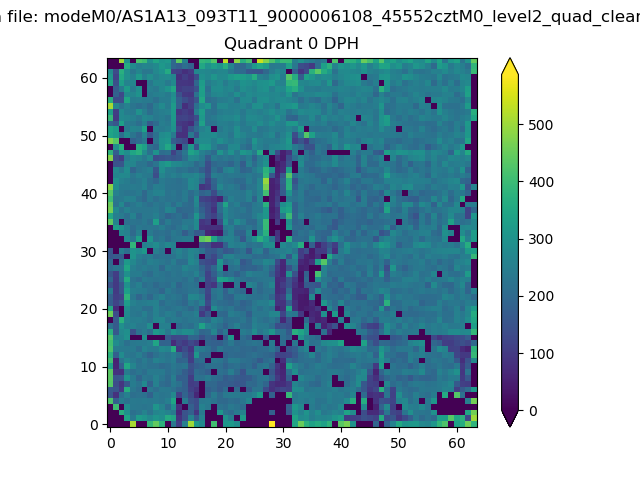 |
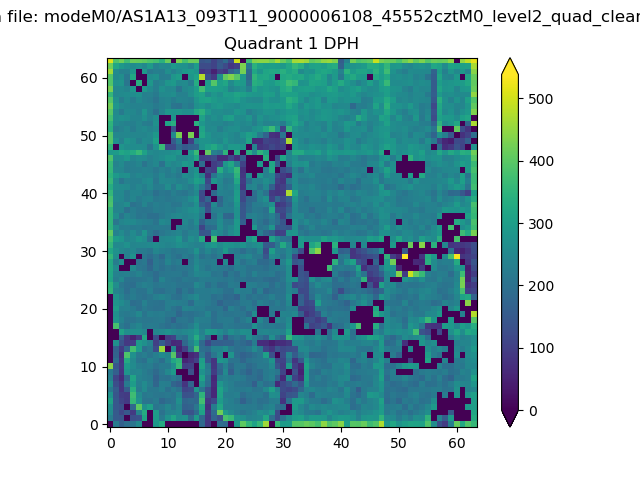 |
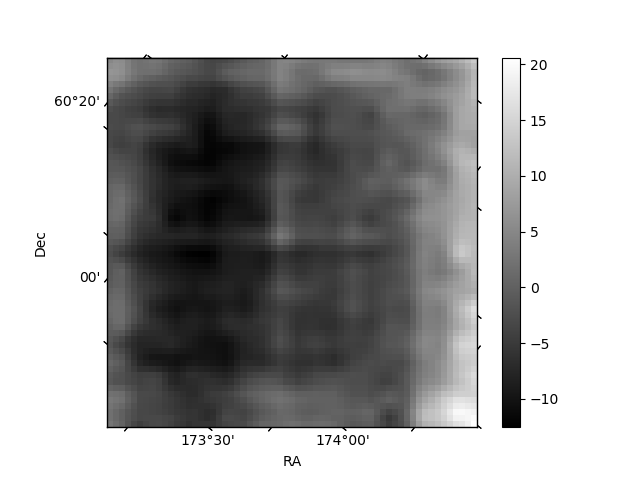
Quadrant B |
|---|---|---|---|
| Quadrant D | 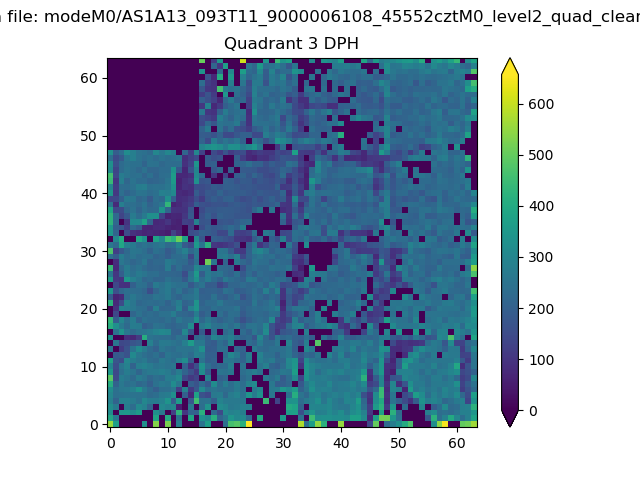 |
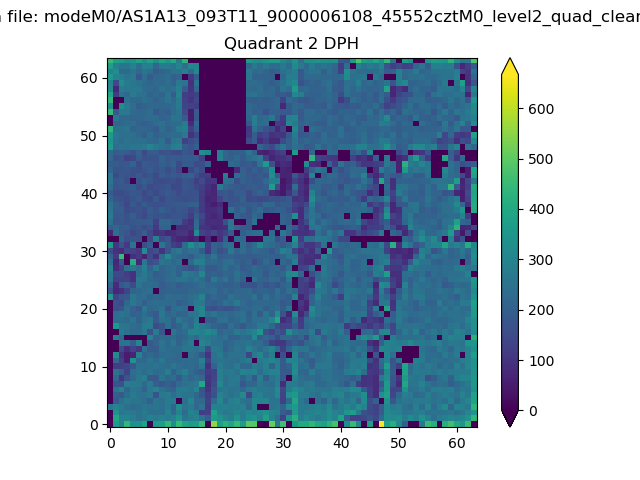 |
Quadrant C |
| Plot type | Count rate plots | Images |
|---|---|---|
| Comparison with Poisson distribution Blue bars denote a histogram of data divided into 1 sec bins. Red curve is a Poisson curve with rate = median count rate of data. |
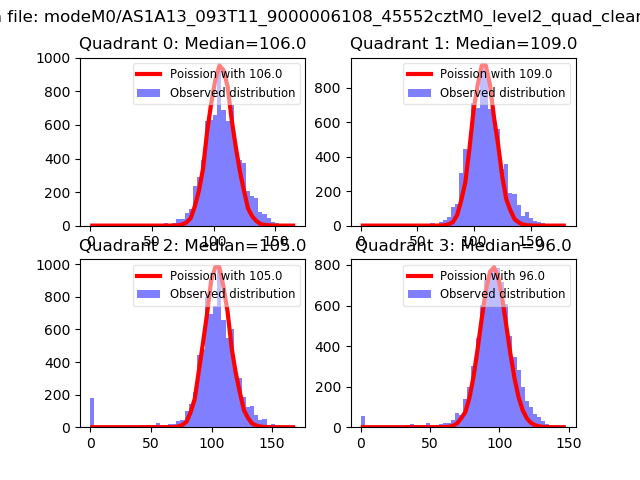 |
 |
| Quadrant-wise count rates Data is divided into 100 sec bins |
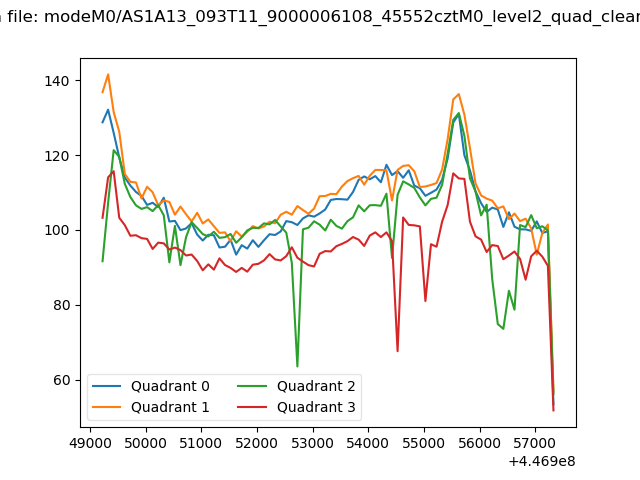 |
|
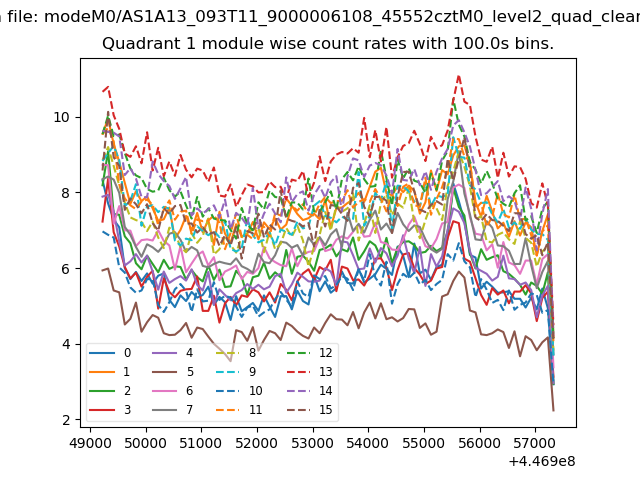
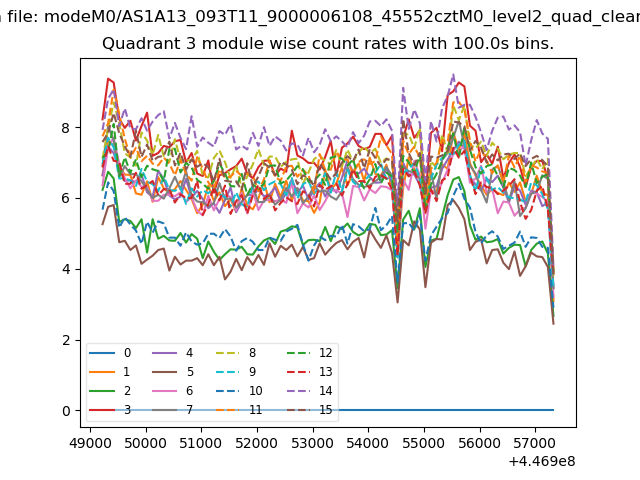
| Module-wise count rates for Quadrant A Data is divided into 100 sec bins |
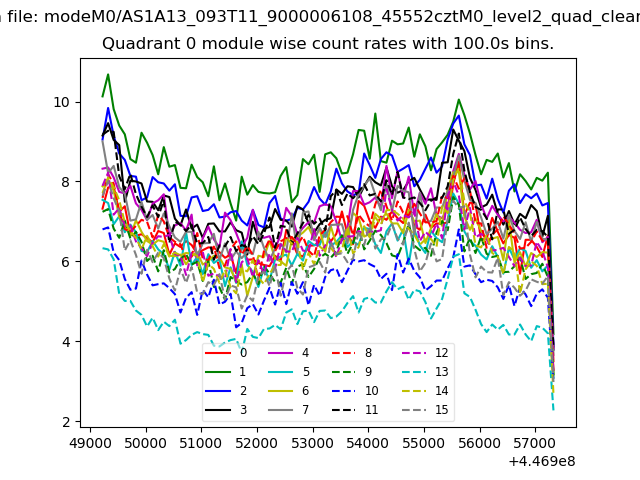 |
 |
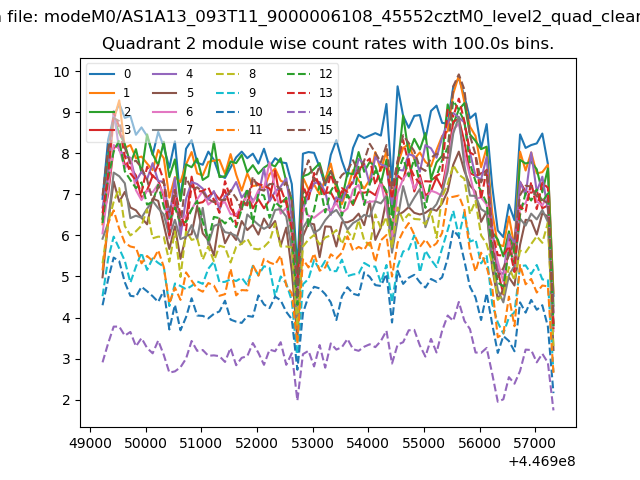
| Module-wise count rates for Quadrant B Data is divided into 100 sec bins |
 |
 |
| Module-wise count rates for Quadrant C Data is divided into 100 sec bins |
 |
 |
| Module-wise count rates for Quadrant D Data is divided into 100 sec bins |
 |
 |
| Parameter | Plot |
|---|---|
| CZT HV Monitor | 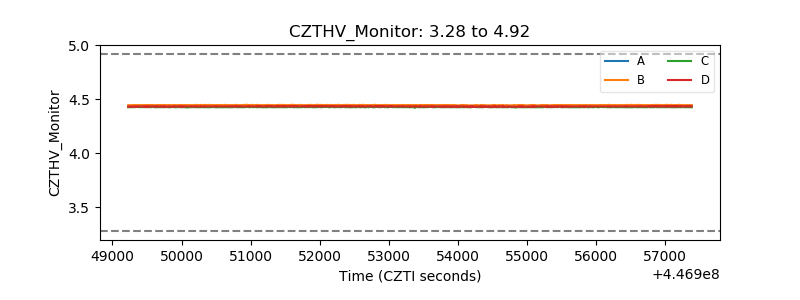 |
| D_VDD | 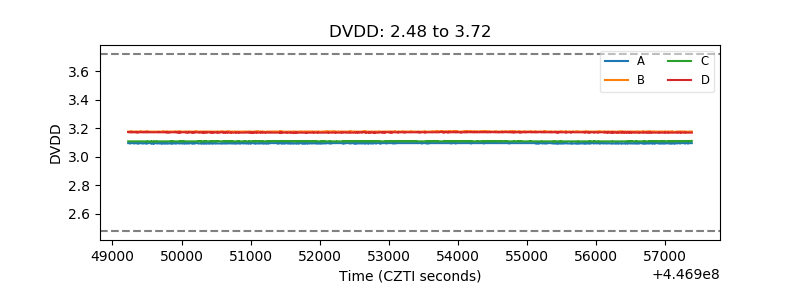 |
| Temperature 1 | 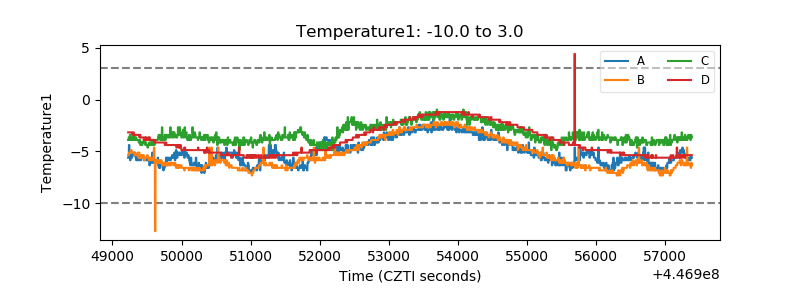 |
| Veto HV Monitor | 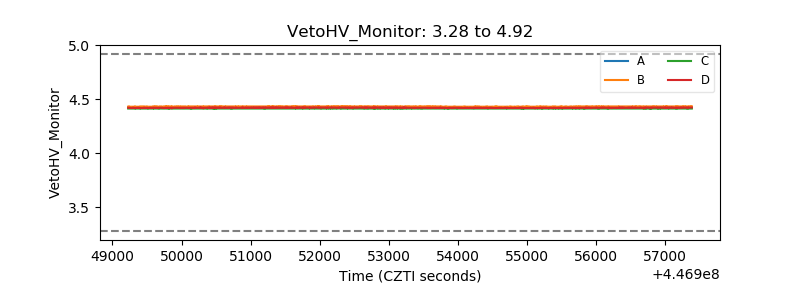 |
| Veto LLD | 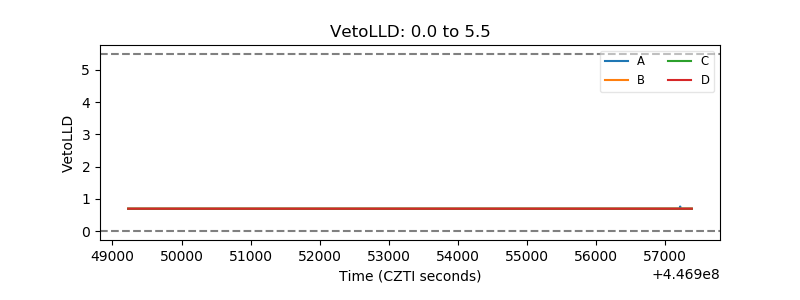 |
| Alpha Counter | 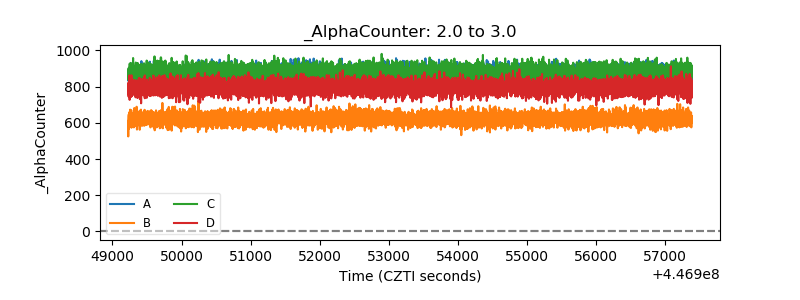 |
| _CPM_Rate | 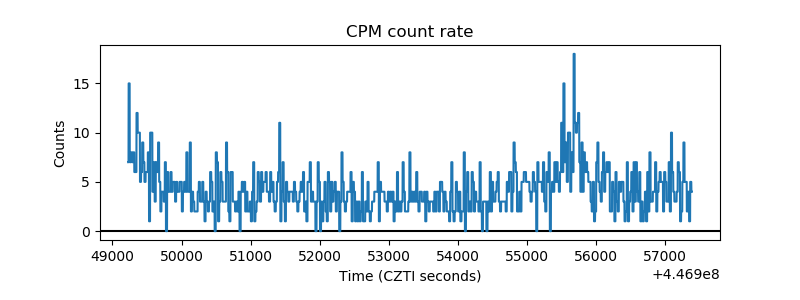 |
| CZT Counter | 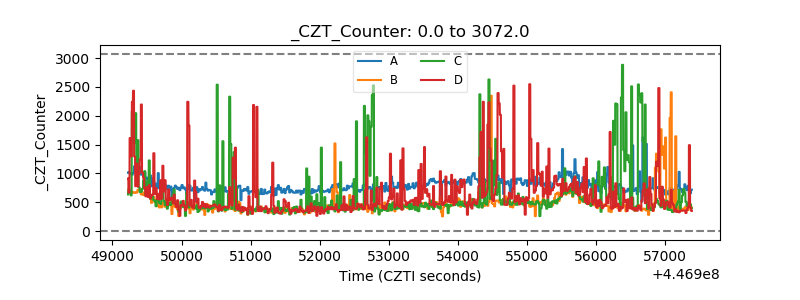 |
| +2.5 Volts monitor | 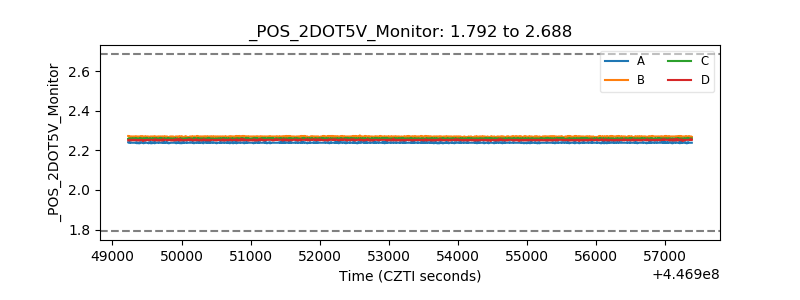 |
| +5 Volts monitor | 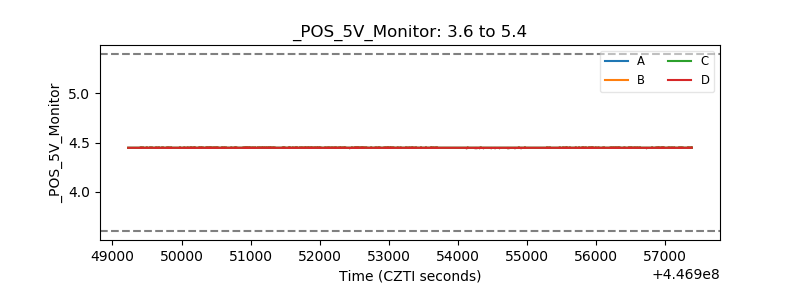 |
| _ROLL_ROT | 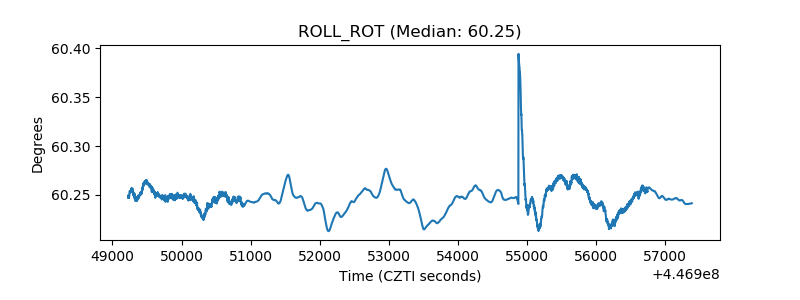 |
| _Roll_DEC | 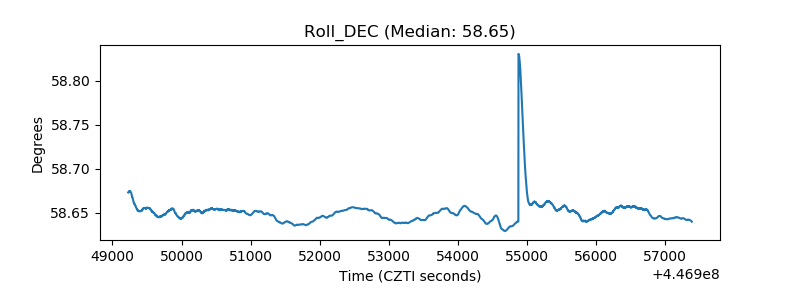 |
| _Roll_RA | 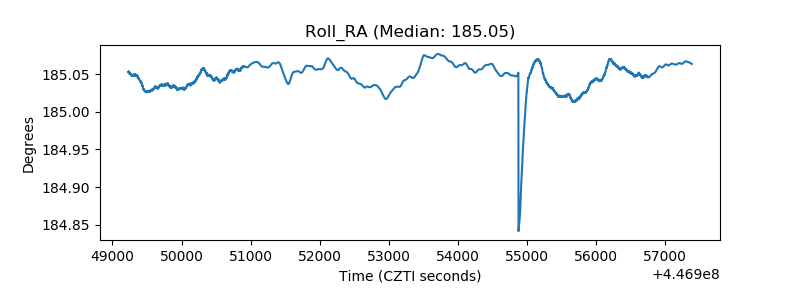 |
| Veto Counter | 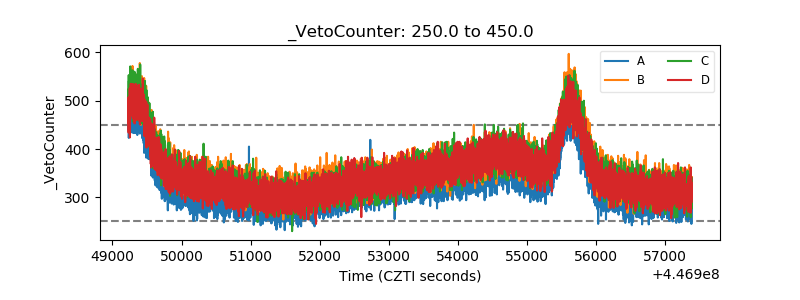 |