| Param | Original file | Final file |
|---|---|---|
| Filename | modeM0/AS1A13_093T11_9000006108_45555cztM0_level2.fits | modeM0/AS1A13_093T11_9000006108_45555cztM0_level2_quad_clean.evt |
| Size (bytes) | 1,487,255,040 | 301,095,360 |
| Size | 1.4 GB | 287.1 MB |
| Events in quadrant A | 16,156,082 | 2,001,148 |
| Events in quadrant B | 9,519,094 | 2,087,043 |
| Events in quadrant C | 13,564,722 | 1,934,213 |
| Events in quadrant D | 14,301,862 | 1,745,832 |
| Mode M9 | |||
|---|---|---|---|
| Quadrant | BADHDUFLAG | Total packets | Discarded packets |
| A | 0 | 14 | 0 |
| B | 0 | 14 | 0 |
| C | 0 | 14 | 0 |
| D | 0 | 14 | 0 |
| Mode M0 | |||
|---|---|---|---|
| Quadrant | BADHDUFLAG | Total packets | Discarded packets |
| A | 0 | 62130 | 67 |
| B | 0 | 42407 | 46 |
| C | 0 | 54153 | 52 |
| D | 0 | 56482 | 79 |
| Mode SS | |||
|---|---|---|---|
| Quadrant | BADHDUFLAG | Total packets | Discarded packets |
| A | 0 | 398 | 0 |
| B | 0 | 398 | 0 |
| C | 0 | 398 | 2 |
| D | 0 | 398 | 0 |
| Quadrant | Total seconds | Saturated seconds | Saturation percentage |
|---|---|---|---|
| A | 19569 | 610 | 3.117175% |
| B | 19570 | 361 | 1.844660% |
| C | 19566 | 1202 | 6.143310% |
| D | 19564 | 1428 | 7.299121% |
Noise dominated data is calculated using 1-second bins in cleaned event files. If a bin has >2000 counts, and if more than 50% of those come from <1% of pixels, then it is considered to be noise-dominated and hence unusable.
| Quadrant | # 1 sec bins | Bins with >0 counts | Bins with >2000 counts | High rate bins dominated by noise | Noise dominated (total time) | Noise dominated (detector-on time) | Marked lightcurve |
|---|---|---|---|---|---|---|---|
| A | 20965 | 19594 | 180 | 180 | 0.86% | 0.92% | 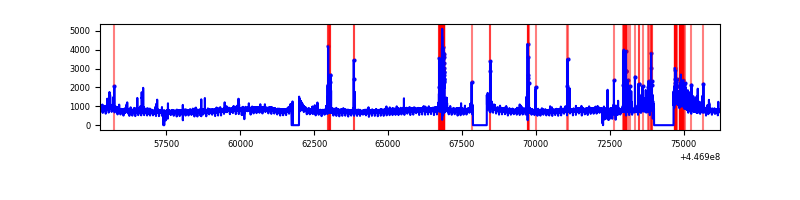 |
| B | 20965 | 19592 | 67 | 67 | 0.32% | 0.34% | 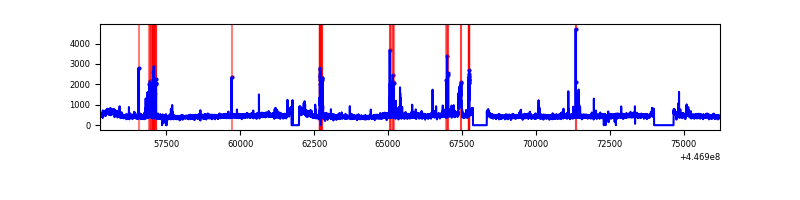 |
| C | 20965 | 19592 | 993 | 993 | 4.74% | 5.07% | 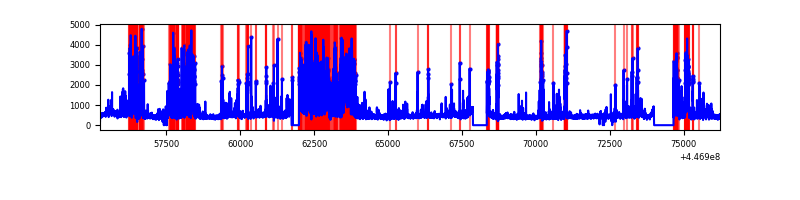 |
| D | 20965 | 19590 | 1063 | 1063 | 5.07% | 5.43% | 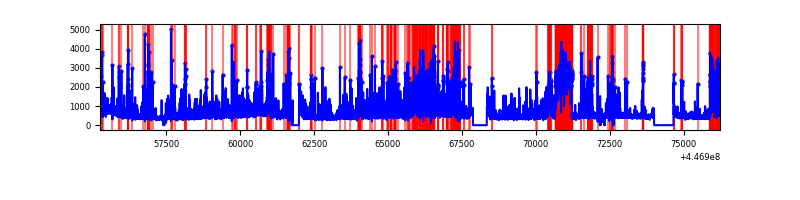 |
Top three noisy pixels from each quadrant. If the there are fewer than three noisy pixels in the level2.evt file, extra rows are filled as -1
| Pixel properties | Quadrant properties | ||||||
|---|---|---|---|---|---|---|---|
| Quadrant | DetID | PixID | Counts | Sigma | Mean | Median | Sigma |
| A | 10 | 83 | 6961416 | 15743.98 | 2145 | 2097 | 442.0 |
| A | 10 | 248 | 589841 | 1329.65 | 2145 | 2097 | 442.0 |
| A | 13 | 248 | 254747 | 571.57 | 2145 | 2097 | 442.0 |
| B | 15 | 201 | 617605 | 1453.11 | 2155 | 2087 | 423.6 |
| B | 0 | 189 | 194175 | 453.48 | 2155 | 2087 | 423.6 |
| B | 5 | 172 | 157217 | 366.23 | 2155 | 2087 | 423.6 |
| C | 12 | 2 | 4711569 | 9572.0 | 2088 | 2097 | 492.0 |
| C | 14 | 254 | 695676 | 1409.7 | 2088 | 2097 | 492.0 |
| C | 1 | 3 | 18059 | 32.44 | 2088 | 2097 | 492.0 |
| D | 1 | 52 | 3076307 | 5959.02 | 2064 | 2000 | 515.9 |
| D | 7 | 38 | 1590672 | 3079.37 | 2064 | 2000 | 515.9 |
| D | 12 | 233 | 747796 | 1445.6 | 2064 | 2000 | 515.9 |
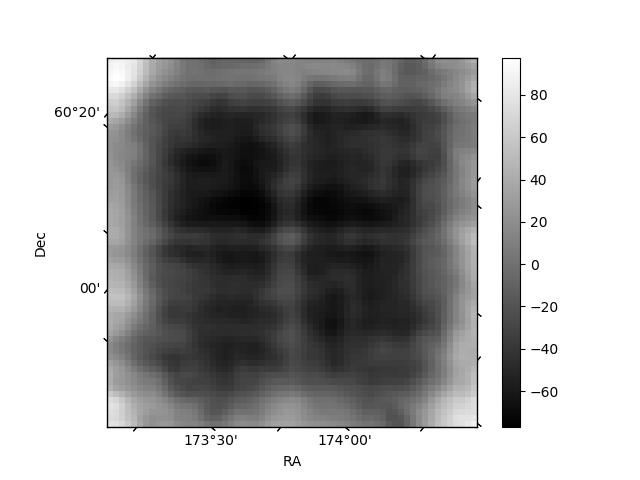
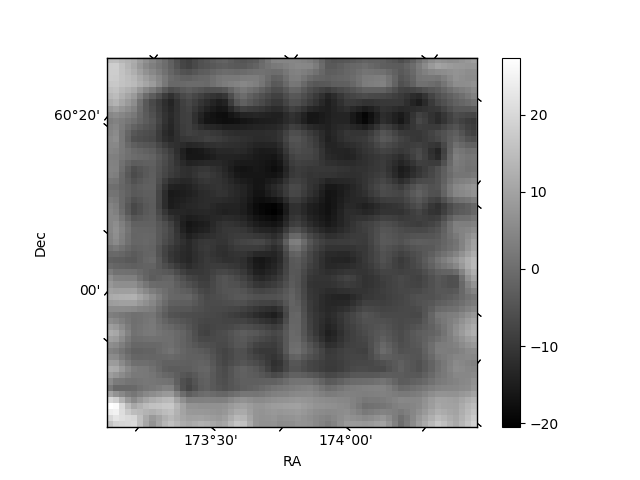
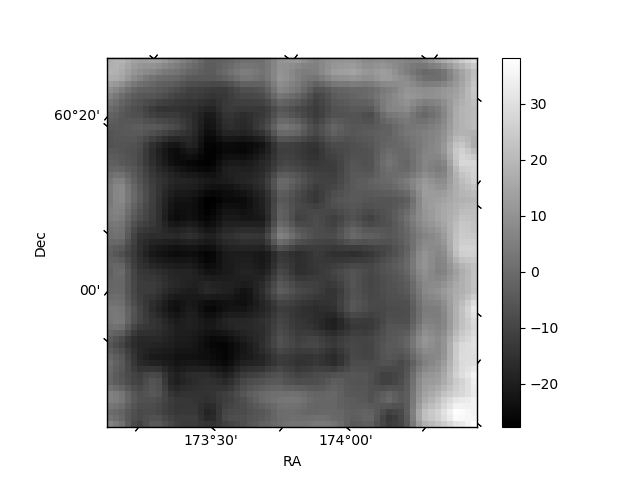
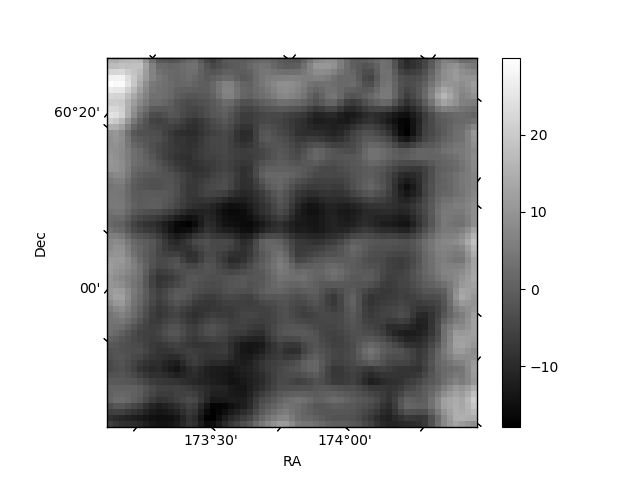
Histogram calculated using DETX and DETY for each event in the final _common_clean file
| Quadrant A | 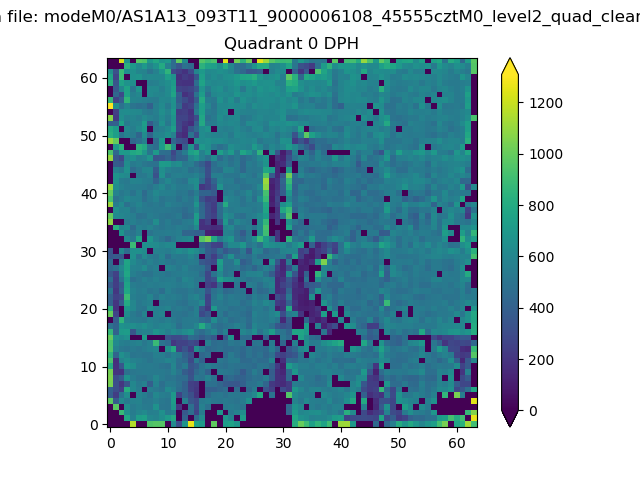 |
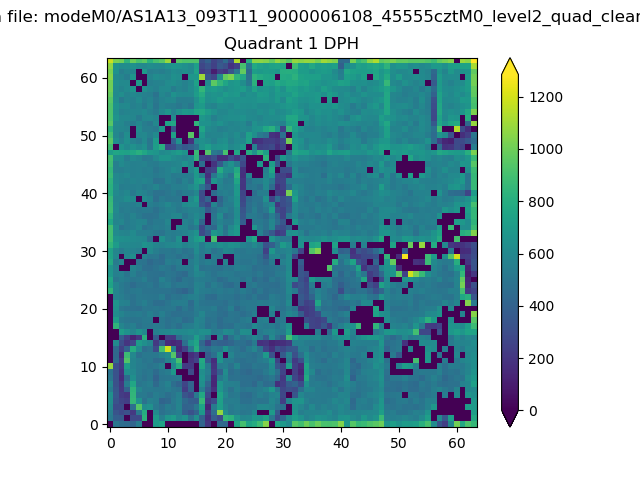 |
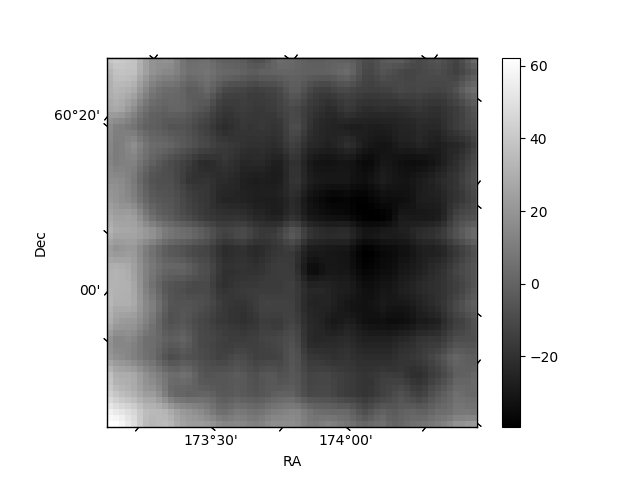
Quadrant B |
|---|---|---|---|
| Quadrant D | 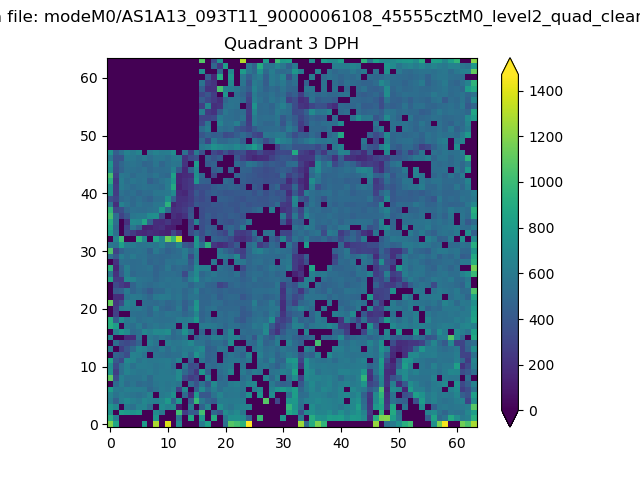 |
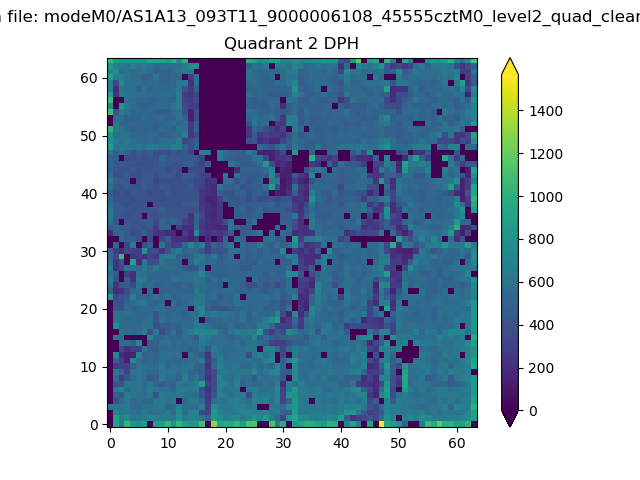 |
Quadrant C |
| Plot type | Count rate plots | Images |
|---|---|---|
| Comparison with Poisson distribution Blue bars denote a histogram of data divided into 1 sec bins. Red curve is a Poisson curve with rate = median count rate of data. |
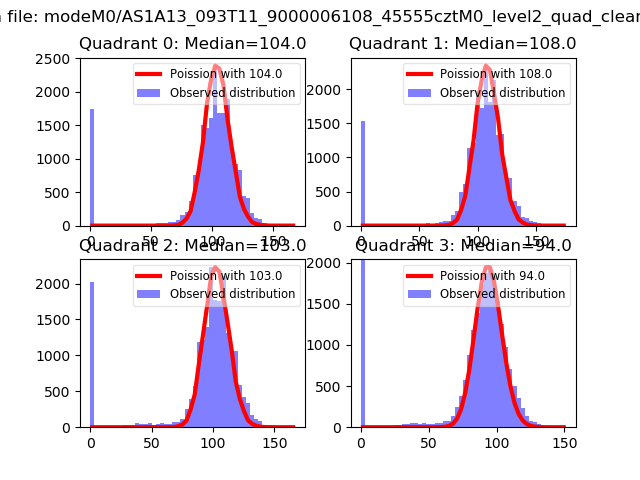 |
 |
| Quadrant-wise count rates Data is divided into 100 sec bins |
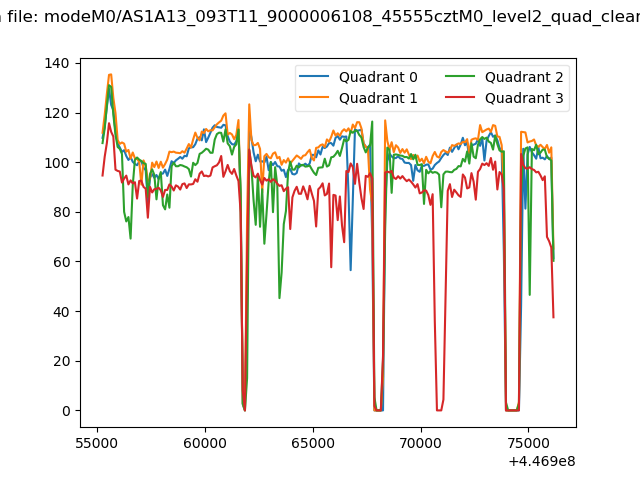 |
|
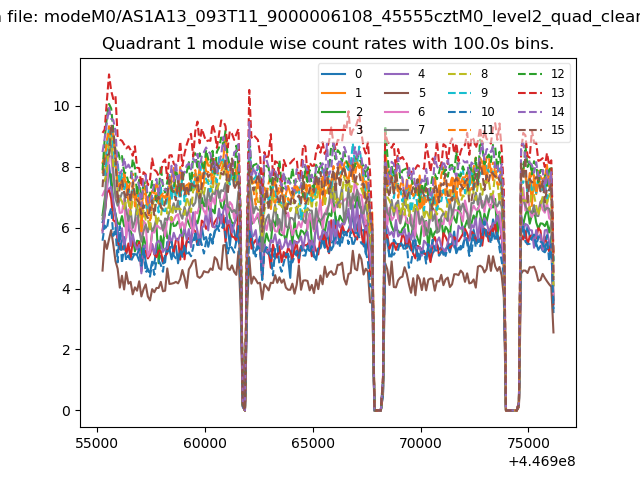
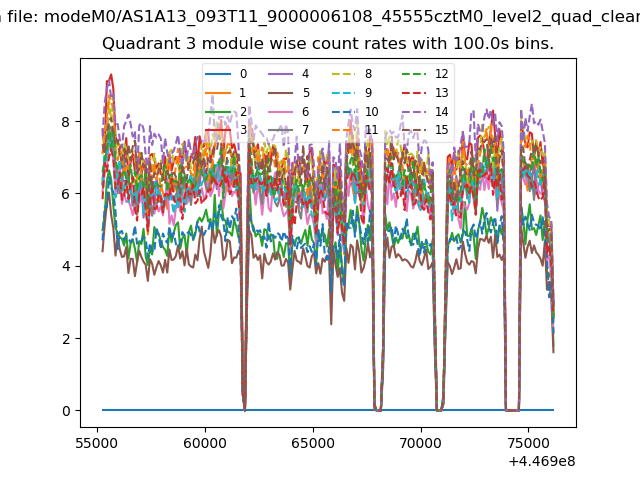
| Module-wise count rates for Quadrant A Data is divided into 100 sec bins |
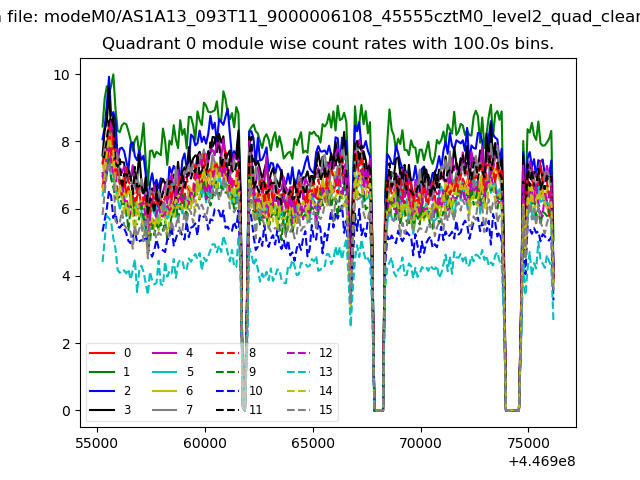 |
 |
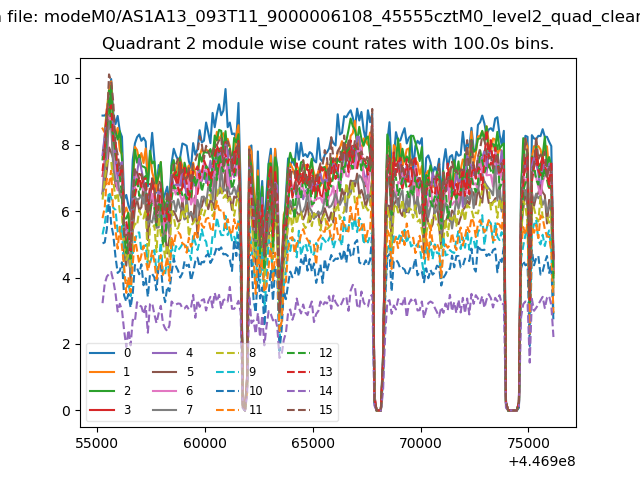
| Module-wise count rates for Quadrant B Data is divided into 100 sec bins |
 |
 |
| Module-wise count rates for Quadrant C Data is divided into 100 sec bins |
 |
 |
| Module-wise count rates for Quadrant D Data is divided into 100 sec bins |
 |
 |
| Parameter | Plot |
|---|---|
| CZT HV Monitor | 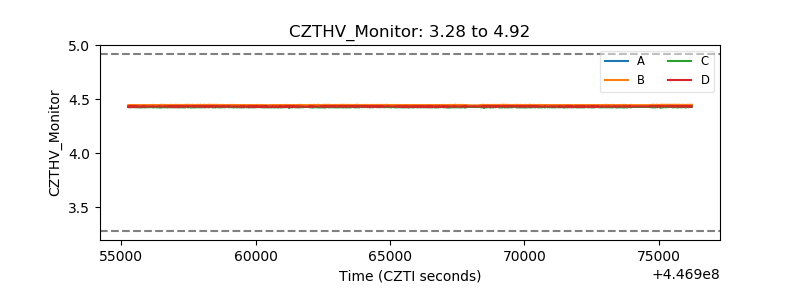 |
| D_VDD | 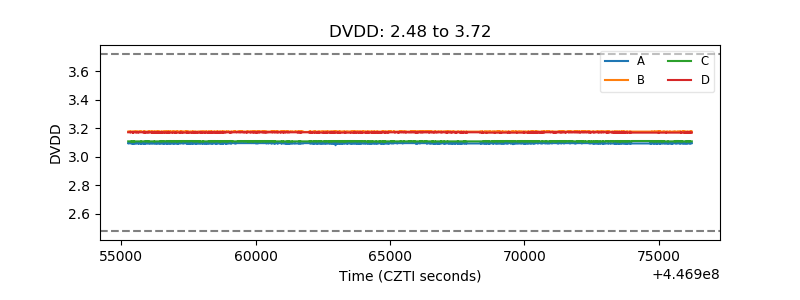 |
| Temperature 1 | 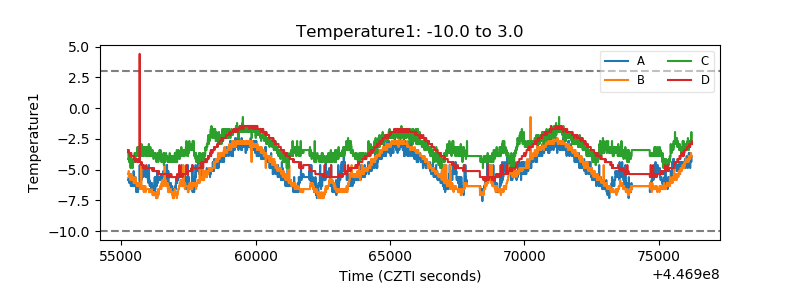 |
| Veto HV Monitor | 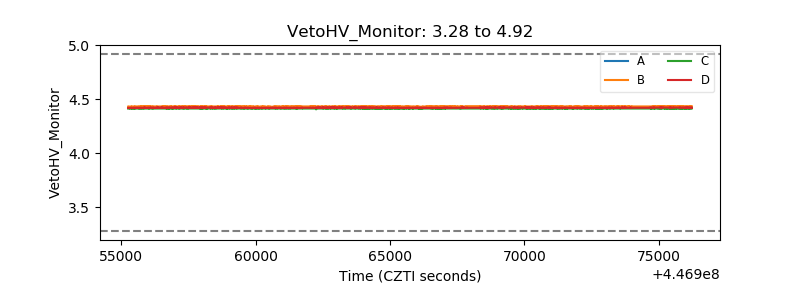 |
| Veto LLD | 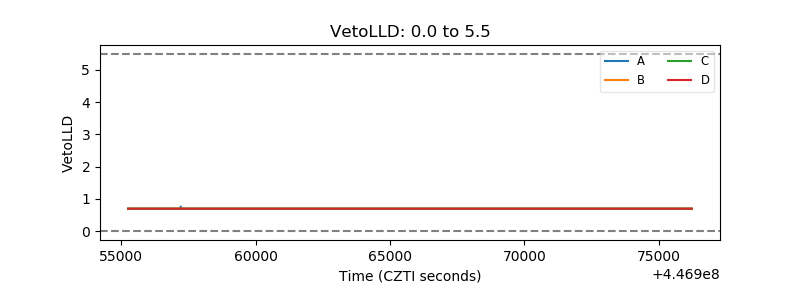 |
| Alpha Counter | 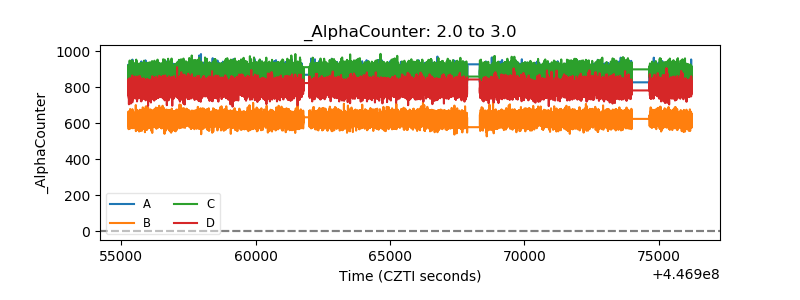 |
| _CPM_Rate | 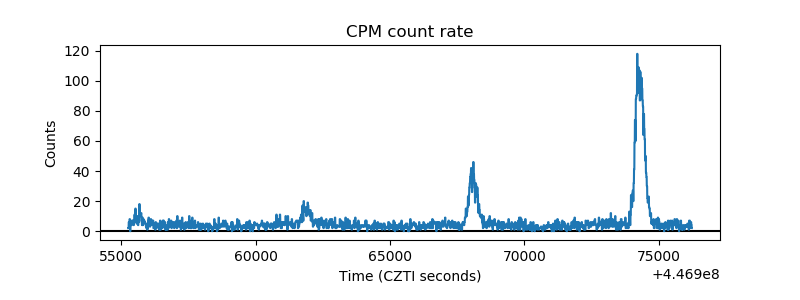 |
| CZT Counter | 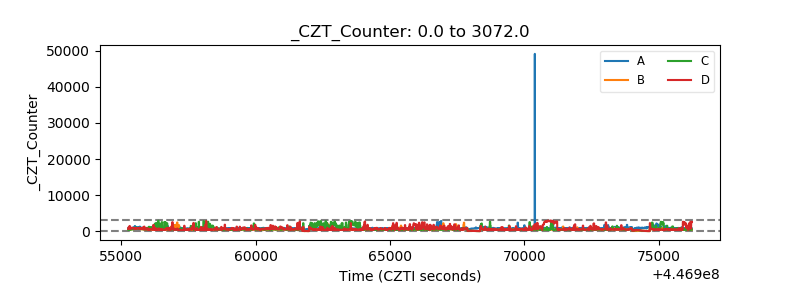 |
| +2.5 Volts monitor | 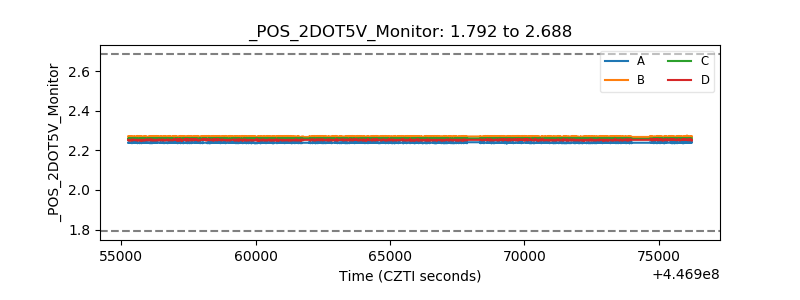 |
| +5 Volts monitor |  |
| _ROLL_ROT | 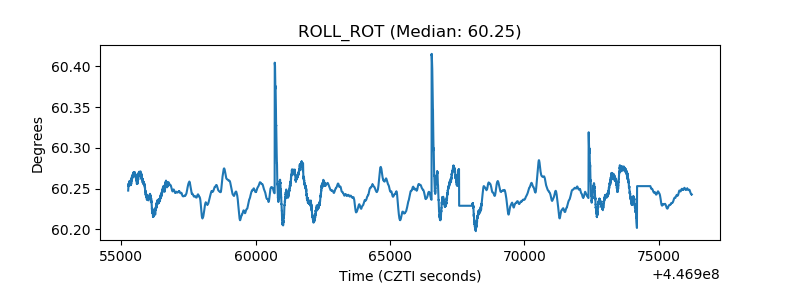 |
| _Roll_DEC | 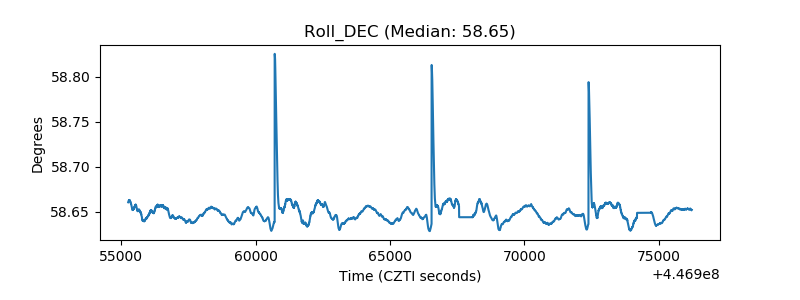 |
| _Roll_RA | 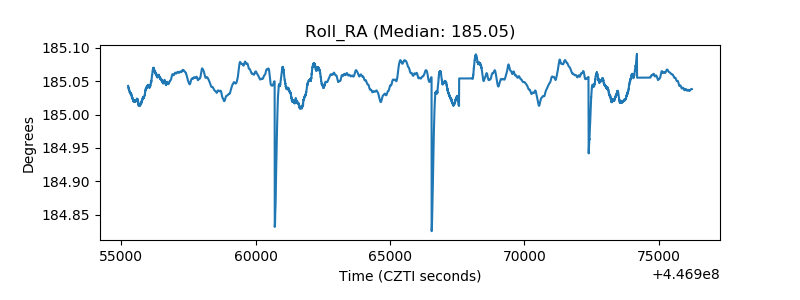 |
| Veto Counter | 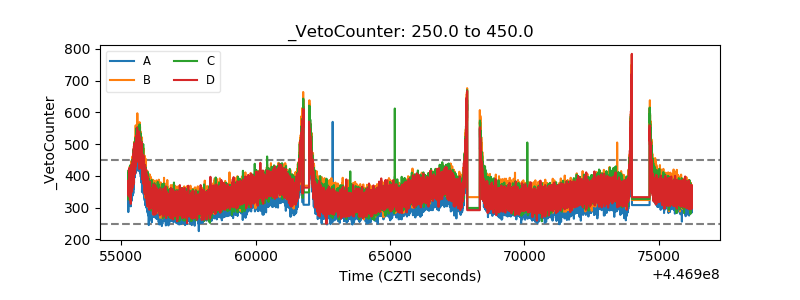 |