| Param | Original file | Final file |
|---|---|---|
| Filename | modeM0/AS1A13_093T11_9000006108_45556cztM0_level2.fits | modeM0/AS1A13_093T11_9000006108_45556cztM0_level2_quad_clean.evt |
| Size (bytes) | 551,612,160 | 106,266,240 |
| Size | 526.1 MB | 101.3 MB |
| Events in quadrant A | 6,761,920 | 692,062 |
| Events in quadrant B | 3,248,015 | 748,532 |
| Events in quadrant C | 3,579,034 | 711,174 |
| Events in quadrant D | 6,292,216 | 583,423 |
| Mode M9 | |||
|---|---|---|---|
| Quadrant | BADHDUFLAG | Total packets | Discarded packets |
| A | 0 | 8 | 0 |
| B | 0 | 8 | 0 |
| C | 0 | 8 | 0 |
| D | 0 | 8 | 0 |
| Mode M0 | |||
|---|---|---|---|
| Quadrant | BADHDUFLAG | Total packets | Discarded packets |
| A | 0 | 24870 | 1 |
| B | 0 | 14537 | 1 |
| C | 0 | 15674 | 1 |
| D | 0 | 23529 | 1 |
| Mode SS | |||
|---|---|---|---|
| Quadrant | BADHDUFLAG | Total packets | Discarded packets |
| A | 0 | 140 | 0 |
| B | 0 | 140 | 0 |
| C | 0 | 140 | 0 |
| D | 0 | 140 | 0 |
| Quadrant | Total seconds | Saturated seconds | Saturation percentage |
|---|---|---|---|
| A | 6925 | 564 | 8.144404% |
| B | 6926 | 138 | 1.992492% |
| C | 6926 | 206 | 2.974300% |
| D | 6926 | 1036 | 14.958129% |
Noise dominated data is calculated using 1-second bins in cleaned event files. If a bin has >2000 counts, and if more than 50% of those come from <1% of pixels, then it is considered to be noise-dominated and hence unusable.
| Quadrant | # 1 sec bins | Bins with >0 counts | Bins with >2000 counts | High rate bins dominated by noise | Noise dominated (total time) | Noise dominated (detector-on time) | Marked lightcurve |
|---|---|---|---|---|---|---|---|
| A | 7750 | 6925 | 299 | 299 | 3.86% | 4.32% | 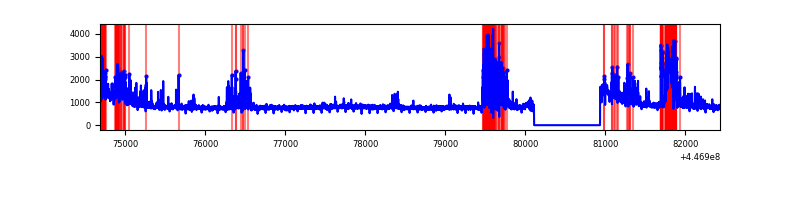 |
| B | 7751 | 6927 | 13 | 13 | 0.17% | 0.19% | 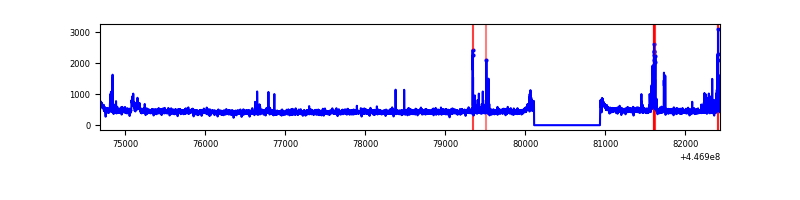 |
| C | 7751 | 6927 | 119 | 119 | 1.54% | 1.72% | 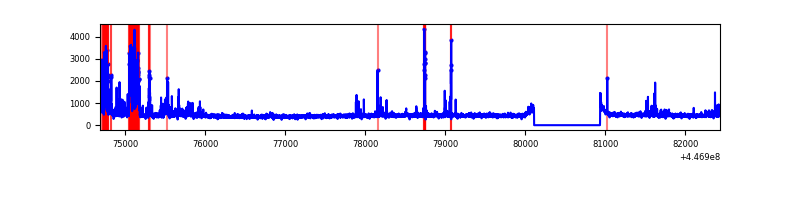 |
| D | 7751 | 6927 | 822 | 822 | 10.61% | 11.87% | 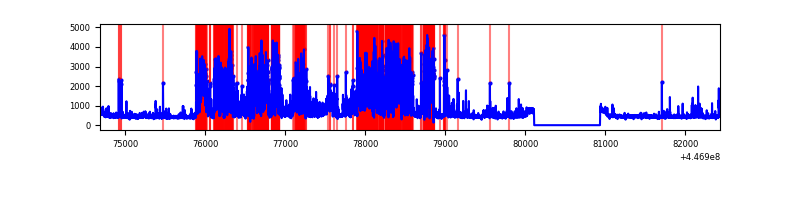 |
Top three noisy pixels from each quadrant. If the there are fewer than three noisy pixels in the level2.evt file, extra rows are filled as -1
| Pixel properties | Quadrant properties | ||||||
|---|---|---|---|---|---|---|---|
| Quadrant | DetID | PixID | Counts | Sigma | Mean | Median | Sigma |
| A | 10 | 83 | 2647398 | 16762.08 | 755 | 739 | 157.9 |
| A | 13 | 248 | 742821 | 4699.83 | 755 | 739 | 157.9 |
| A | 10 | 248 | 451117 | 2852.38 | 755 | 739 | 157.9 |
| B | 0 | 189 | 140260 | 923.2 | 767 | 742 | 151.1 |
| B | 5 | 172 | 45546 | 296.47 | 767 | 742 | 151.1 |
| B | 12 | 111 | 19963 | 127.19 | 767 | 742 | 151.1 |
| C | 12 | 2 | 492773 | 2775.28 | 752 | 756 | 177.3 |
| C | 14 | 254 | 147681 | 828.75 | 752 | 756 | 177.3 |
| C | 13 | 61 | 4954 | 23.68 | 752 | 756 | 177.3 |
| D | 12 | 233 | 3303581 | 18359.34 | 721 | 698 | 179.9 |
| D | 1 | 52 | 76410 | 420.85 | 721 | 698 | 179.9 |
| D | 2 | 249 | 55774 | 306.14 | 721 | 698 | 179.9 |
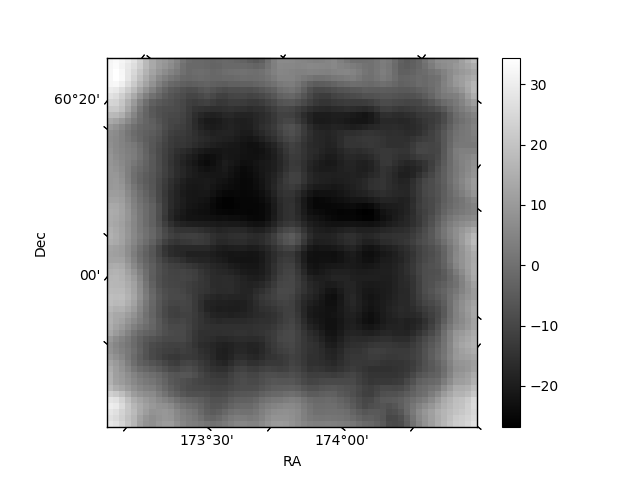
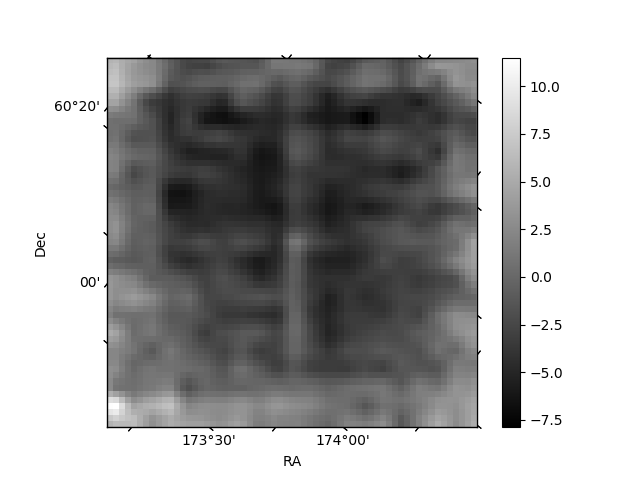
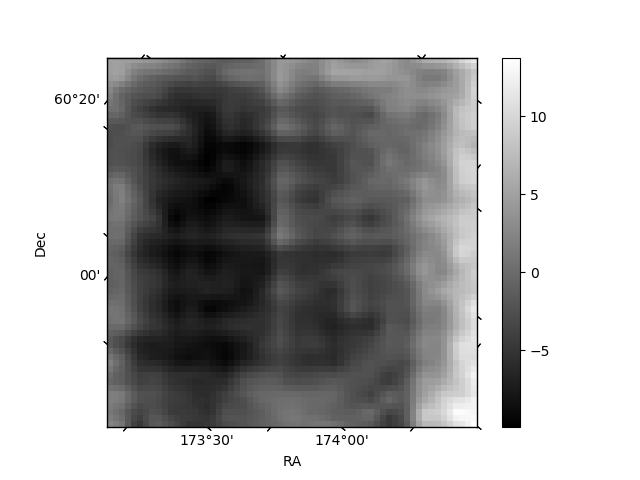
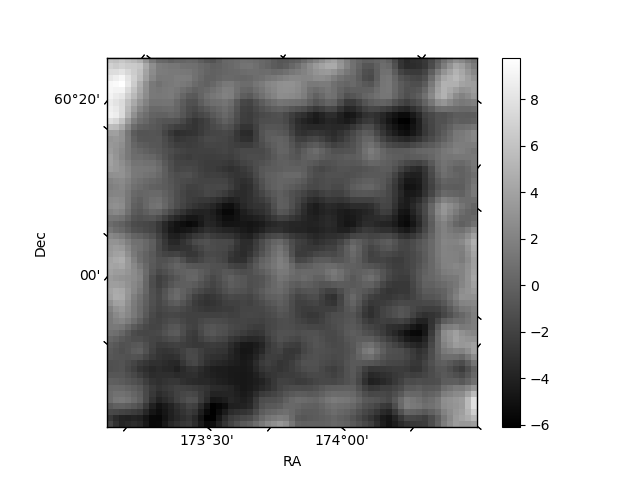
Histogram calculated using DETX and DETY for each event in the final _common_clean file
| Quadrant A | 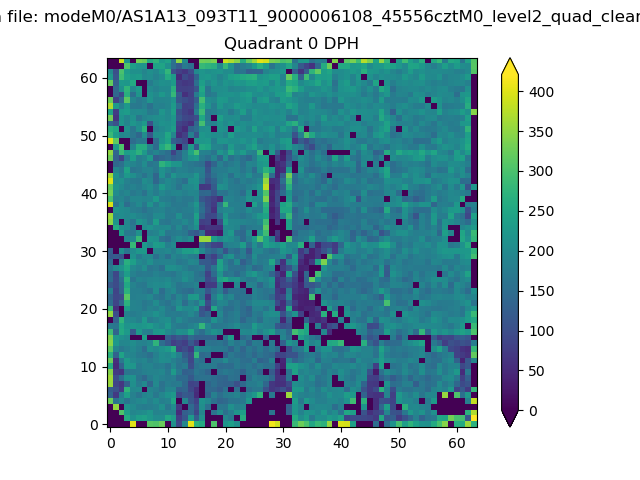 |
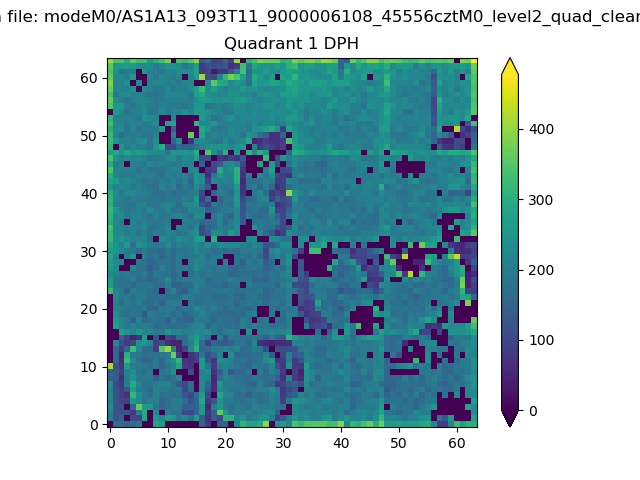 |
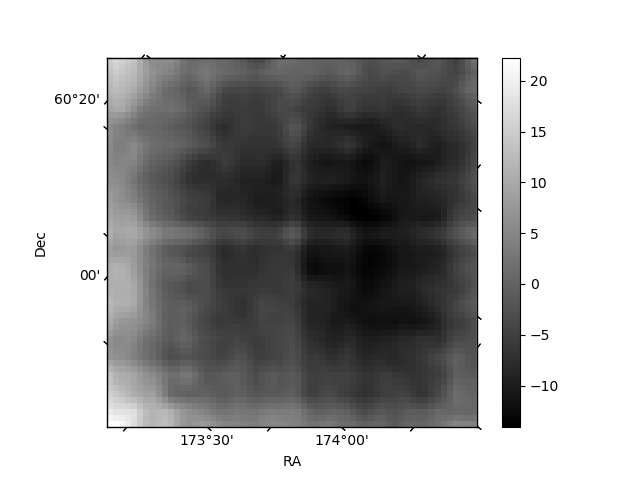
Quadrant B |
|---|---|---|---|
| Quadrant D | 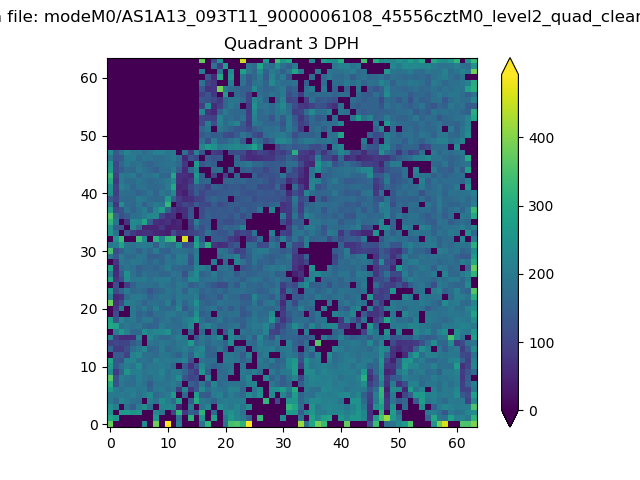 |
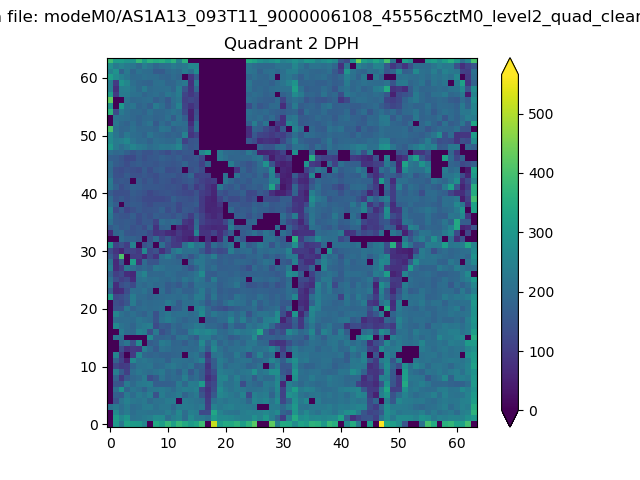 |
Quadrant C |
| Plot type | Count rate plots | Images |
|---|---|---|
| Comparison with Poisson distribution Blue bars denote a histogram of data divided into 1 sec bins. Red curve is a Poisson curve with rate = median count rate of data. |
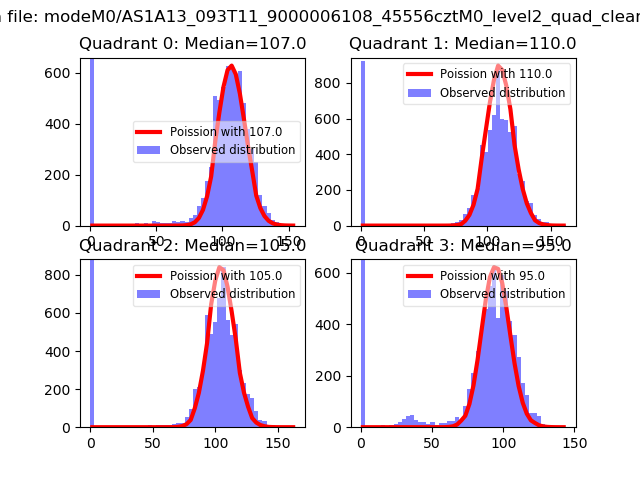 |
 |
| Quadrant-wise count rates Data is divided into 100 sec bins |
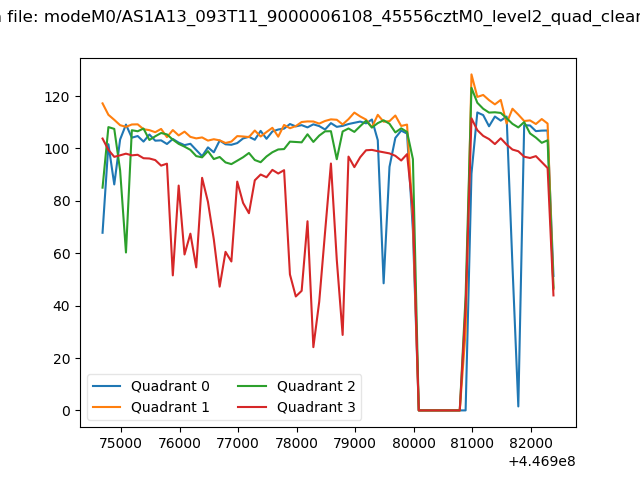 |
|
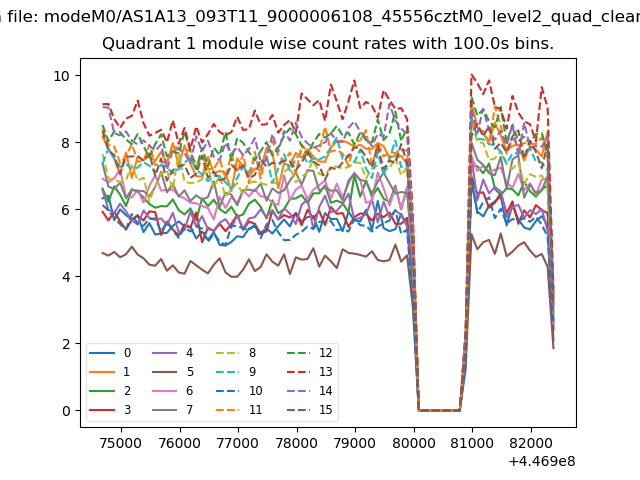
| Module-wise count rates for Quadrant A Data is divided into 100 sec bins |
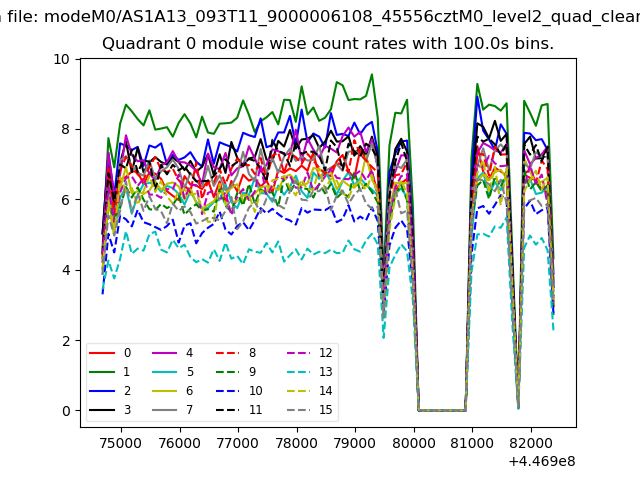 |
 |
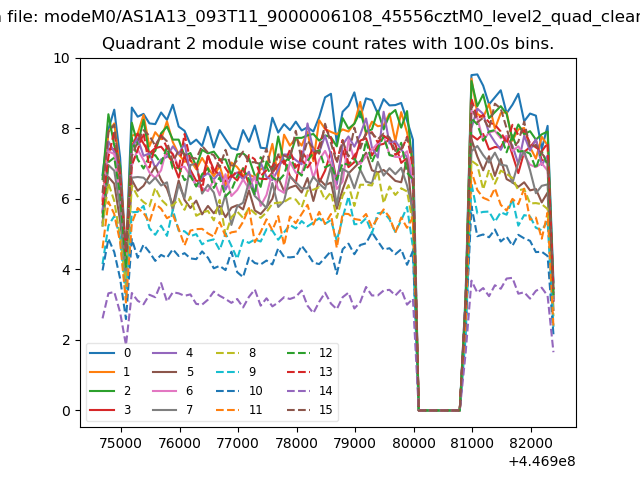
| Module-wise count rates for Quadrant B Data is divided into 100 sec bins |
 |
 |
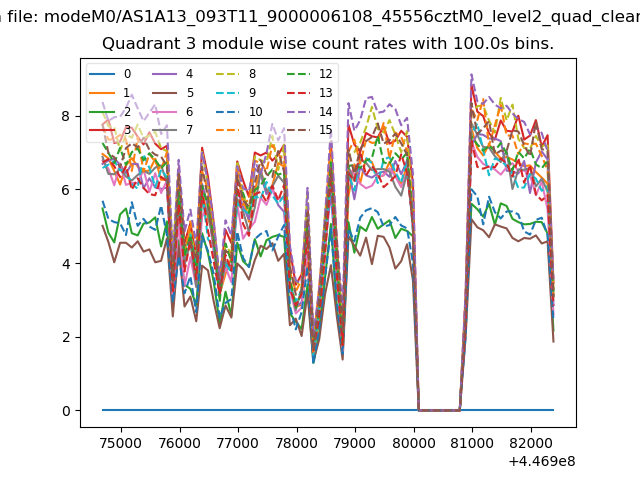
| Module-wise count rates for Quadrant C Data is divided into 100 sec bins |
 |
 |
| Module-wise count rates for Quadrant D Data is divided into 100 sec bins |
 |
 |
| Parameter | Plot |
|---|---|
| CZT HV Monitor | 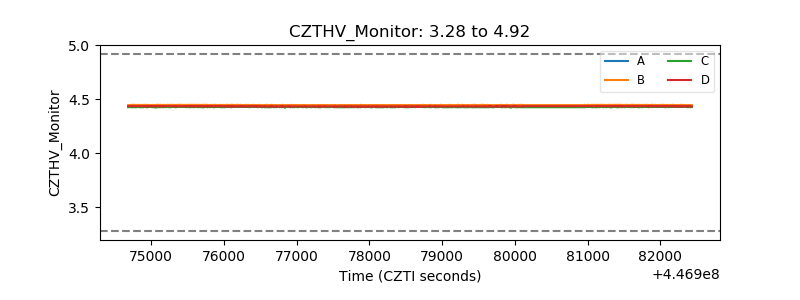 |
| D_VDD | 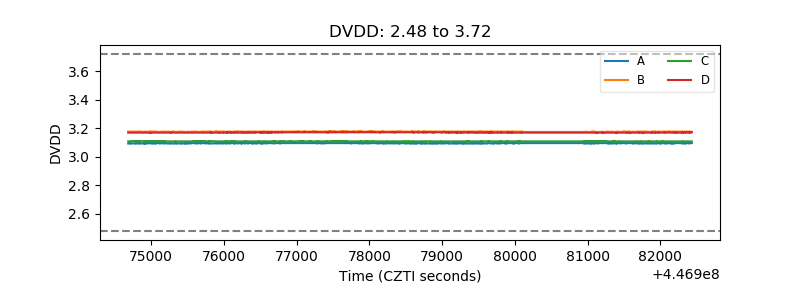 |
| Temperature 1 | 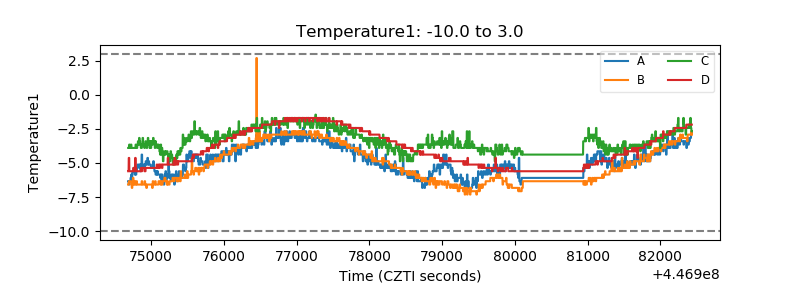 |
| Veto HV Monitor | 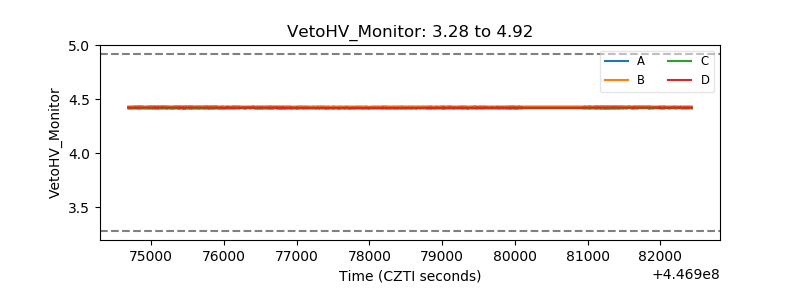 |
| Veto LLD | 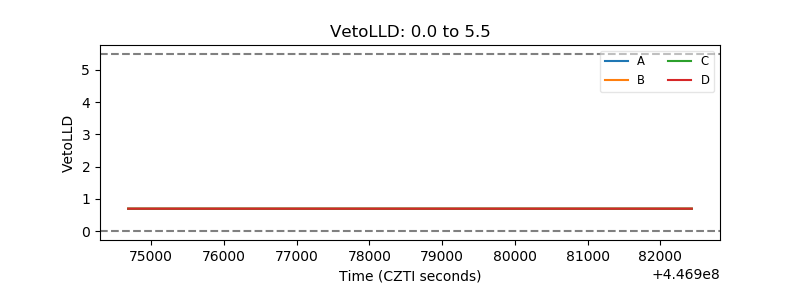 |
| Alpha Counter | 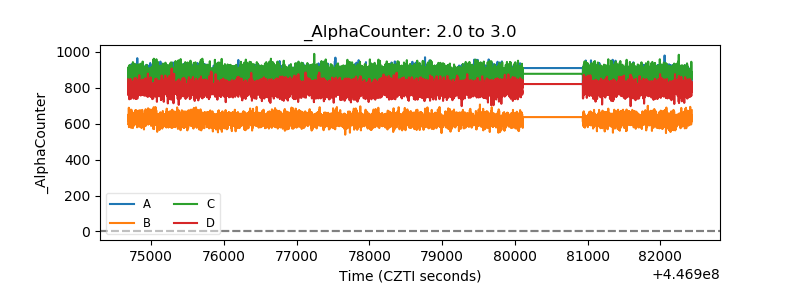 |
| _CPM_Rate | 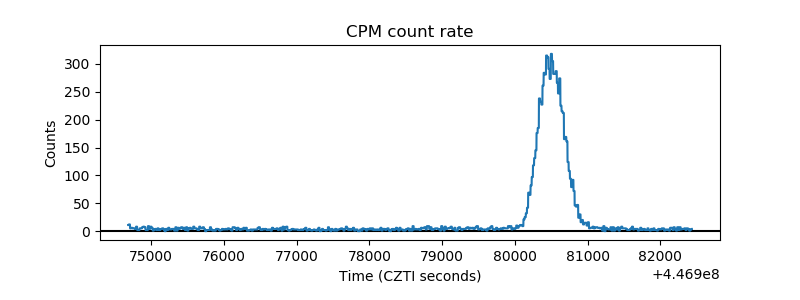 |
| CZT Counter | 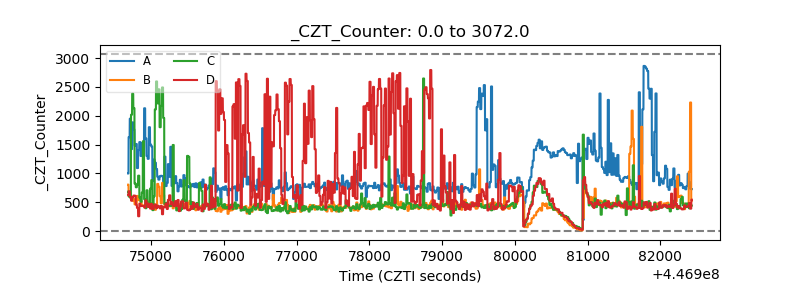 |
| +2.5 Volts monitor | 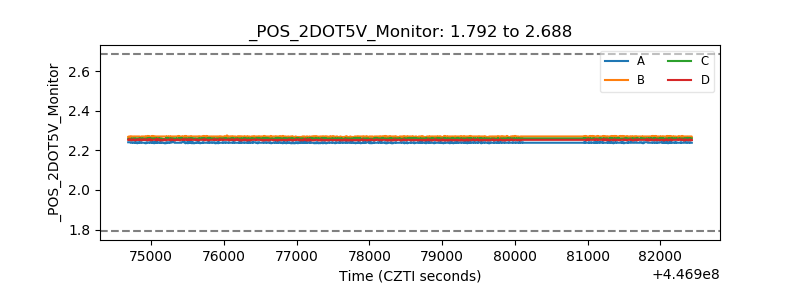 |
| +5 Volts monitor | 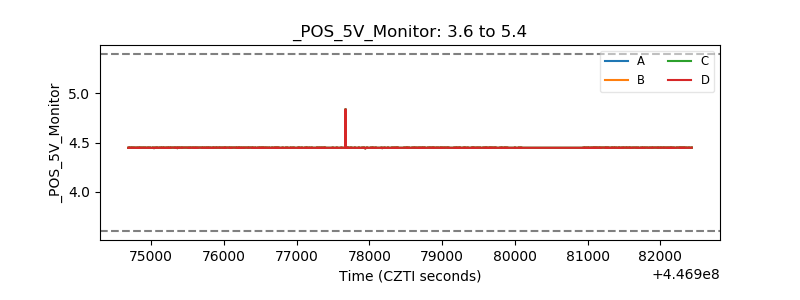 |
| _ROLL_ROT | 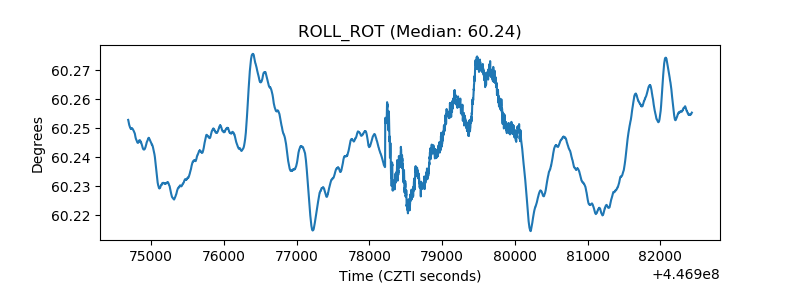 |
| _Roll_DEC | 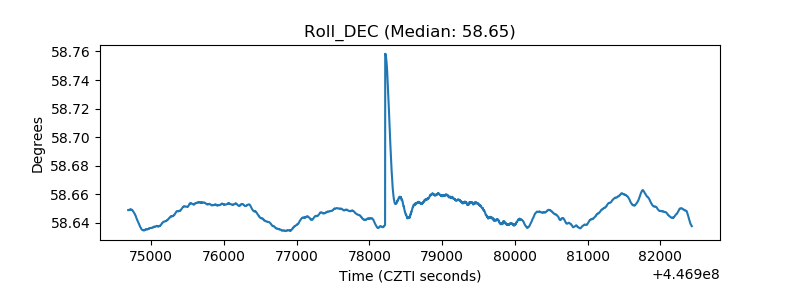 |
| _Roll_RA | 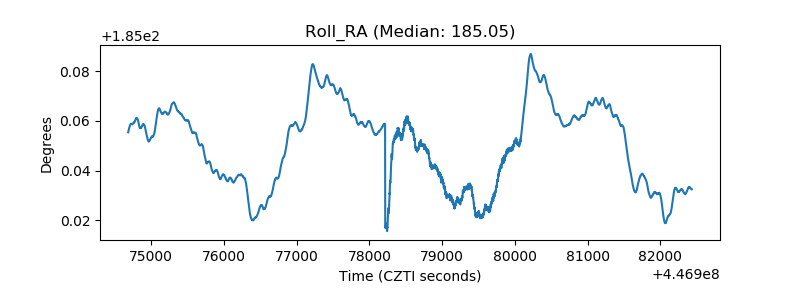 |
| Veto Counter | 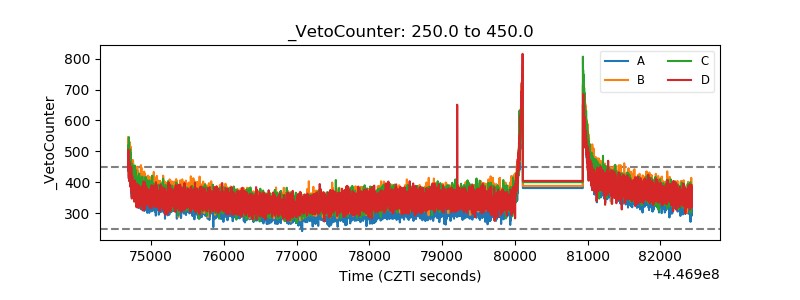 |