| Param | Original file | Final file |
|---|---|---|
| Filename | modeM0/AS1A13_093T11_9000006108_45558cztM0_level2.fits | modeM0/AS1A13_093T11_9000006108_45558cztM0_level2_quad_clean.evt |
| Size (bytes) | 470,211,840 | 110,615,040 |
| Size | 448.4 MB | 105.5 MB |
| Events in quadrant A | 6,713,606 | 707,231 |
| Events in quadrant B | 3,332,130 | 764,723 |
| Events in quadrant C | 3,246,601 | 730,248 |
| Events in quadrant D | 3,585,475 | 673,543 |
| Mode M9 | |||
|---|---|---|---|
| Quadrant | BADHDUFLAG | Total packets | Discarded packets |
| A | 0 | 13 | 0 |
| B | 0 | 13 | 0 |
| C | 0 | 14 | 0 |
| D | 0 | 14 | 0 |
| Mode M0 | |||
|---|---|---|---|
| Quadrant | BADHDUFLAG | Total packets | Discarded packets |
| A | 0 | 24600 | 2 |
| B | 0 | 14483 | 2 |
| C | 0 | 14438 | 2 |
| D | 0 | 15434 | 2 |
| Mode SS | |||
|---|---|---|---|
| Quadrant | BADHDUFLAG | Total packets | Discarded packets |
| A | 0 | 138 | 0 |
| B | 0 | 138 | 0 |
| C | 0 | 138 | 0 |
| D | 0 | 138 | 0 |
| Quadrant | Total seconds | Saturated seconds | Saturation percentage |
|---|---|---|---|
| A | 6797 | 564 | 8.297778% |
| B | 6797 | 129 | 1.897896% |
| C | 6796 | 81 | 1.191878% |
| D | 6796 | 107 | 1.574456% |
Noise dominated data is calculated using 1-second bins in cleaned event files. If a bin has >2000 counts, and if more than 50% of those come from <1% of pixels, then it is considered to be noise-dominated and hence unusable.
| Quadrant | # 1 sec bins | Bins with >0 counts | Bins with >2000 counts | High rate bins dominated by noise | Noise dominated (total time) | Noise dominated (detector-on time) | Marked lightcurve |
|---|---|---|---|---|---|---|---|
| A | 7812 | 6797 | 284 | 284 | 3.64% | 4.18% | 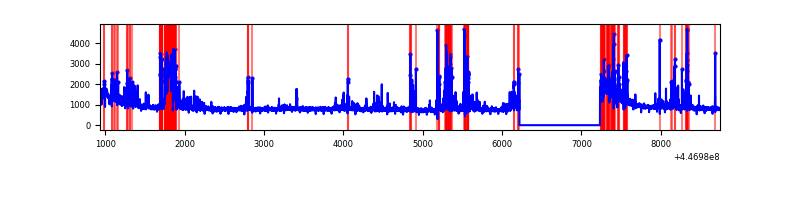 |
| B | 7812 | 6798 | 21 | 21 | 0.27% | 0.31% | 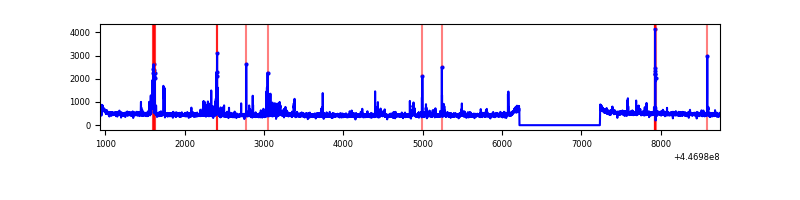 |
| C | 7811 | 6797 | 18 | 18 | 0.23% | 0.26% | 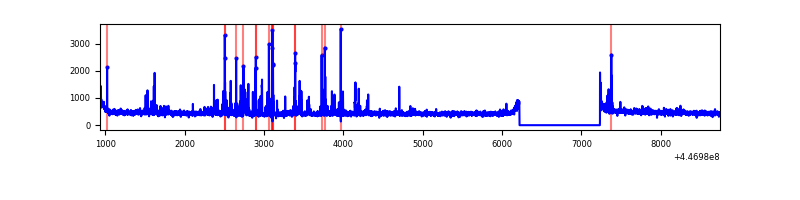 |
| D | 7811 | 6797 | 48 | 48 | 0.61% | 0.71% | 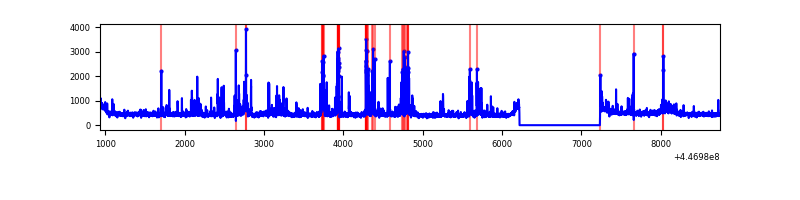 |
Top three noisy pixels from each quadrant. If the there are fewer than three noisy pixels in the level2.evt file, extra rows are filled as -1
| Pixel properties | Quadrant properties | ||||||
|---|---|---|---|---|---|---|---|
| Quadrant | DetID | PixID | Counts | Sigma | Mean | Median | Sigma |
| A | 10 | 83 | 2666125 | 16928.46 | 755 | 736 | 157.5 |
| A | 10 | 248 | 845284 | 5363.91 | 755 | 736 | 157.5 |
| A | 13 | 248 | 284802 | 1804.16 | 755 | 736 | 157.5 |
| B | 0 | 189 | 139322 | 917.53 | 769 | 745 | 151.0 |
| B | 5 | 172 | 77535 | 508.43 | 769 | 745 | 151.0 |
| B | 0 | 183 | 31973 | 206.76 | 769 | 745 | 151.0 |
| C | 14 | 254 | 248402 | 1401.21 | 758 | 764 | 176.7 |
| C | 12 | 2 | 27212 | 149.65 | 758 | 764 | 176.7 |
| C | 2 | 14 | 10653 | 55.96 | 758 | 764 | 176.7 |
| D | 1 | 52 | 293266 | 1524.4 | 761 | 737 | 191.9 |
| D | 12 | 233 | 159121 | 825.36 | 761 | 737 | 191.9 |
| D | 2 | 249 | 56542 | 290.81 | 761 | 737 | 191.9 |
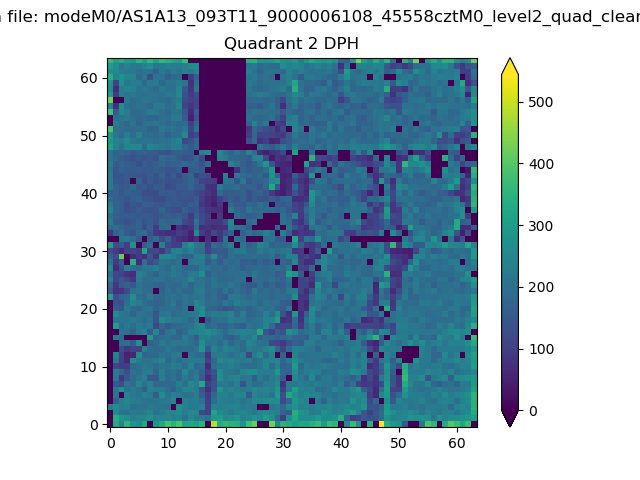
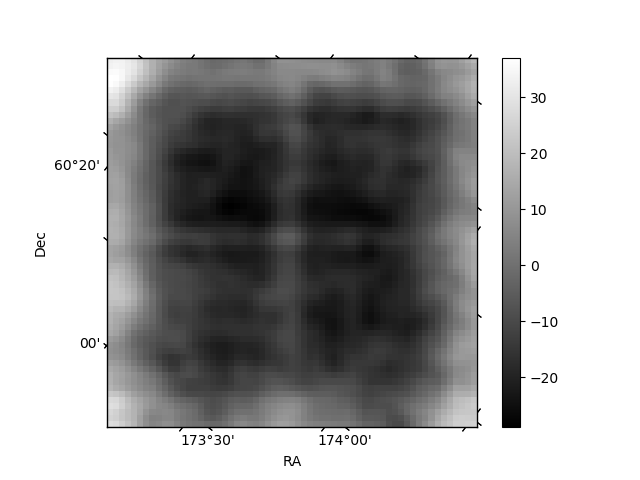
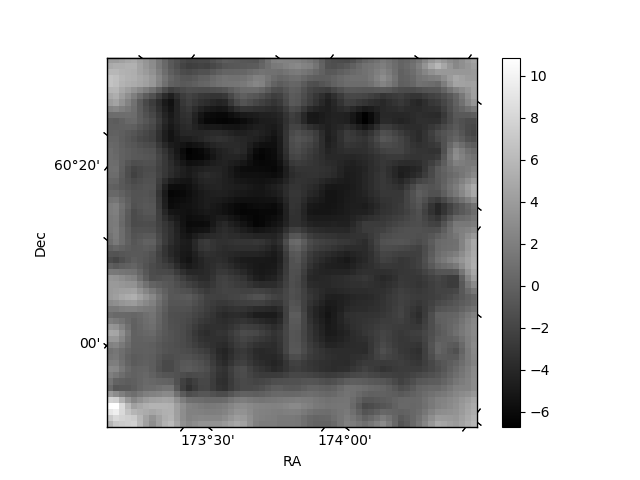
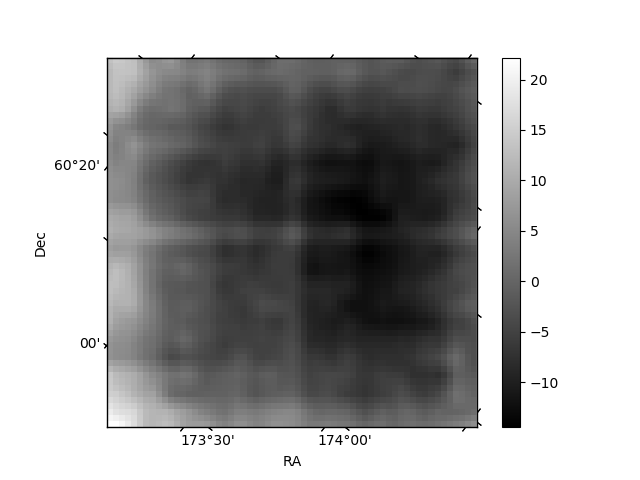
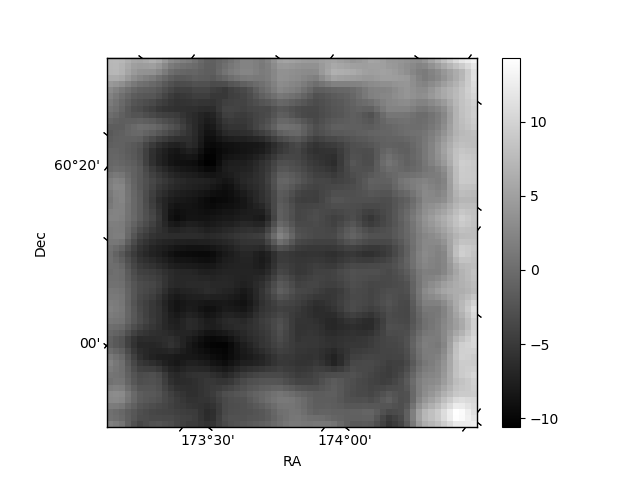
Histogram calculated using DETX and DETY for each event in the final _common_clean file
| Quadrant A | 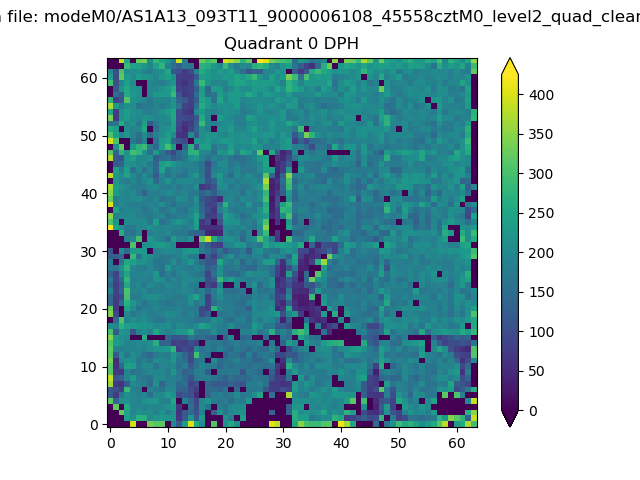 |
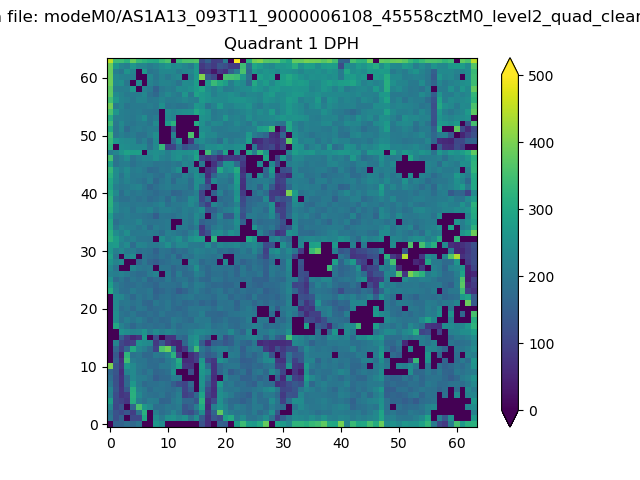 |
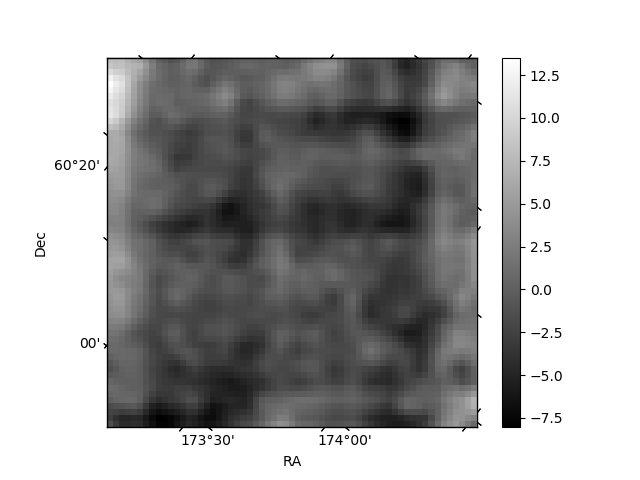
Quadrant B |
|---|---|---|---|
| Quadrant D | 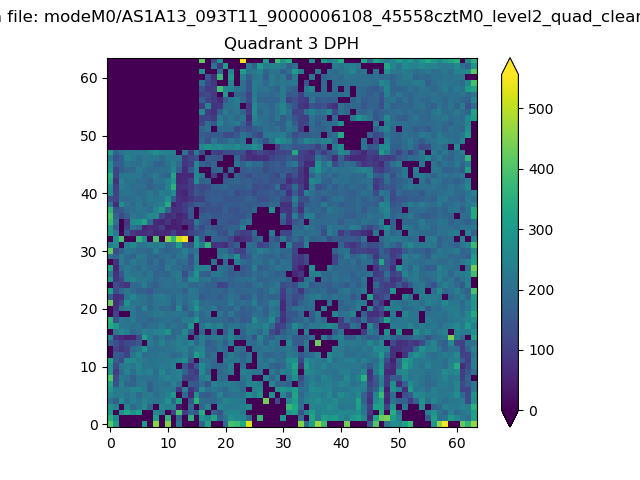 |
 |
Quadrant C |
| Plot type | Count rate plots | Images |
|---|---|---|
| Comparison with Poisson distribution Blue bars denote a histogram of data divided into 1 sec bins. Red curve is a Poisson curve with rate = median count rate of data. |
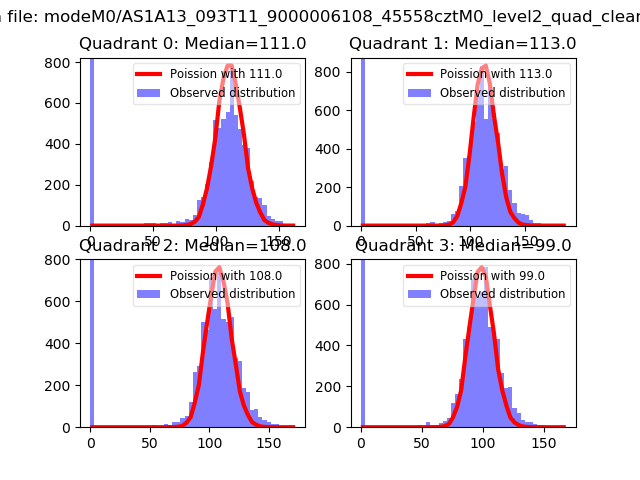 |
 |
| Quadrant-wise count rates Data is divided into 100 sec bins |
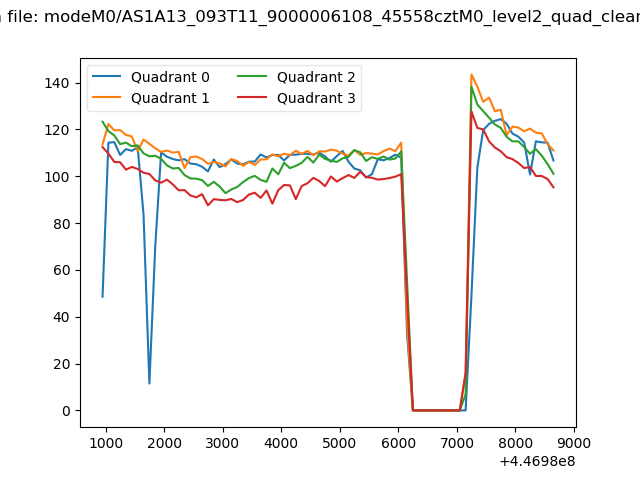 |
|
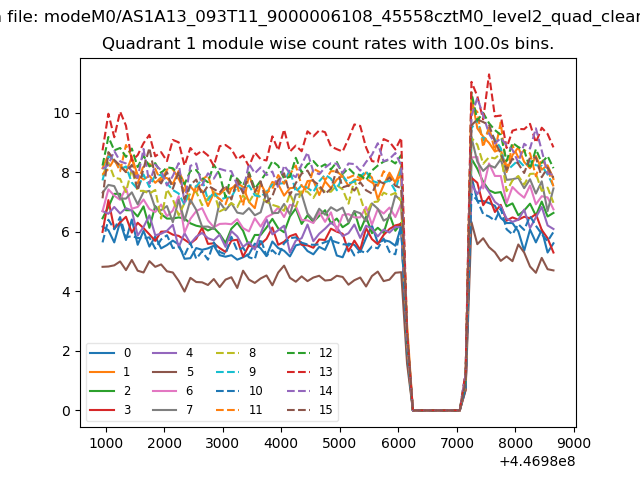
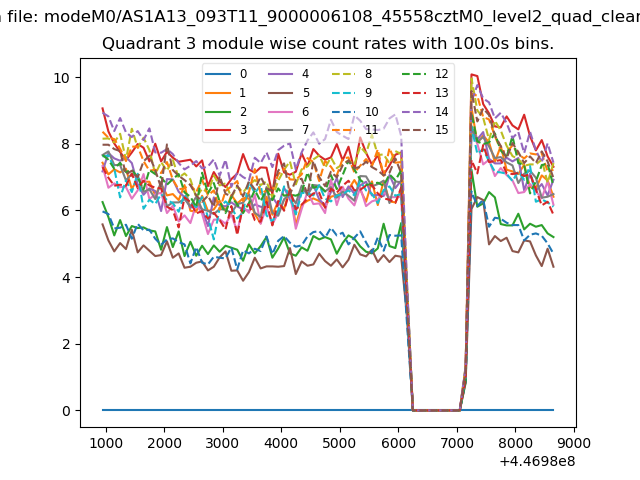
| Module-wise count rates for Quadrant A Data is divided into 100 sec bins |
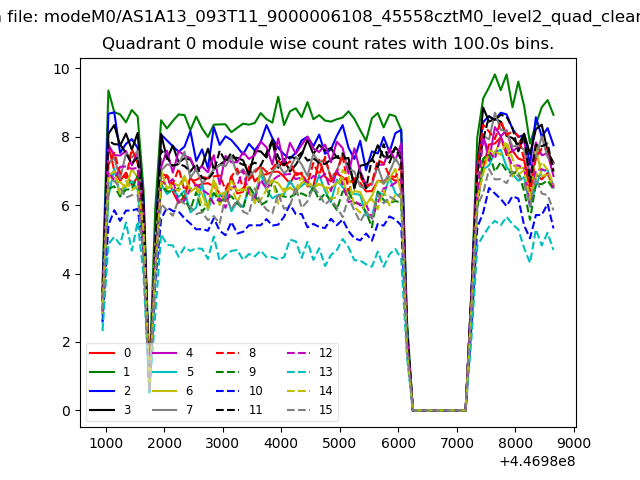 |
 |
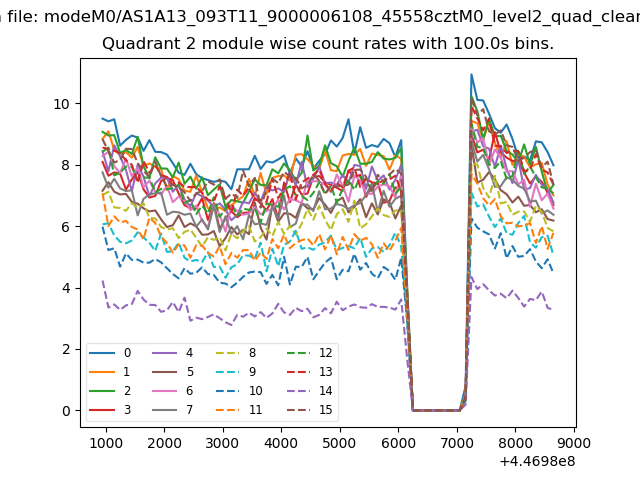
| Module-wise count rates for Quadrant B Data is divided into 100 sec bins |
 |
 |
| Module-wise count rates for Quadrant C Data is divided into 100 sec bins |
 |
 |
| Module-wise count rates for Quadrant D Data is divided into 100 sec bins |
 |
 |
| Parameter | Plot |
|---|---|
| CZT HV Monitor | 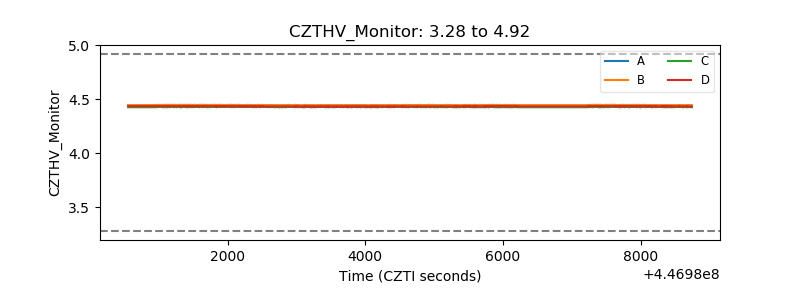 |
| D_VDD | 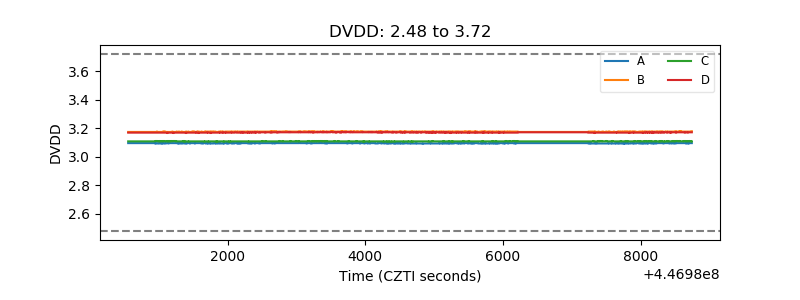 |
| Temperature 1 | 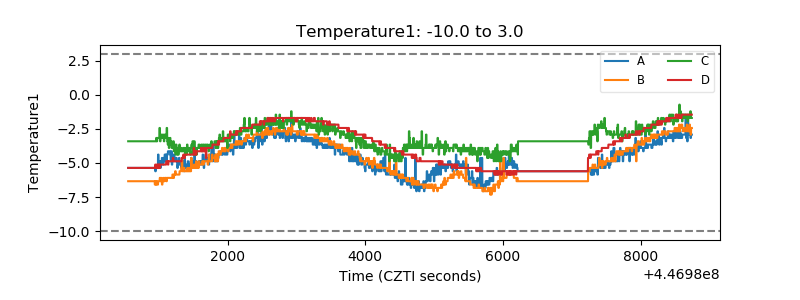 |
| Veto HV Monitor | 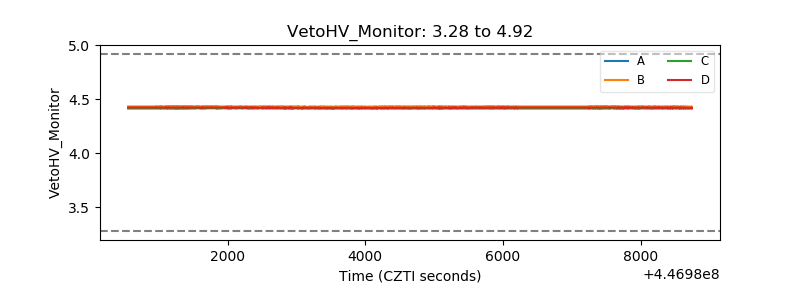 |
| Veto LLD | 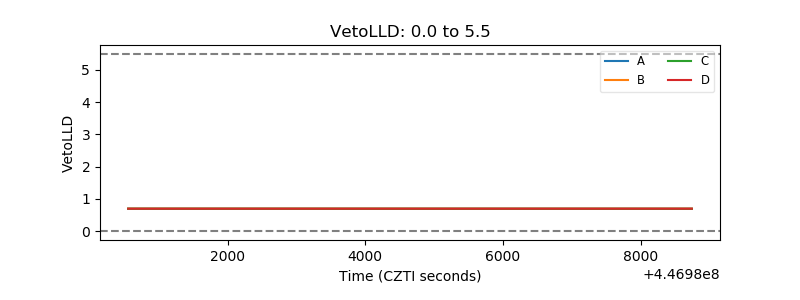 |
| Alpha Counter | 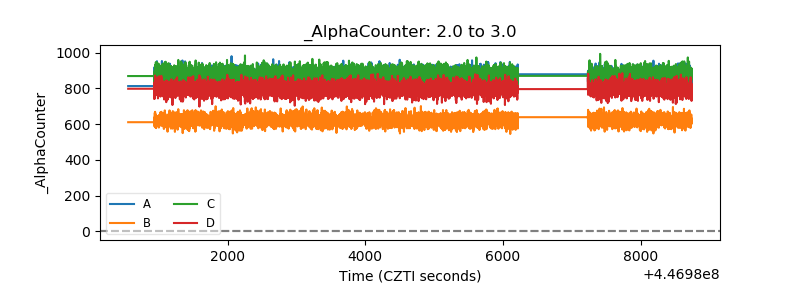 |
| _CPM_Rate | 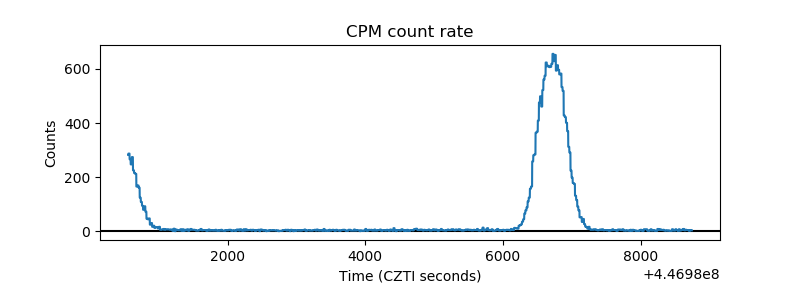 |
| CZT Counter | 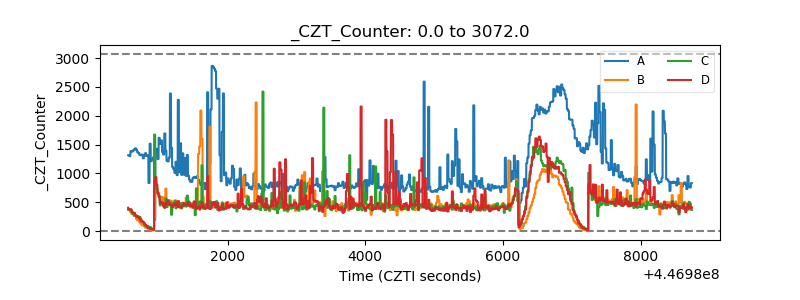 |
| +2.5 Volts monitor | 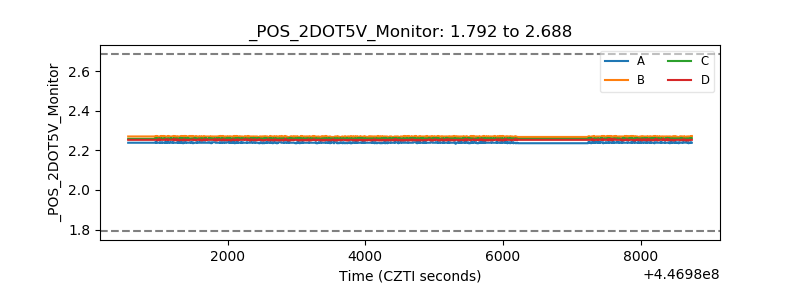 |
| +5 Volts monitor | 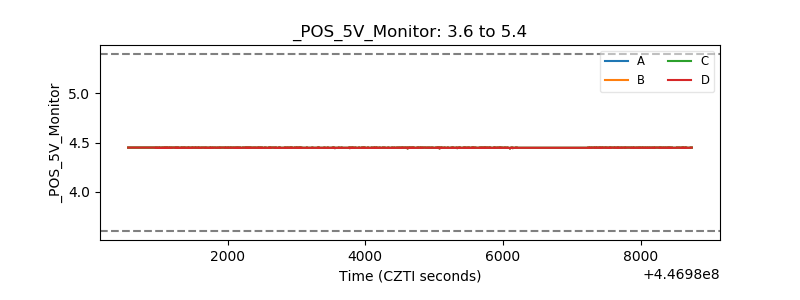 |
| _ROLL_ROT | 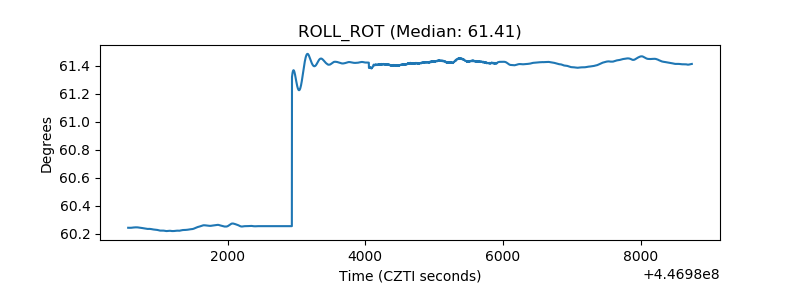 |
| _Roll_DEC | 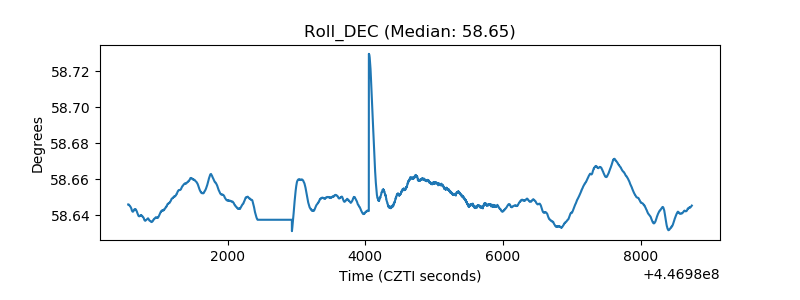 |
| _Roll_RA | 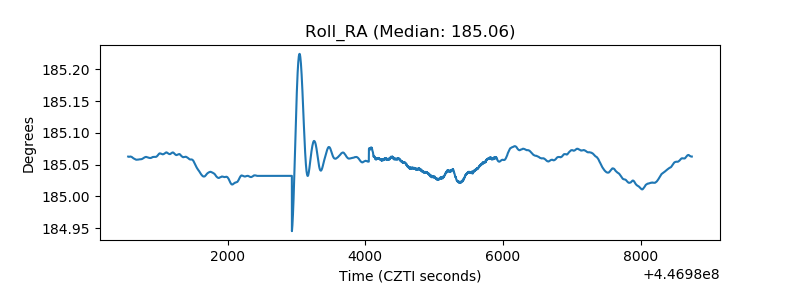 |
| Veto Counter | 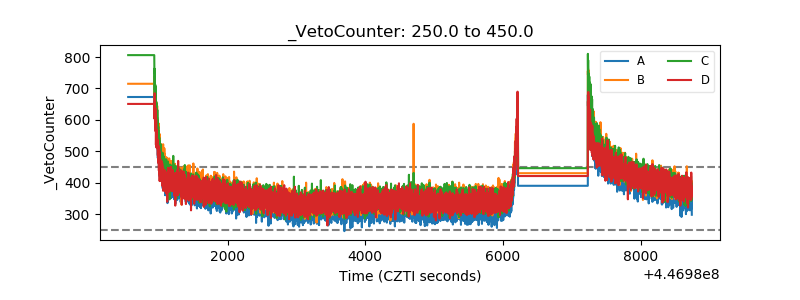 |