| Param | Original file | Final file |
|---|---|---|
| Filename | modeM0/AS1A13_093T11_9000006108_45559cztM0_level2.fits | modeM0/AS1A13_093T11_9000006108_45559cztM0_level2_quad_clean.evt |
| Size (bytes) | 458,769,600 | 114,822,720 |
| Size | 437.5 MB | 109.5 MB |
| Events in quadrant A | 6,254,821 | 757,877 |
| Events in quadrant B | 3,410,306 | 798,977 |
| Events in quadrant C | 3,070,097 | 758,670 |
| Events in quadrant D | 3,726,413 | 693,975 |
| Mode M9 | |||
|---|---|---|---|
| Quadrant | BADHDUFLAG | Total packets | Discarded packets |
| A | 0 | 14 | 0 |
| B | 0 | 14 | 0 |
| C | 0 | 14 | 0 |
| D | 0 | 15 | 0 |
| Mode M0 | |||
|---|---|---|---|
| Quadrant | BADHDUFLAG | Total packets | Discarded packets |
| A | 0 | 23220 | 2 |
| B | 0 | 14518 | 2 |
| C | 0 | 13788 | 2 |
| D | 0 | 15717 | 2 |
| Mode SS | |||
|---|---|---|---|
| Quadrant | BADHDUFLAG | Total packets | Discarded packets |
| A | 0 | 138 | 0 |
| B | 0 | 138 | 0 |
| C | 0 | 138 | 0 |
| D | 0 | 138 | 0 |
| Quadrant | Total seconds | Saturated seconds | Saturation percentage |
|---|---|---|---|
| A | 6700 | 359 | 5.358209% |
| B | 6700 | 131 | 1.955224% |
| C | 6700 | 57 | 0.850746% |
| D | 6700 | 161 | 2.402985% |
Noise dominated data is calculated using 1-second bins in cleaned event files. If a bin has >2000 counts, and if more than 50% of those come from <1% of pixels, then it is considered to be noise-dominated and hence unusable.
| Quadrant | # 1 sec bins | Bins with >0 counts | Bins with >2000 counts | High rate bins dominated by noise | Noise dominated (total time) | Noise dominated (detector-on time) | Marked lightcurve |
|---|---|---|---|---|---|---|---|
| A | 7820 | 6701 | 110 | 110 | 1.41% | 1.64% | 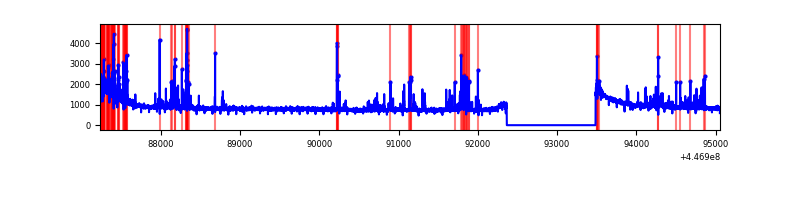 |
| B | 7820 | 6701 | 39 | 39 | 0.50% | 0.58% | 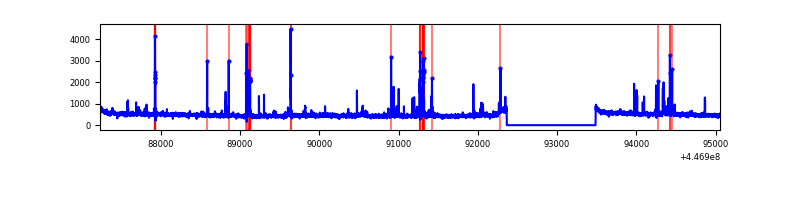 |
| C | 7820 | 6701 | 1 | 1 | 0.01% | 0.01% | 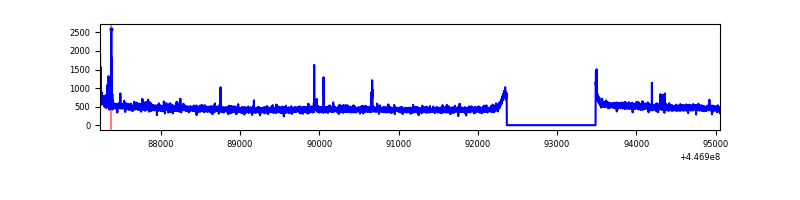 |
| D | 7820 | 6701 | 92 | 92 | 1.18% | 1.37% |  |
Top three noisy pixels from each quadrant. If the there are fewer than three noisy pixels in the level2.evt file, extra rows are filled as -1
| Pixel properties | Quadrant properties | ||||||
|---|---|---|---|---|---|---|---|
| Quadrant | DetID | PixID | Counts | Sigma | Mean | Median | Sigma |
| A | 10 | 83 | 2671004 | 16684.56 | 778 | 760 | 160.0 |
| A | 10 | 248 | 300975 | 1875.84 | 778 | 760 | 160.0 |
| A | 13 | 248 | 270393 | 1684.76 | 778 | 760 | 160.0 |
| B | 5 | 172 | 232471 | 1524.62 | 779 | 755 | 152.0 |
| B | 0 | 183 | 45029 | 291.31 | 779 | 755 | 152.0 |
| B | 12 | 111 | 19163 | 121.12 | 779 | 755 | 152.0 |
| C | 12 | 2 | 32994 | 179.17 | 771 | 773 | 179.8 |
| C | 14 | 254 | 19486 | 104.06 | 771 | 773 | 179.8 |
| C | 9 | 237 | 9181 | 46.75 | 771 | 773 | 179.8 |
| D | 12 | 233 | 254754 | 1323.86 | 770 | 745 | 191.9 |
| D | 5 | 171 | 215028 | 1116.81 | 770 | 745 | 191.9 |
| D | 13 | 249 | 91198 | 471.43 | 770 | 745 | 191.9 |
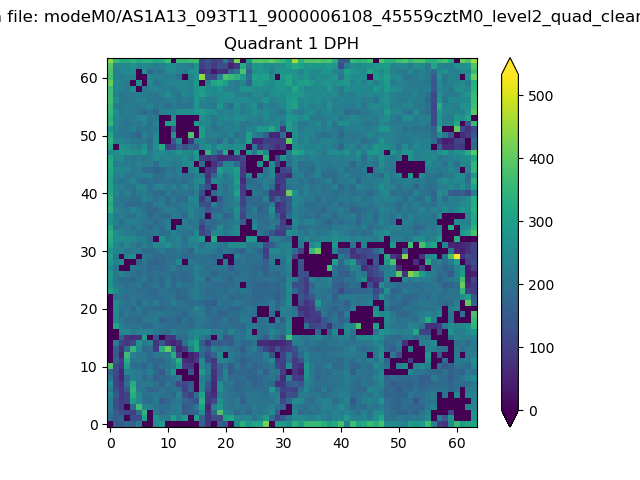
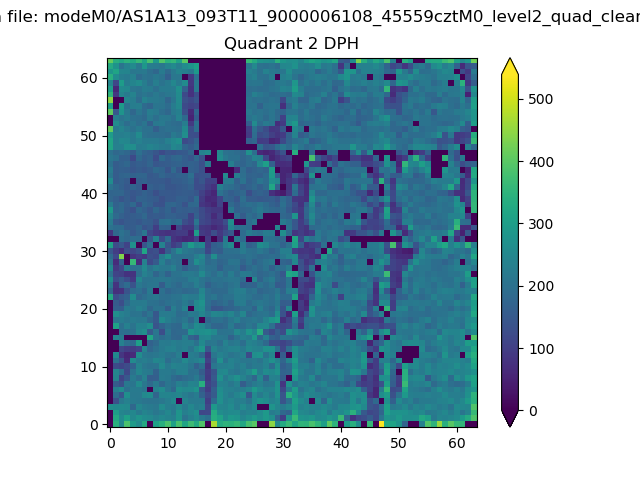
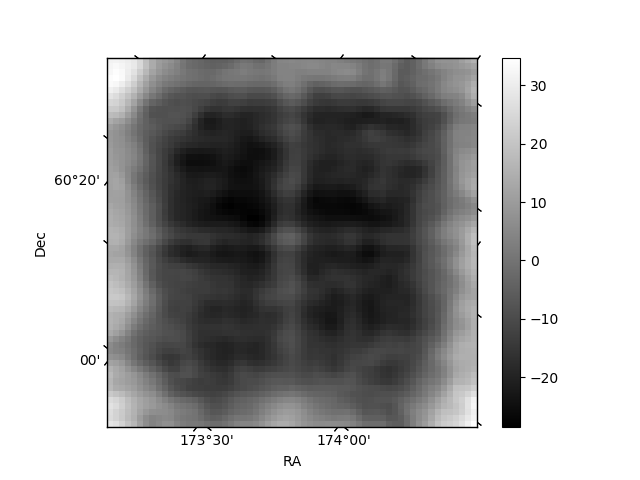
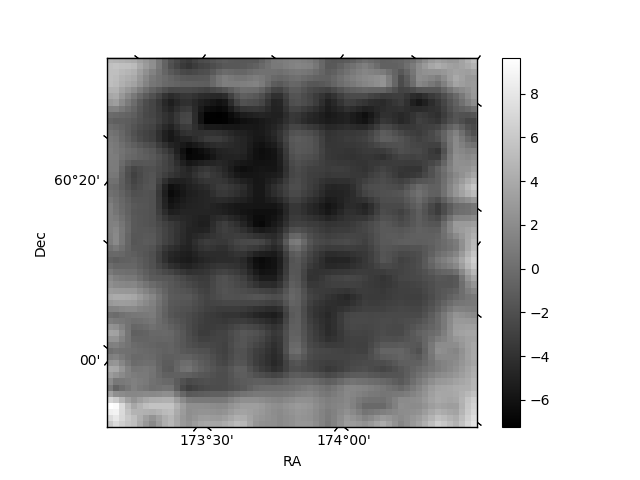
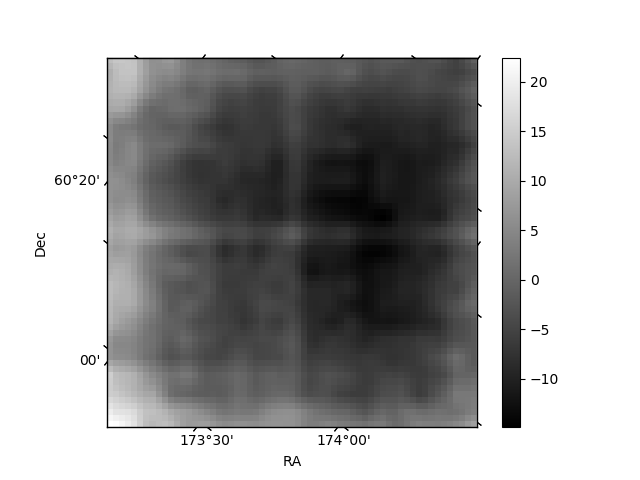
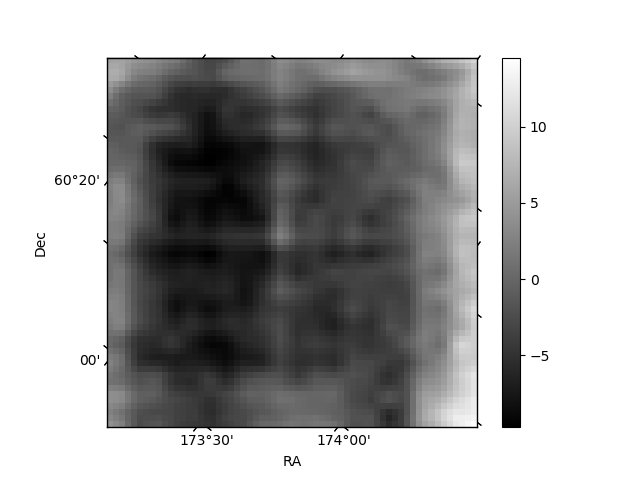
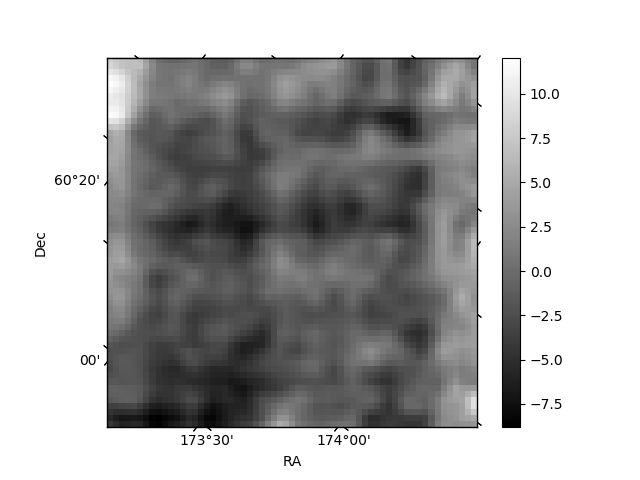
Histogram calculated using DETX and DETY for each event in the final _common_clean file
| Quadrant A | 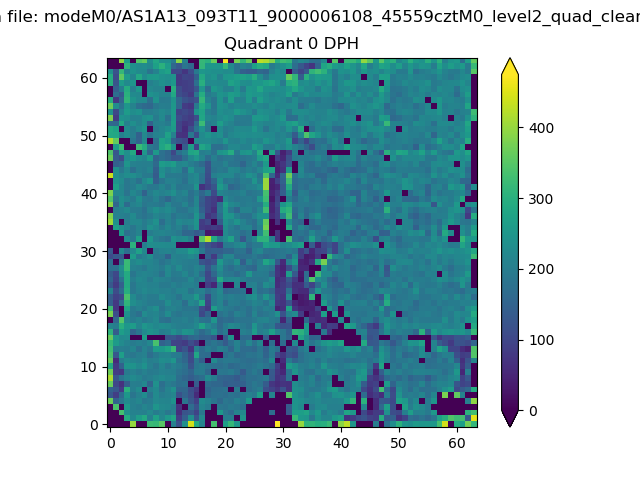 |
 |
Quadrant B |
|---|---|---|---|
| Quadrant D | 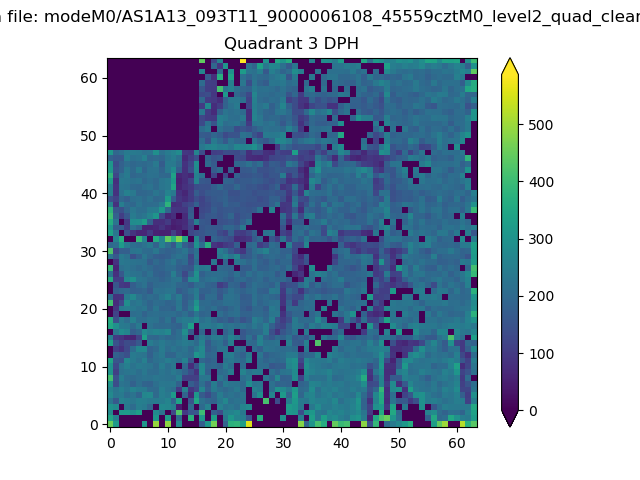 |
 |
Quadrant C |
| Plot type | Count rate plots | Images |
|---|---|---|
| Comparison with Poisson distribution Blue bars denote a histogram of data divided into 1 sec bins. Red curve is a Poisson curve with rate = median count rate of data. |
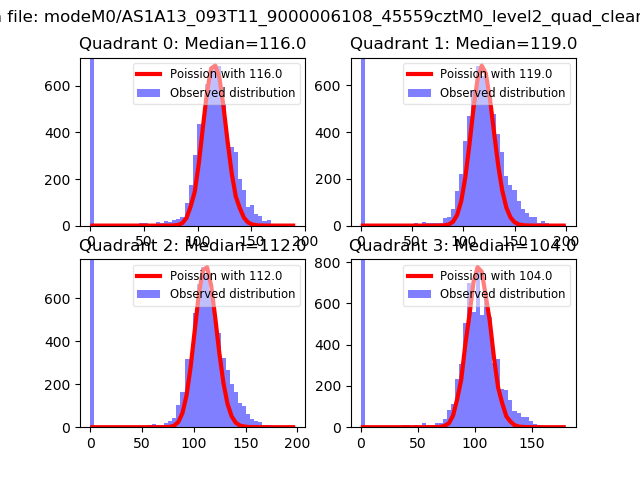 |
 |
| Quadrant-wise count rates Data is divided into 100 sec bins |
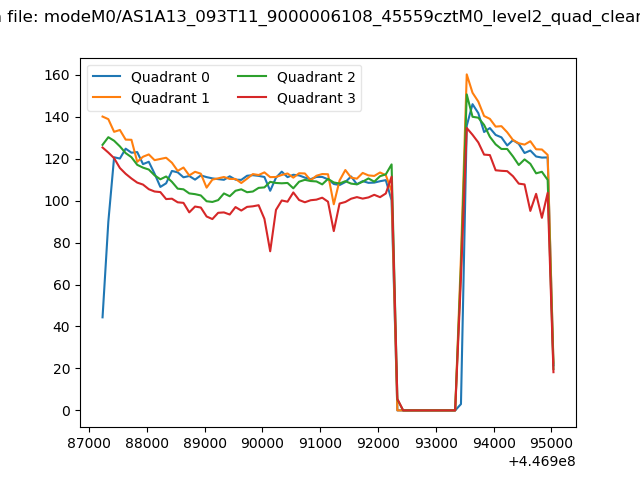 |
|
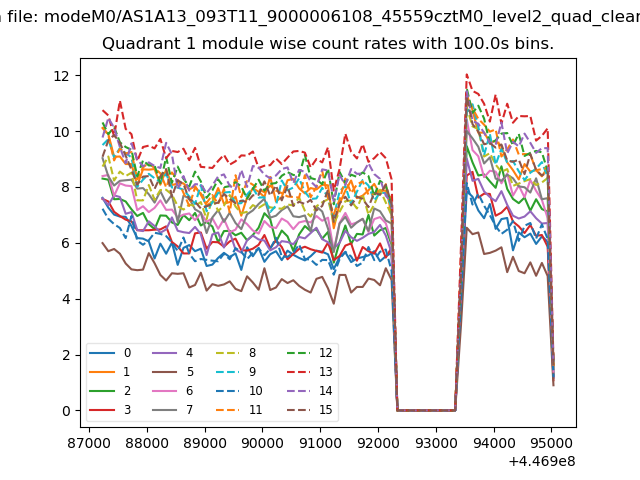
| Module-wise count rates for Quadrant A Data is divided into 100 sec bins |
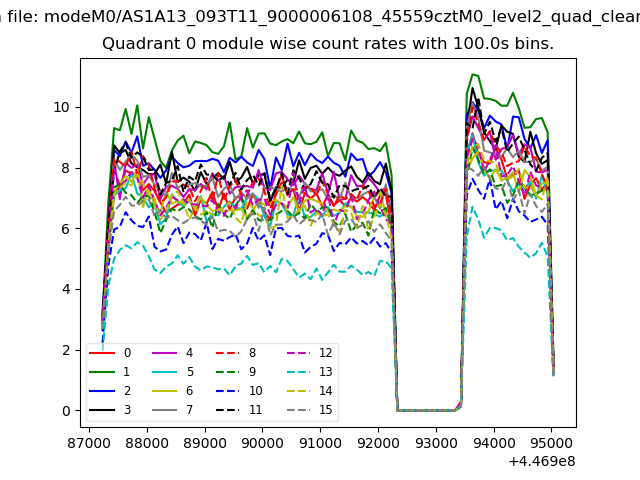 |
 |
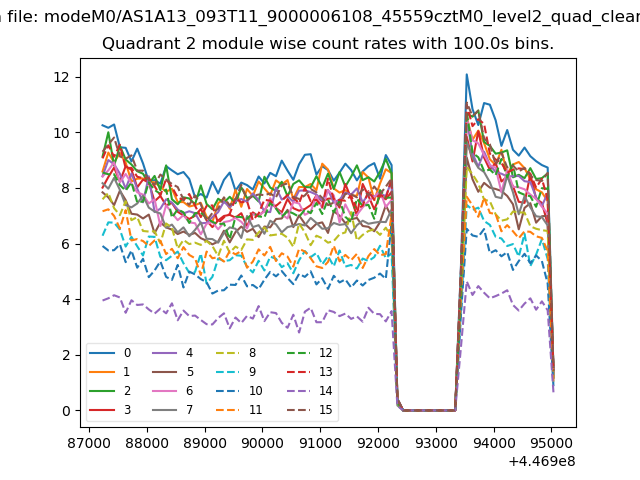
| Module-wise count rates for Quadrant B Data is divided into 100 sec bins |
 |
 |
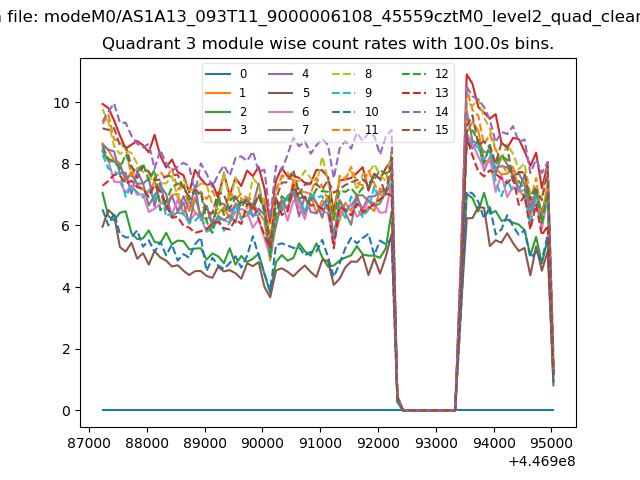
| Module-wise count rates for Quadrant C Data is divided into 100 sec bins |
 |
 |
| Module-wise count rates for Quadrant D Data is divided into 100 sec bins |
 |
 |
| Parameter | Plot |
|---|---|
| CZT HV Monitor | 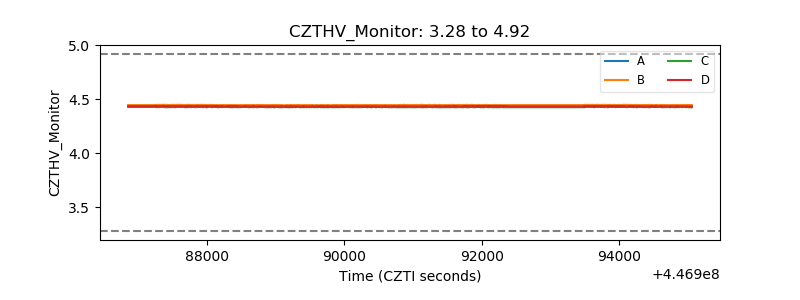 |
| D_VDD | 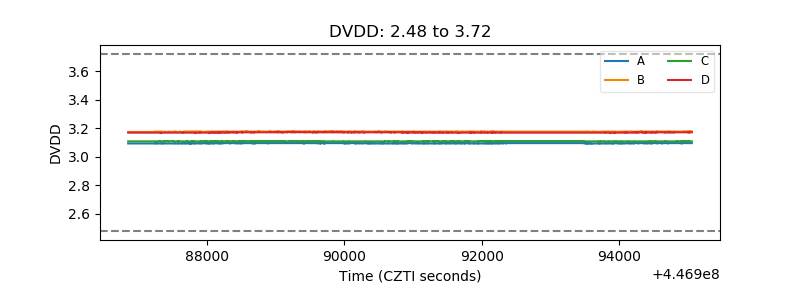 |
| Temperature 1 | 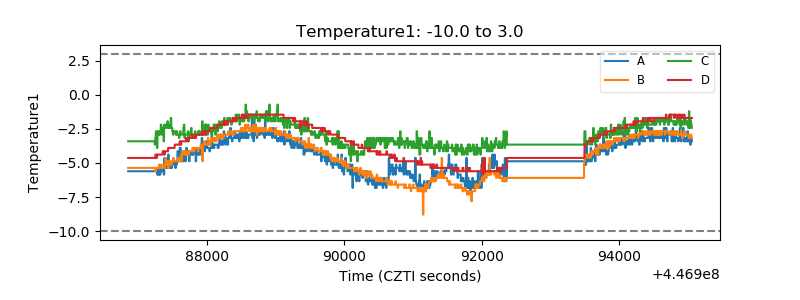 |
| Veto HV Monitor | 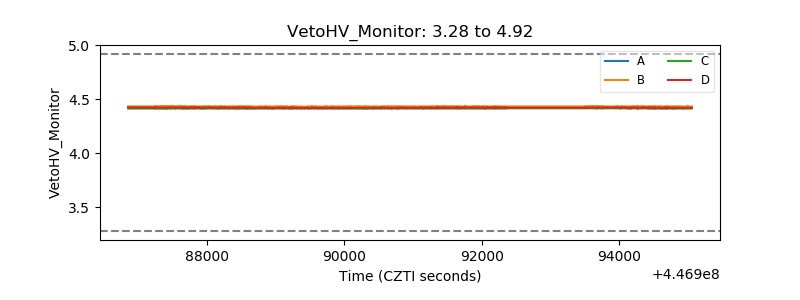 |
| Veto LLD | 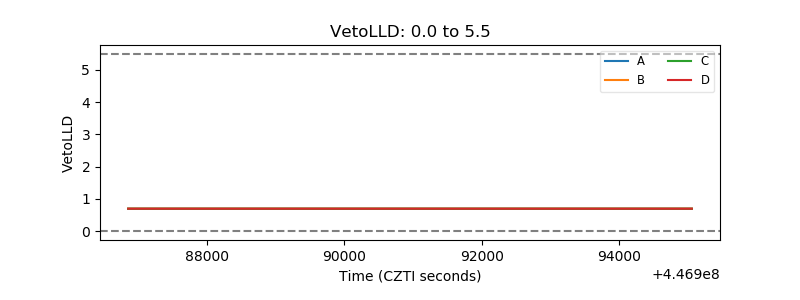 |
| Alpha Counter | 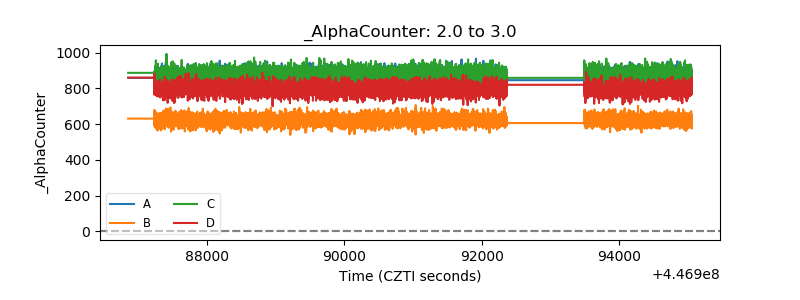 |
| _CPM_Rate | 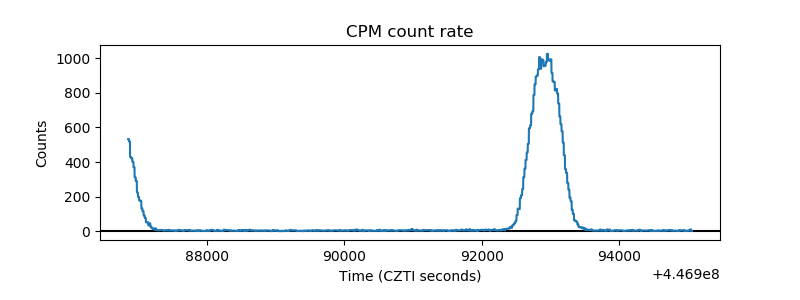 |
| CZT Counter | 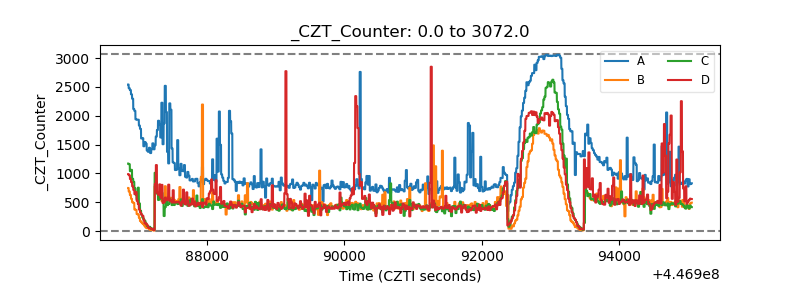 |
| +2.5 Volts monitor | 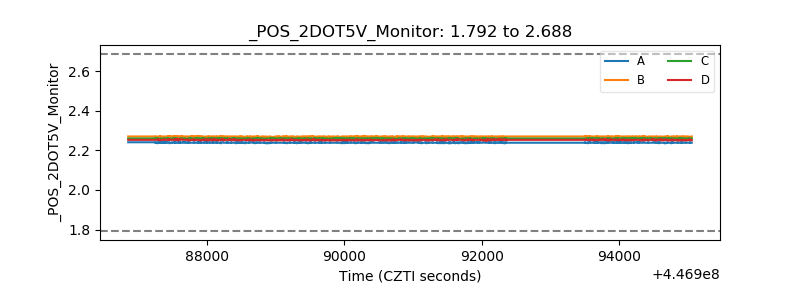 |
| +5 Volts monitor | 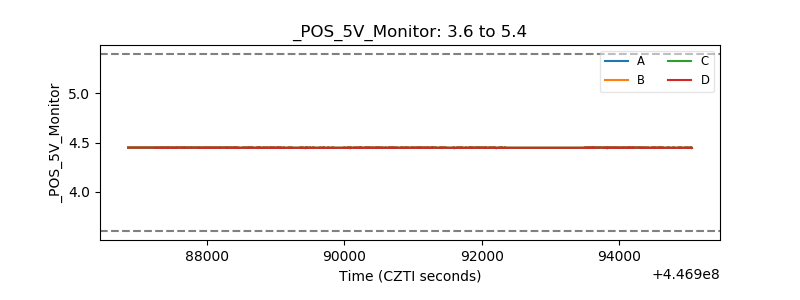 |
| _ROLL_ROT | 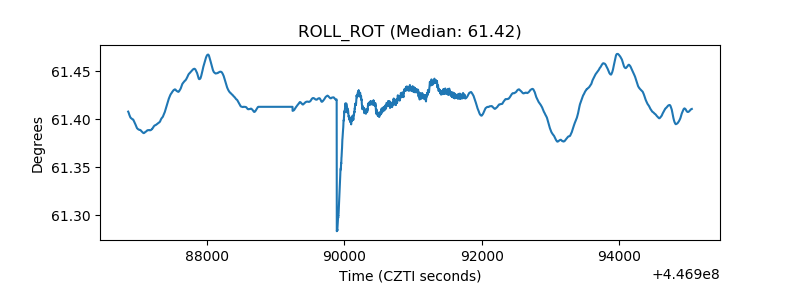 |
| _Roll_DEC | 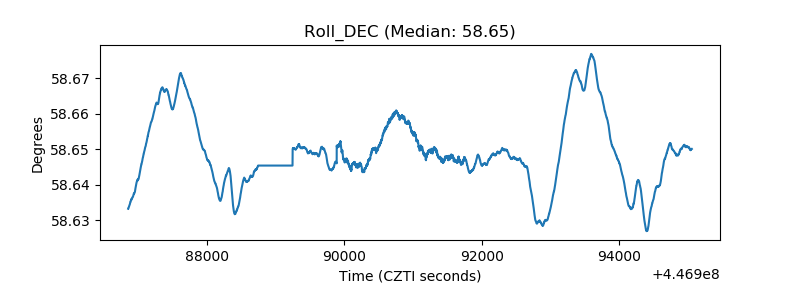 |
| _Roll_RA | 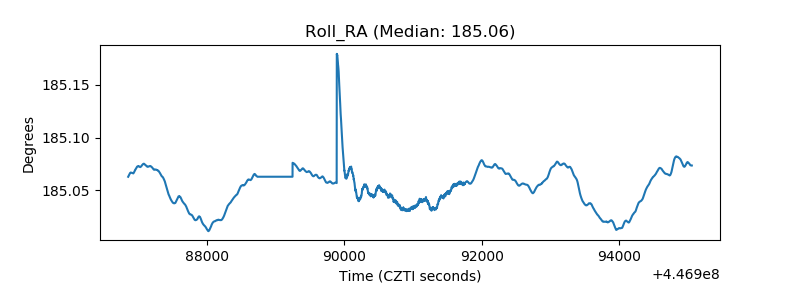 |
| Veto Counter | 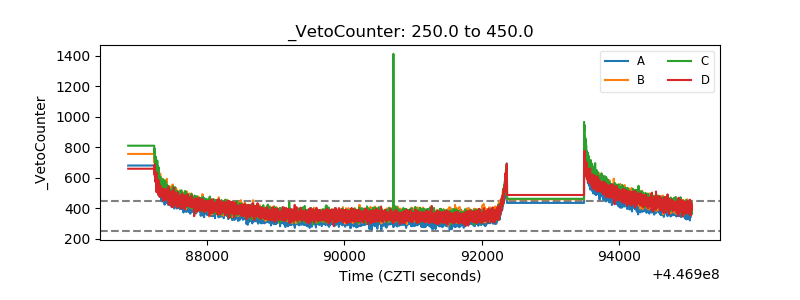 |