| Param | Original file | Final file |
|---|---|---|
| Filename | modeM0/AS1A13_093T11_9000006108_45560cztM0_level2.fits | modeM0/AS1A13_093T11_9000006108_45560cztM0_level2_quad_clean.evt |
| Size (bytes) | 440,700,480 | 115,208,640 |
| Size | 420.3 MB | 109.9 MB |
| Events in quadrant A | 5,916,419 | 768,311 |
| Events in quadrant B | 3,265,403 | 803,139 |
| Events in quadrant C | 3,041,938 | 765,389 |
| Events in quadrant D | 3,586,431 | 700,262 |
| Mode M9 | |||
|---|---|---|---|
| Quadrant | BADHDUFLAG | Total packets | Discarded packets |
| A | 0 | 14 | 0 |
| B | 0 | 14 | 0 |
| C | 0 | 14 | 0 |
| D | 0 | 15 | 0 |
| Mode M0 | |||
|---|---|---|---|
| Quadrant | BADHDUFLAG | Total packets | Discarded packets |
| A | 0 | 22053 | 2 |
| B | 0 | 14033 | 2 |
| C | 0 | 13401 | 2 |
| D | 0 | 15076 | 2 |
| Mode SS | |||
|---|---|---|---|
| Quadrant | BADHDUFLAG | Total packets | Discarded packets |
| A | 0 | 132 | 0 |
| B | 0 | 132 | 0 |
| C | 0 | 132 | 0 |
| D | 0 | 132 | 0 |
| Quadrant | Total seconds | Saturated seconds | Saturation percentage |
|---|---|---|---|
| A | 6474 | 325 | 5.020080% |
| B | 6474 | 156 | 2.409639% |
| C | 6474 | 104 | 1.606426% |
| D | 6474 | 169 | 2.610442% |
Noise dominated data is calculated using 1-second bins in cleaned event files. If a bin has >2000 counts, and if more than 50% of those come from <1% of pixels, then it is considered to be noise-dominated and hence unusable.
| Quadrant | # 1 sec bins | Bins with >0 counts | Bins with >2000 counts | High rate bins dominated by noise | Noise dominated (total time) | Noise dominated (detector-on time) | Marked lightcurve |
|---|---|---|---|---|---|---|---|
| A | 7619 | 6474 | 30 | 30 | 0.39% | 0.46% | 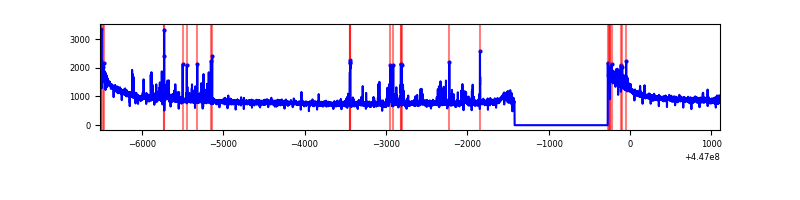 |
| B | 7619 | 6474 | 13 | 13 | 0.17% | 0.20% | 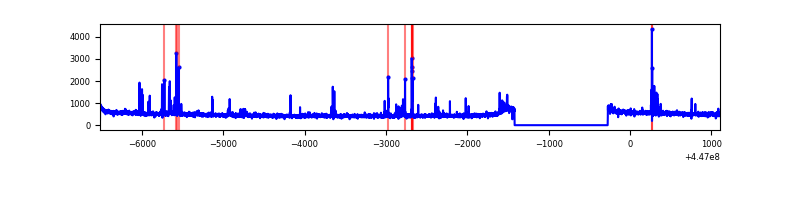 |
| C | 7619 | 6475 | 0 | 0 | 0.00% | 0.00% | 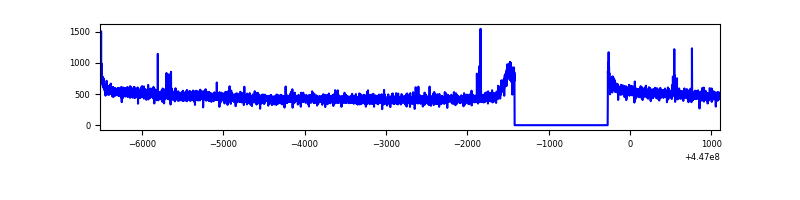 |
| D | 7619 | 6475 | 55 | 55 | 0.72% | 0.85% | 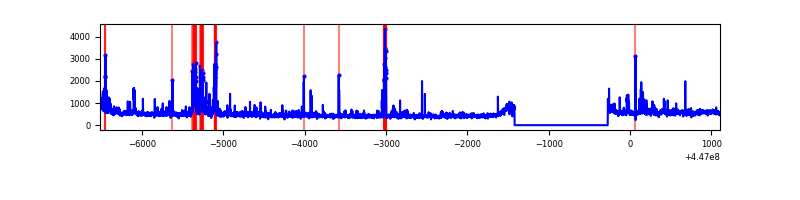 |
Top three noisy pixels from each quadrant. If the there are fewer than three noisy pixels in the level2.evt file, extra rows are filled as -1
| Pixel properties | Quadrant properties | ||||||
|---|---|---|---|---|---|---|---|
| Quadrant | DetID | PixID | Counts | Sigma | Mean | Median | Sigma |
| A | 10 | 83 | 2656865 | 16614.7 | 779 | 763 | 159.9 |
| A | 13 | 248 | 167908 | 1045.54 | 779 | 763 | 159.9 |
| A | 10 | 248 | 82957 | 514.15 | 779 | 763 | 159.9 |
| B | 5 | 172 | 128693 | 846.6 | 777 | 753 | 151.1 |
| B | 0 | 189 | 21396 | 136.6 | 777 | 753 | 151.1 |
| B | 0 | 183 | 20485 | 130.57 | 777 | 753 | 151.1 |
| C | 14 | 254 | 13067 | 68.33 | 774 | 779 | 179.8 |
| C | 12 | 2 | 12249 | 63.78 | 774 | 779 | 179.8 |
| C | 13 | 61 | 5196 | 24.56 | 774 | 779 | 179.8 |
| D | 12 | 233 | 238950 | 1243.31 | 772 | 750 | 191.6 |
| D | 11 | 224 | 84507 | 437.18 | 772 | 750 | 191.6 |
| D | 5 | 171 | 73832 | 381.46 | 772 | 750 | 191.6 |
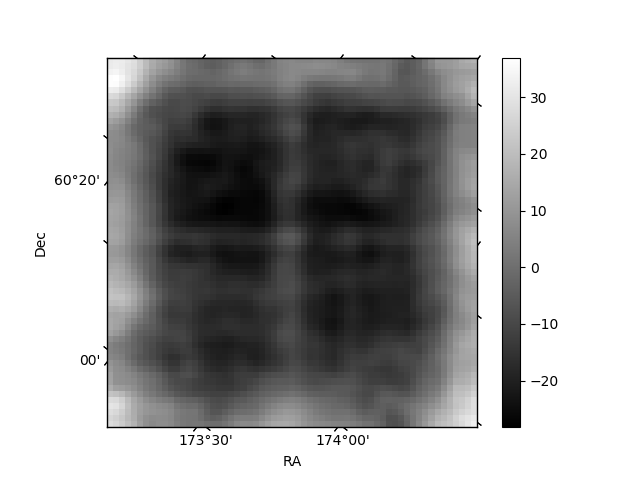
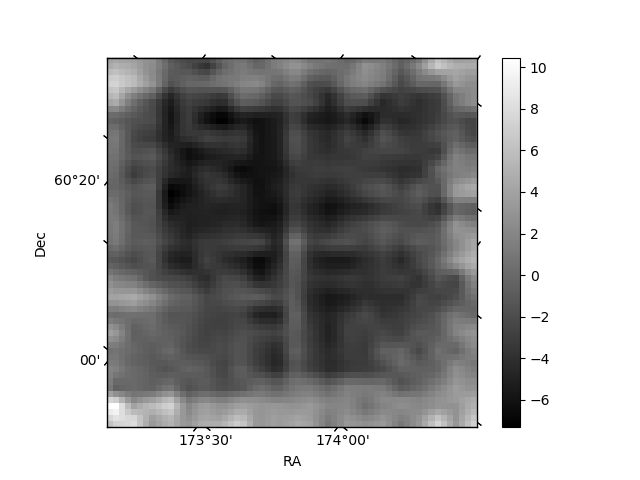
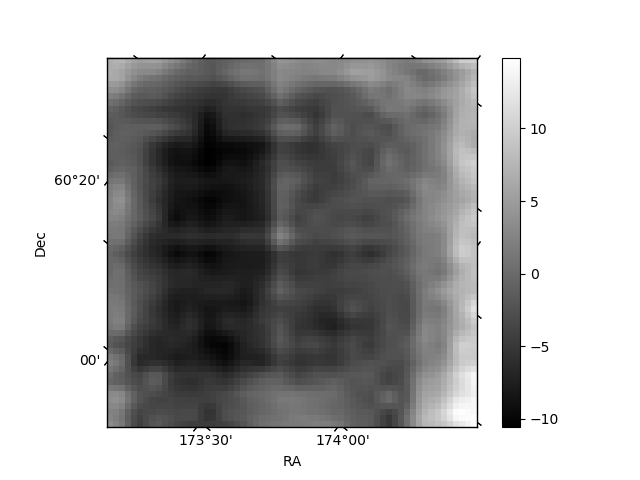
Histogram calculated using DETX and DETY for each event in the final _common_clean file
| Quadrant A | 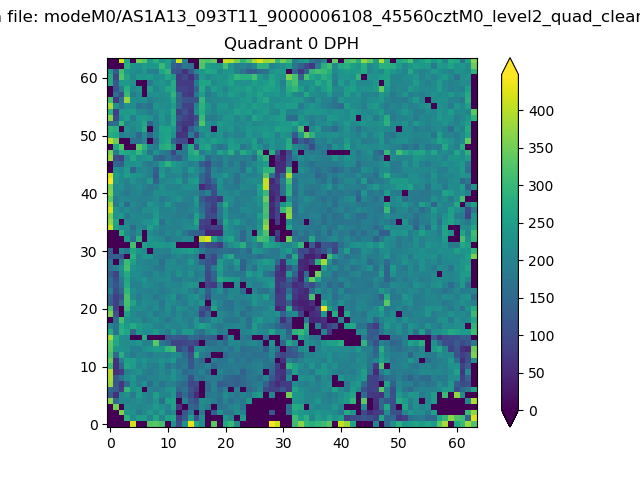 |
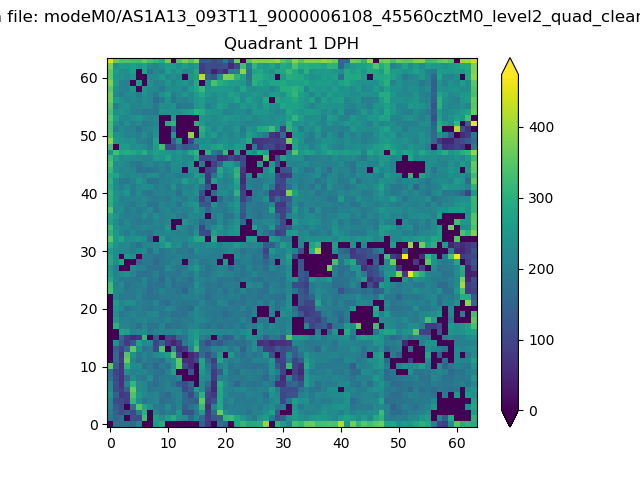 |
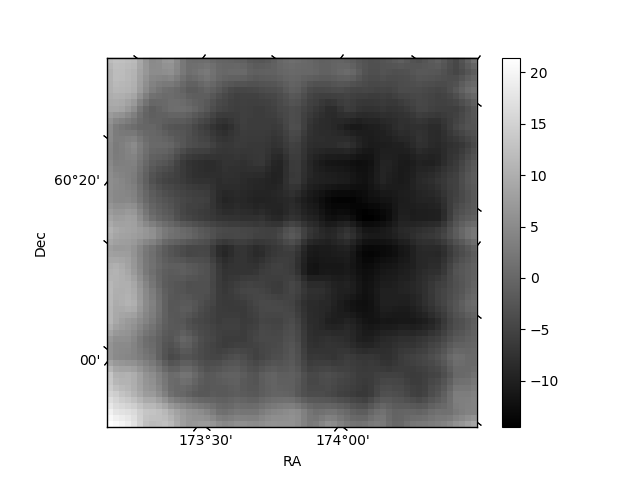
Quadrant B |
|---|---|---|---|
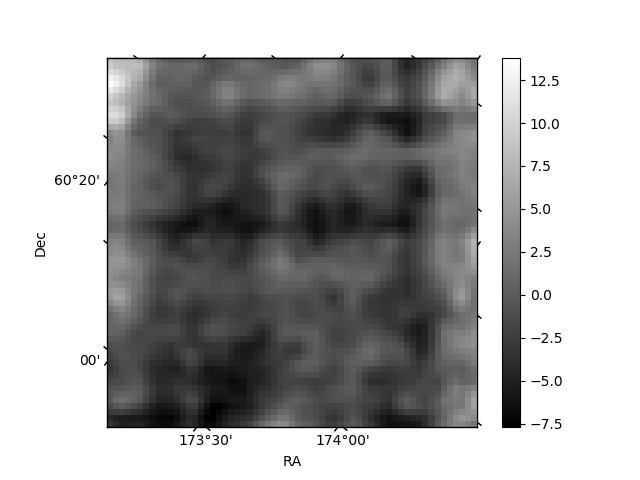
| Quadrant D | 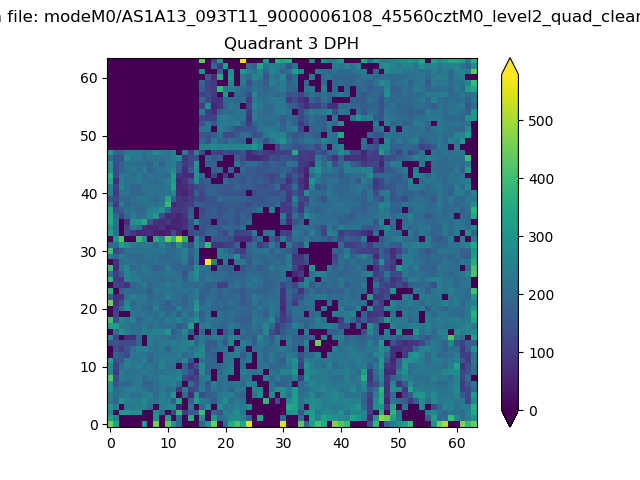 |
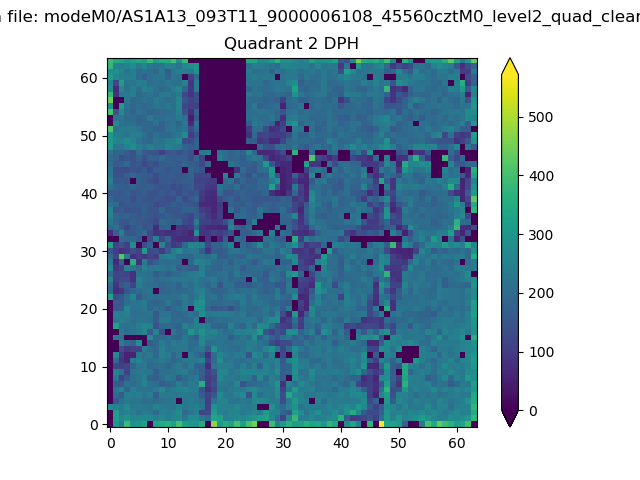 |
Quadrant C |
| Plot type | Count rate plots | Images |
|---|---|---|
| Comparison with Poisson distribution Blue bars denote a histogram of data divided into 1 sec bins. Red curve is a Poisson curve with rate = median count rate of data. |
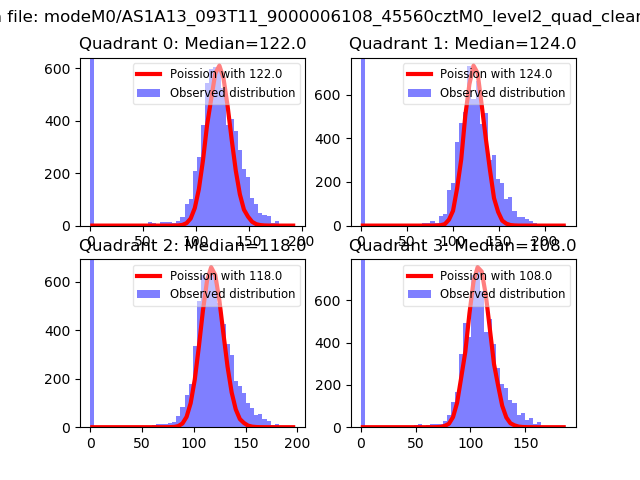 |
 |
| Quadrant-wise count rates Data is divided into 100 sec bins |
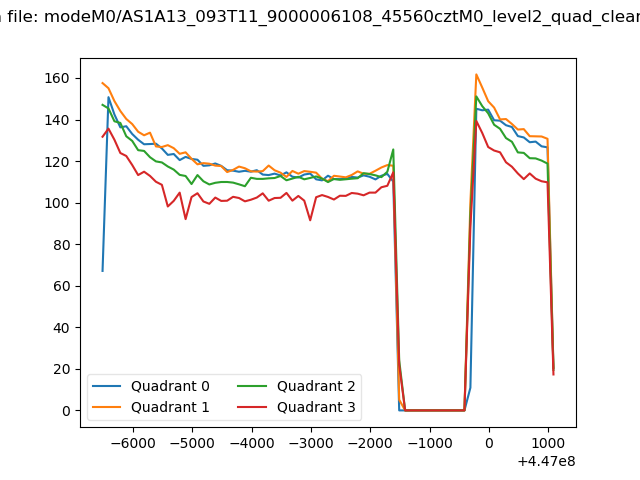 |
|
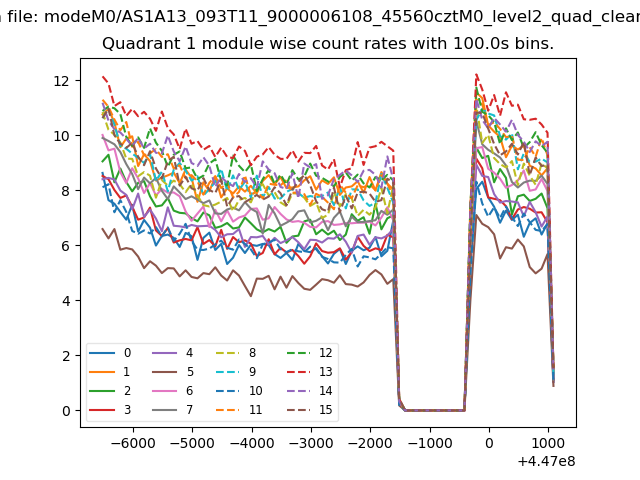
| Module-wise count rates for Quadrant A Data is divided into 100 sec bins |
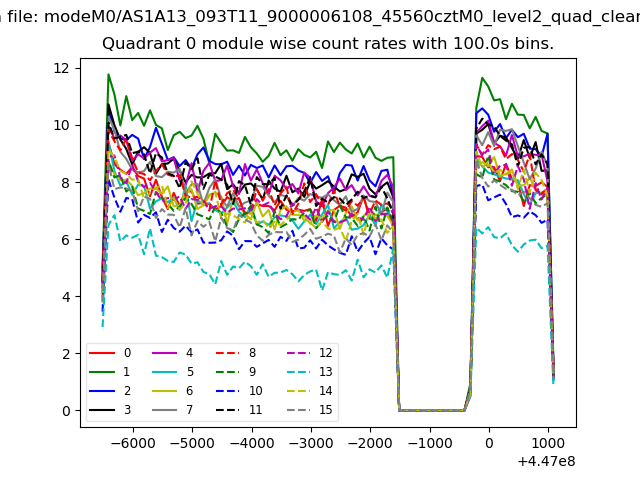 |
 |
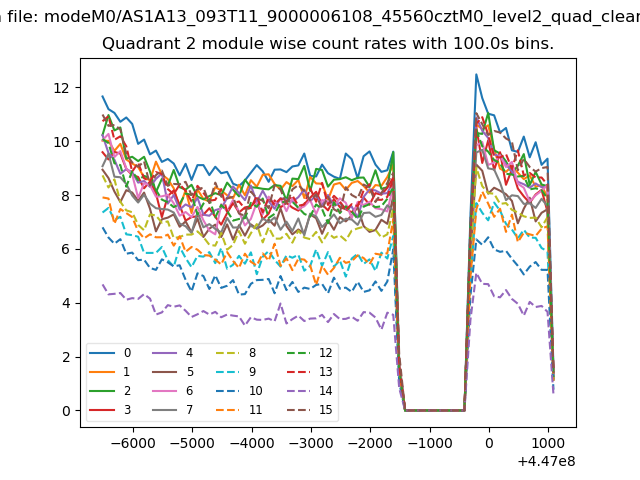
| Module-wise count rates for Quadrant B Data is divided into 100 sec bins |
 |
 |
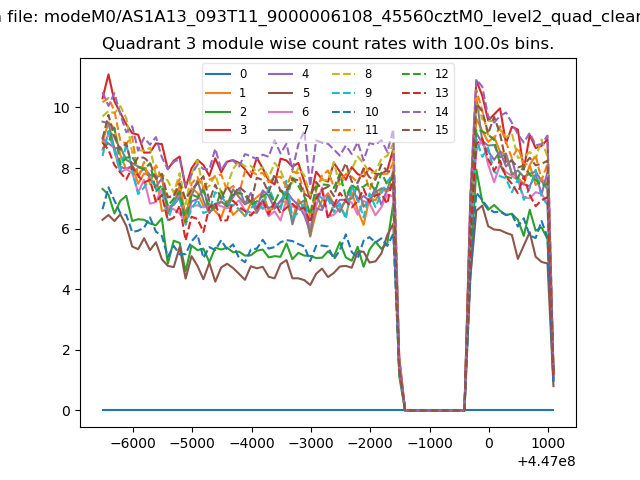
| Module-wise count rates for Quadrant C Data is divided into 100 sec bins |
 |
 |
| Module-wise count rates for Quadrant D Data is divided into 100 sec bins |
 |
 |
| Parameter | Plot |
|---|---|
| CZT HV Monitor |  |
| D_VDD | 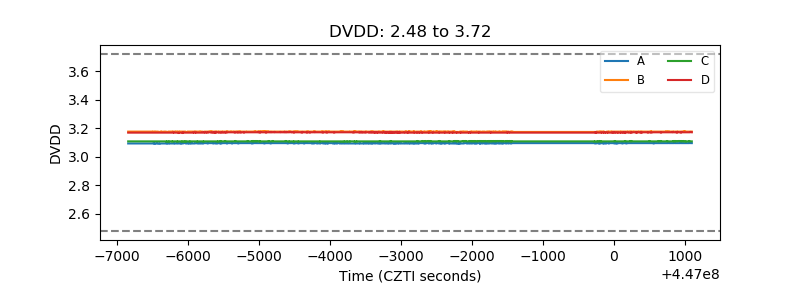 |
| Temperature 1 | 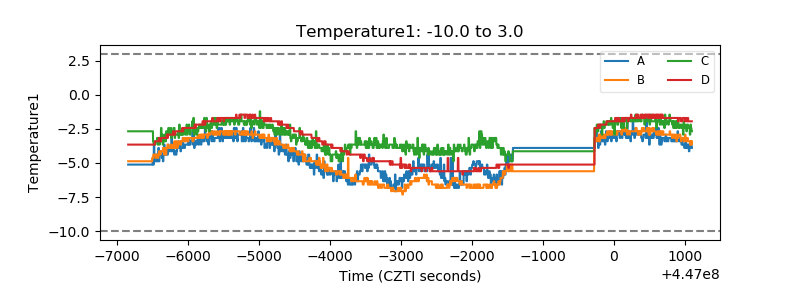 |
| Veto HV Monitor | 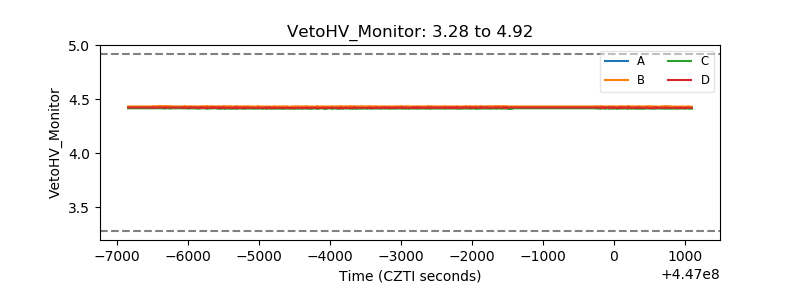 |
| Veto LLD | 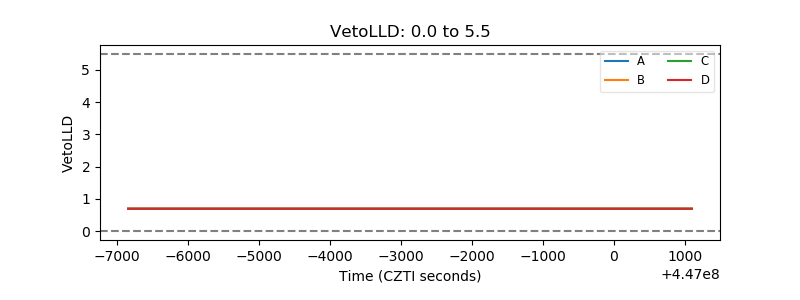 |
| Alpha Counter | 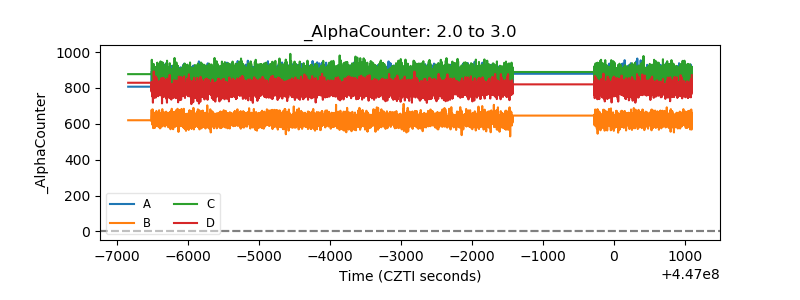 |
| _CPM_Rate | 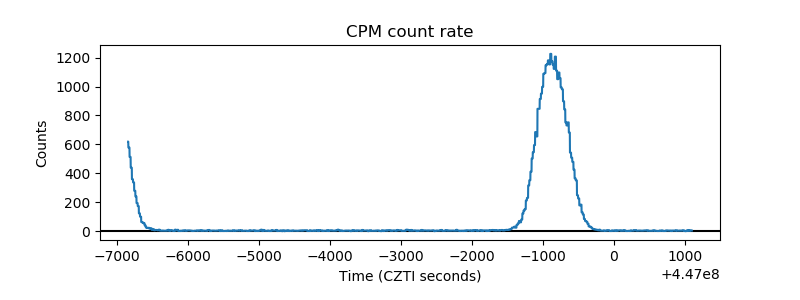 |
| CZT Counter | 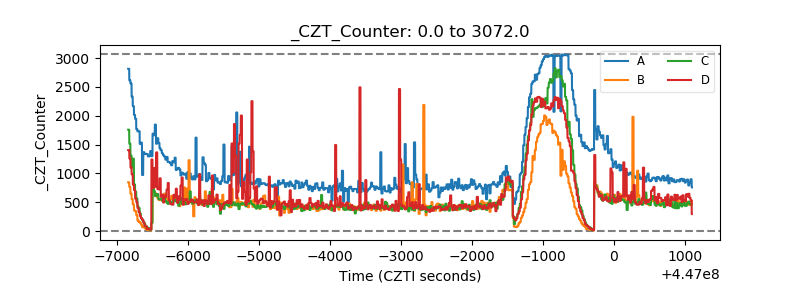 |
| +2.5 Volts monitor | 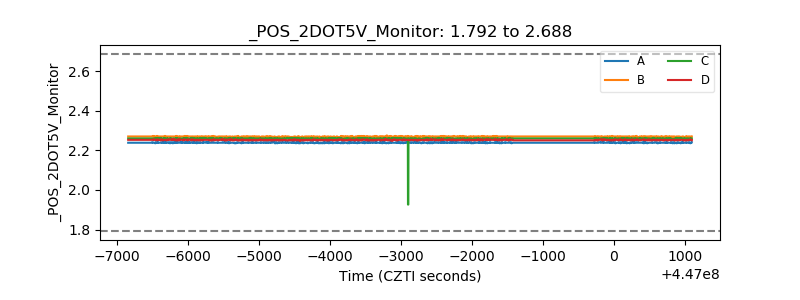 |
| +5 Volts monitor | 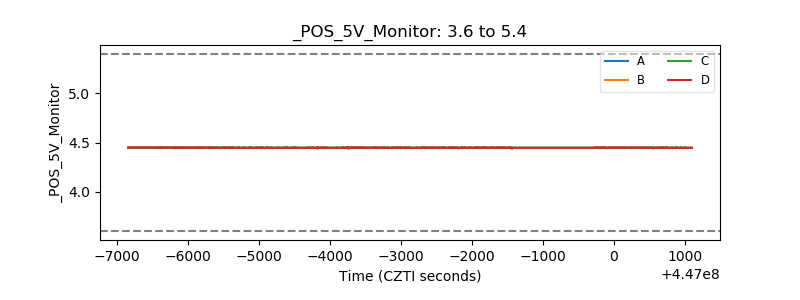 |
| _ROLL_ROT | 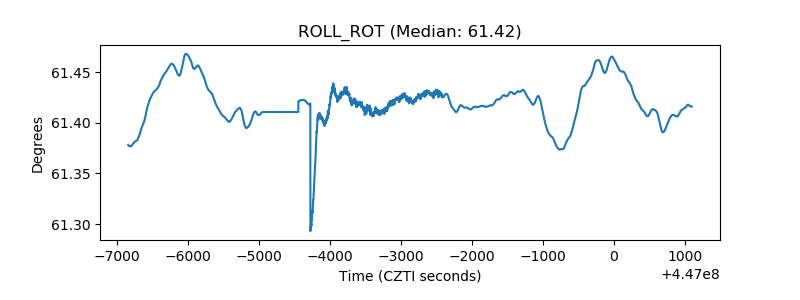 |
| _Roll_DEC | 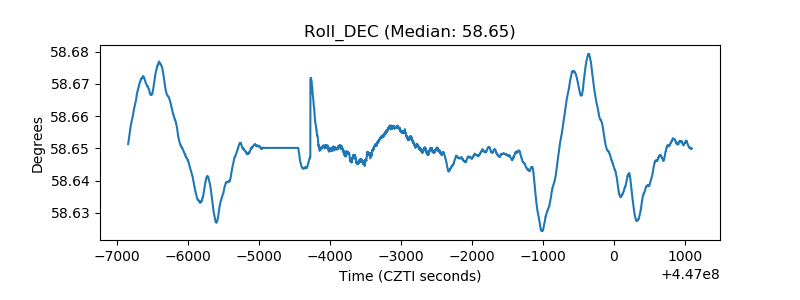 |
| _Roll_RA | 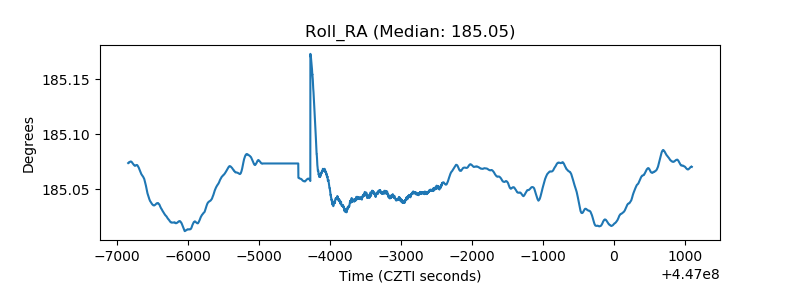 |
| Veto Counter | 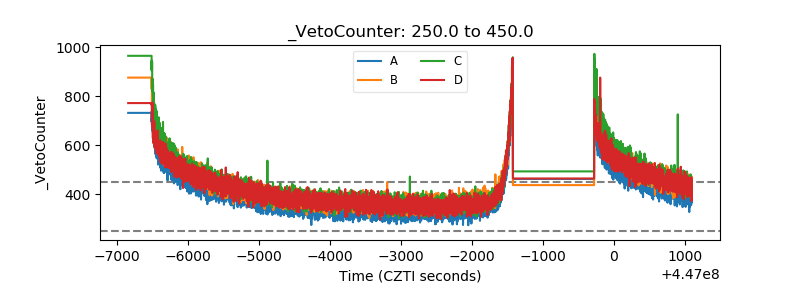 |