| Param | Original file | Final file |
|---|---|---|
| Filename | modeM0/AS1A13_071T04_9000006110_45563cztM0_level2.fits | modeM0/AS1A13_071T04_9000006110_45563cztM0_level2_quad_clean.evt |
| Size (bytes) | 482,803,200 | 111,297,600 |
| Size | 460.4 MB | 106.1 MB |
| Events in quadrant A | 5,900,074 | 741,688 |
| Events in quadrant B | 3,569,958 | 760,166 |
| Events in quadrant C | 3,206,542 | 738,292 |
| Events in quadrant D | 4,679,213 | 665,994 |
| Mode M9 | |||
|---|---|---|---|
| Quadrant | BADHDUFLAG | Total packets | Discarded packets |
| A | 0 | 10 | 0 |
| B | 0 | 10 | 0 |
| C | 0 | 10 | 0 |
| D | 0 | 10 | 0 |
| Mode M0 | |||
|---|---|---|---|
| Quadrant | BADHDUFLAG | Total packets | Discarded packets |
| A | 0 | 22137 | 2 |
| B | 0 | 15118 | 2 |
| C | 0 | 14278 | 2 |
| D | 0 | 18484 | 2 |
| Mode SS | |||
|---|---|---|---|
| Quadrant | BADHDUFLAG | Total packets | Discarded packets |
| A | 0 | 136 | 0 |
| B | 0 | 136 | 0 |
| C | 0 | 136 | 0 |
| D | 0 | 136 | 0 |
| Quadrant | Total seconds | Saturated seconds | Saturation percentage |
|---|---|---|---|
| A | 6649 | 275 | 4.135960% |
| B | 6649 | 234 | 3.519326% |
| C | 6650 | 53 | 0.796992% |
| D | 6649 | 231 | 3.474207% |
Noise dominated data is calculated using 1-second bins in cleaned event files. If a bin has >2000 counts, and if more than 50% of those come from <1% of pixels, then it is considered to be noise-dominated and hence unusable.
| Quadrant | # 1 sec bins | Bins with >0 counts | Bins with >2000 counts | High rate bins dominated by noise | Noise dominated (total time) | Noise dominated (detector-on time) | Marked lightcurve |
|---|---|---|---|---|---|---|---|
| A | 7664 | 6650 | 28 | 28 | 0.37% | 0.42% | 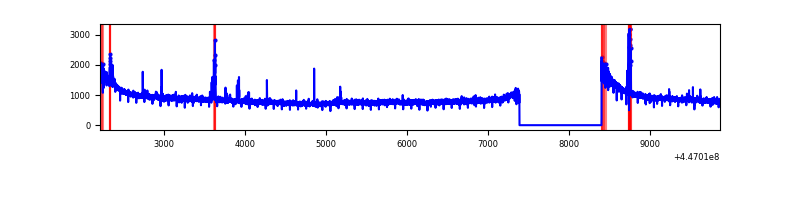 |
| B | 7664 | 6650 | 99 | 99 | 1.29% | 1.49% | 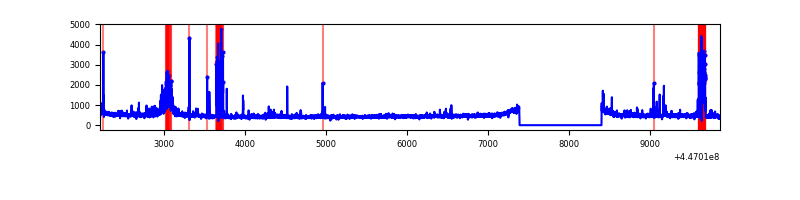 |
| C | 7665 | 6651 | 18 | 18 | 0.23% | 0.27% | 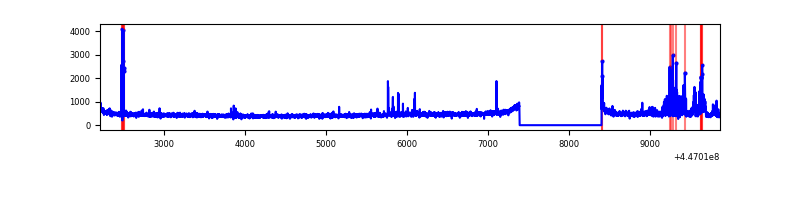 |
| D | 7664 | 6650 | 152 | 152 | 1.98% | 2.29% | 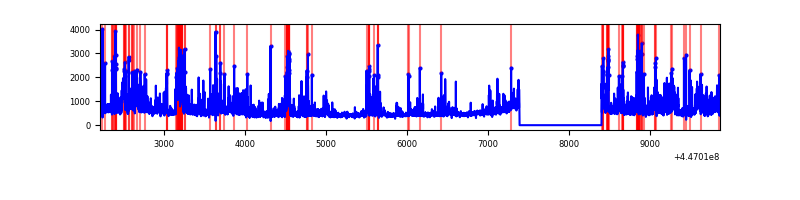 |
Top three noisy pixels from each quadrant. If the there are fewer than three noisy pixels in the level2.evt file, extra rows are filled as -1
| Pixel properties | Quadrant properties | ||||||
|---|---|---|---|---|---|---|---|
| Quadrant | DetID | PixID | Counts | Sigma | Mean | Median | Sigma |
| A | 10 | 83 | 2857869 | 18284.93 | 758 | 743 | 156.3 |
| A | 10 | 248 | 57633 | 364.08 | 758 | 743 | 156.3 |
| A | 13 | 248 | 46682 | 294.0 | 758 | 743 | 156.3 |
| B | 5 | 172 | 269686 | 1859.16 | 750 | 729 | 144.7 |
| B | 12 | 18 | 185376 | 1276.37 | 750 | 729 | 144.7 |
| B | 4 | 171 | 40777 | 276.83 | 750 | 729 | 144.7 |
| C | 12 | 2 | 296872 | 1721.47 | 739 | 743 | 172.0 |
| C | 0 | 207 | 20970 | 117.58 | 739 | 743 | 172.0 |
| C | 13 | 61 | 4898 | 24.15 | 739 | 743 | 172.0 |
| D | 12 | 233 | 426781 | 2303.11 | 735 | 710 | 185.0 |
| D | 1 | 52 | 352548 | 1901.85 | 735 | 710 | 185.0 |
| D | 5 | 33 | 336512 | 1815.16 | 735 | 710 | 185.0 |
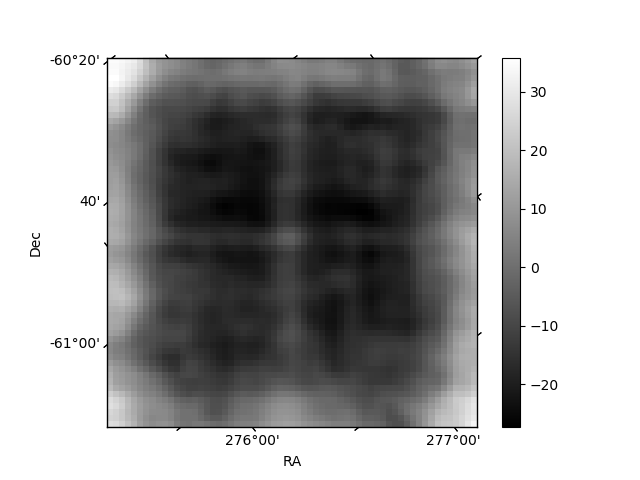
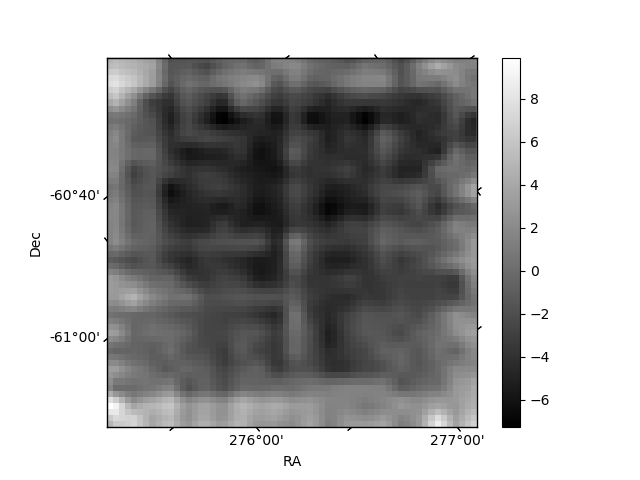
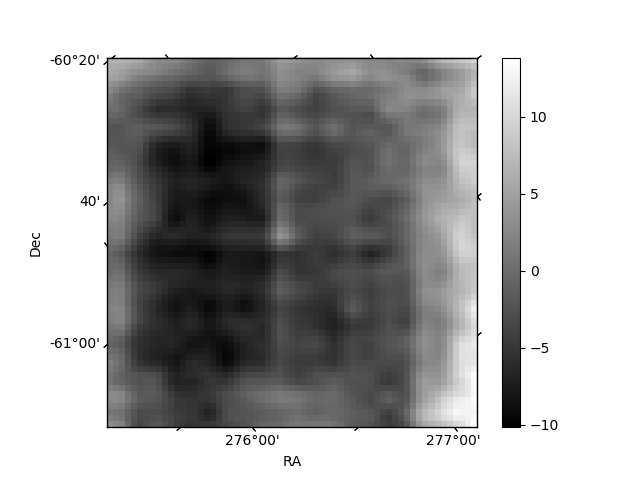
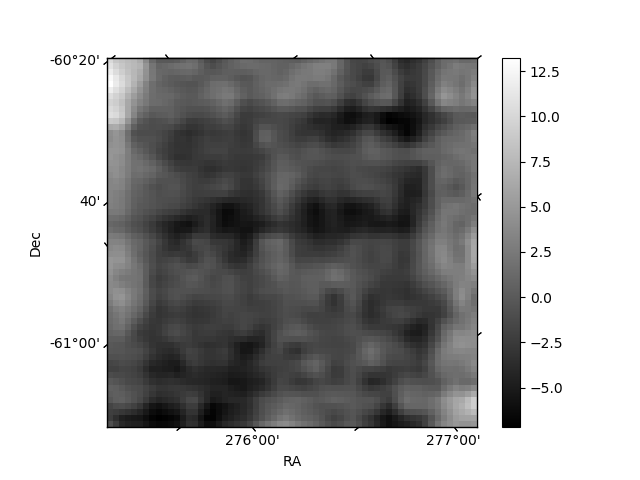
Histogram calculated using DETX and DETY for each event in the final _common_clean file
| Quadrant A | 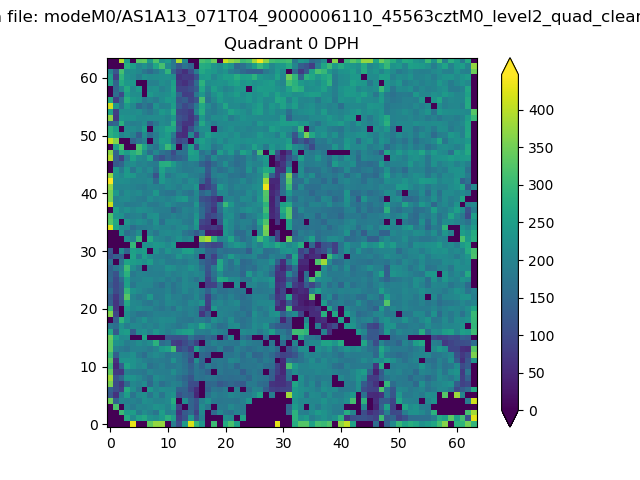 |
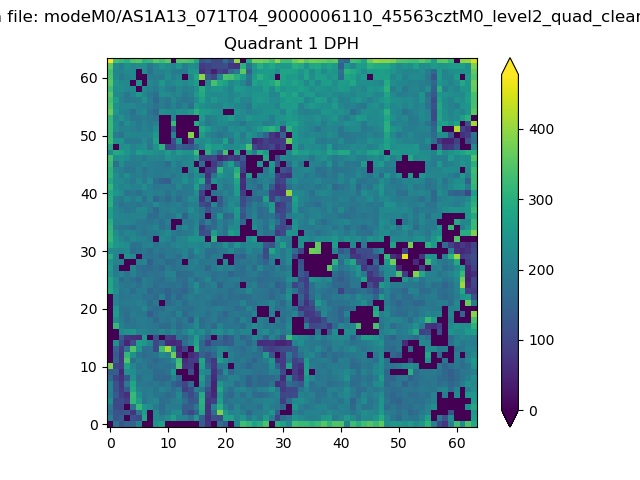 |
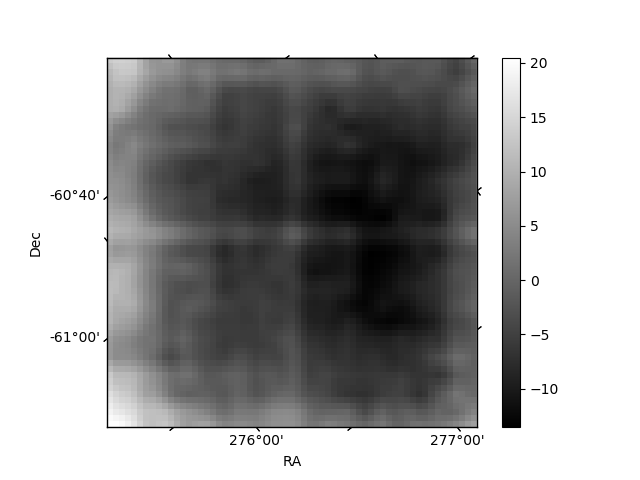
Quadrant B |
|---|---|---|---|
| Quadrant D | 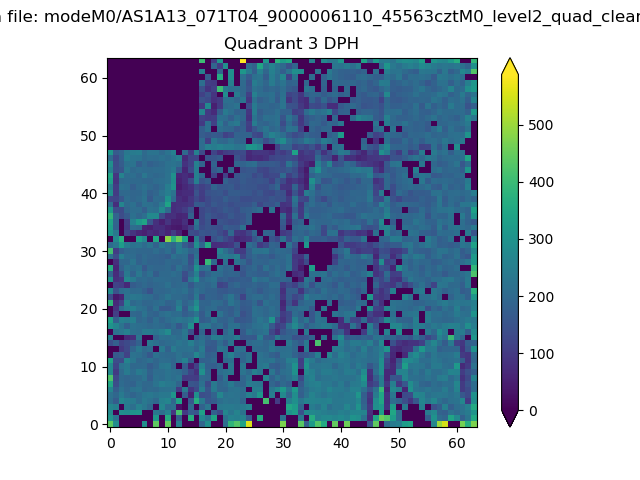 |
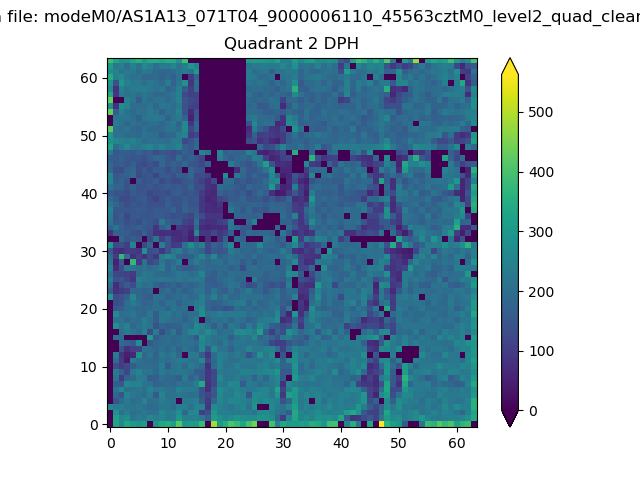 |
Quadrant C |
| Plot type | Count rate plots | Images |
|---|---|---|
| Comparison with Poisson distribution Blue bars denote a histogram of data divided into 1 sec bins. Red curve is a Poisson curve with rate = median count rate of data. |
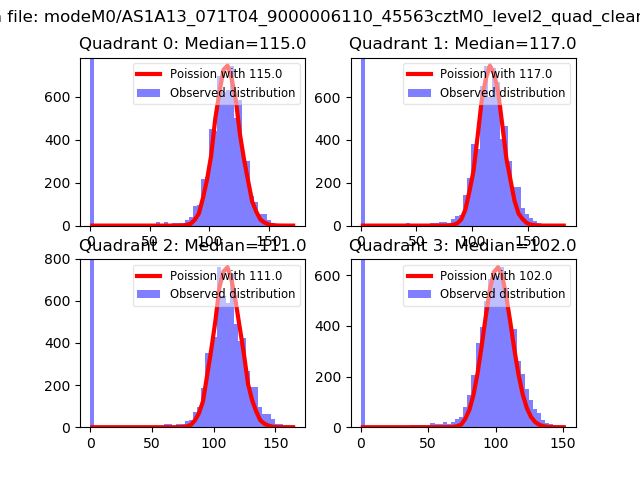 |
 |
| Quadrant-wise count rates Data is divided into 100 sec bins |
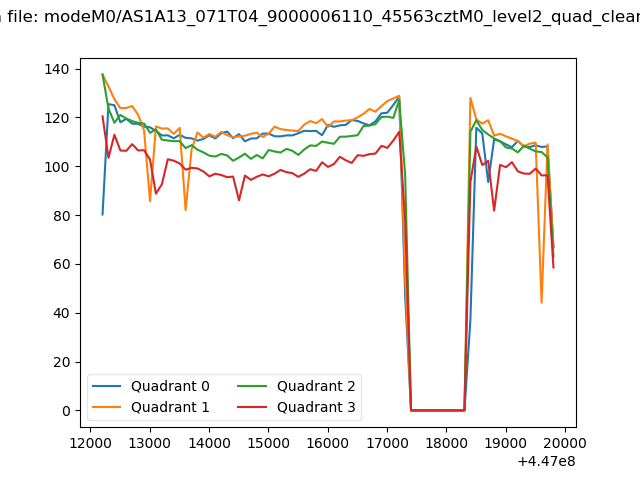 |
|
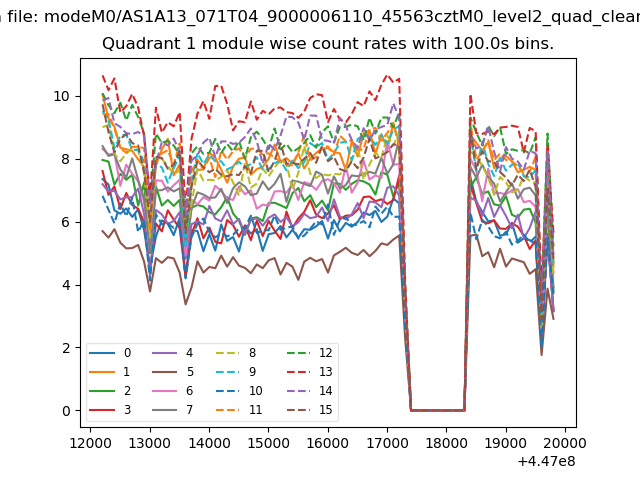
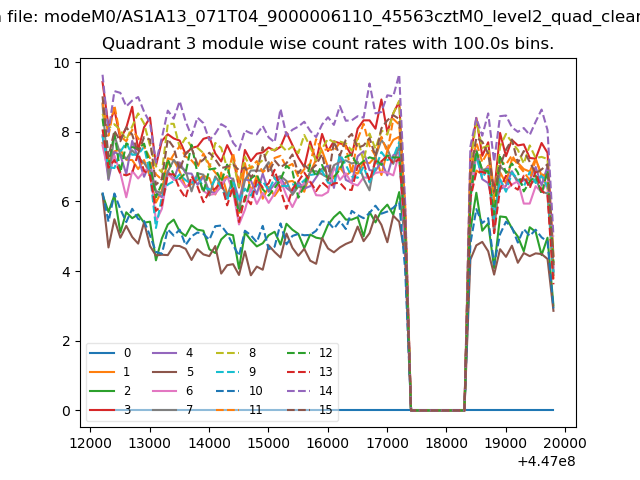
| Module-wise count rates for Quadrant A Data is divided into 100 sec bins |
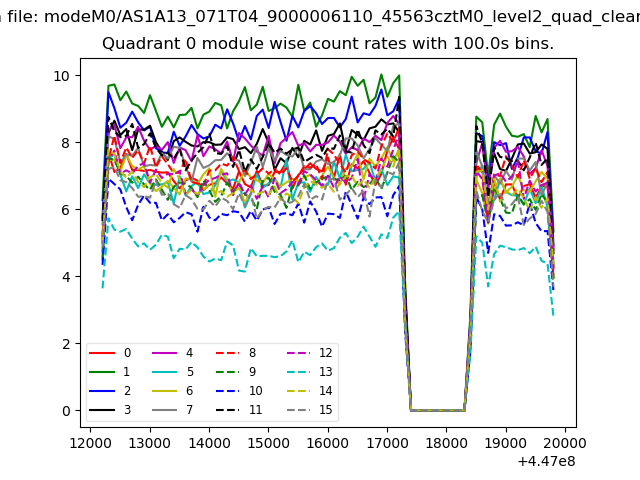 |
 |
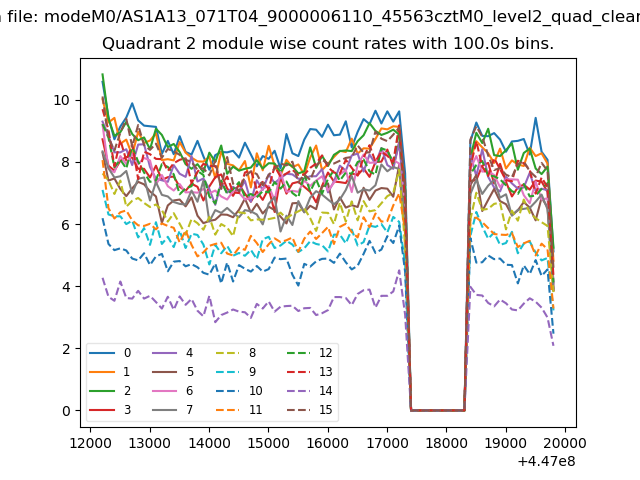
| Module-wise count rates for Quadrant B Data is divided into 100 sec bins |
 |
 |
| Module-wise count rates for Quadrant C Data is divided into 100 sec bins |
 |
 |
| Module-wise count rates for Quadrant D Data is divided into 100 sec bins |
 |
 |
| Parameter | Plot |
|---|---|
| CZT HV Monitor | 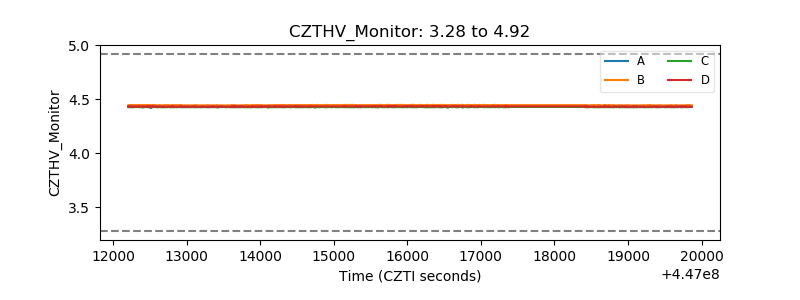 |
| D_VDD | 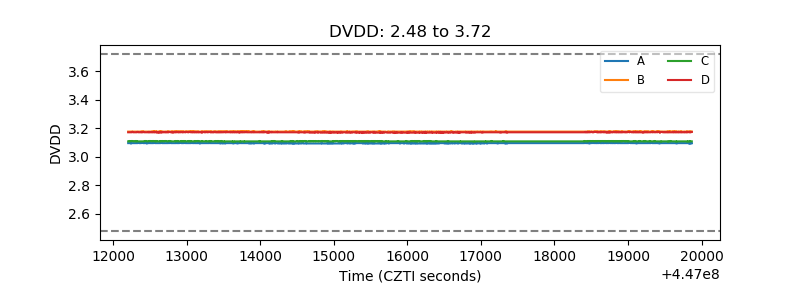 |
| Temperature 1 | 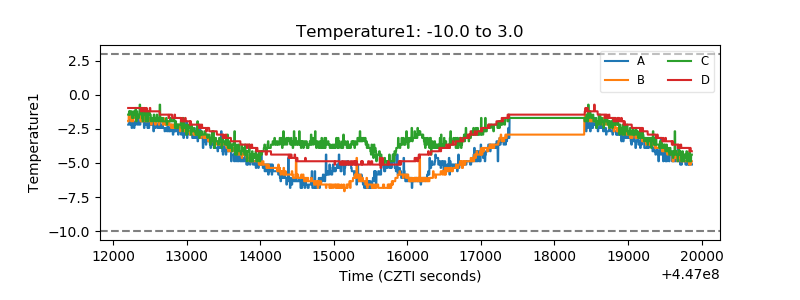 |
| Veto HV Monitor | 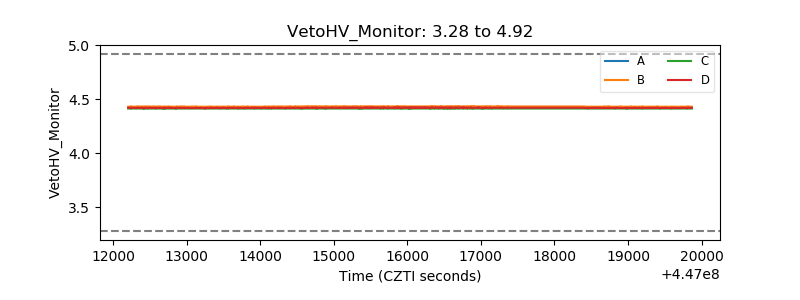 |
| Veto LLD | 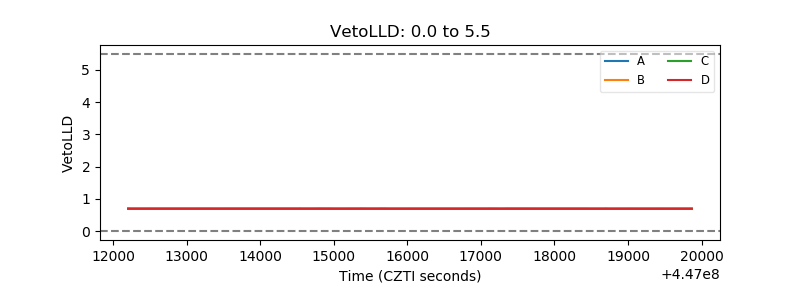 |
| Alpha Counter | 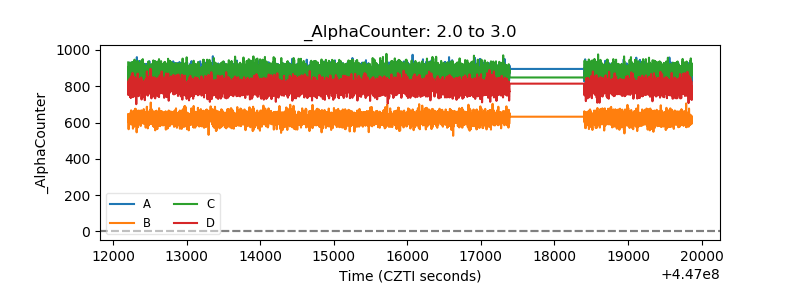 |
| _CPM_Rate | 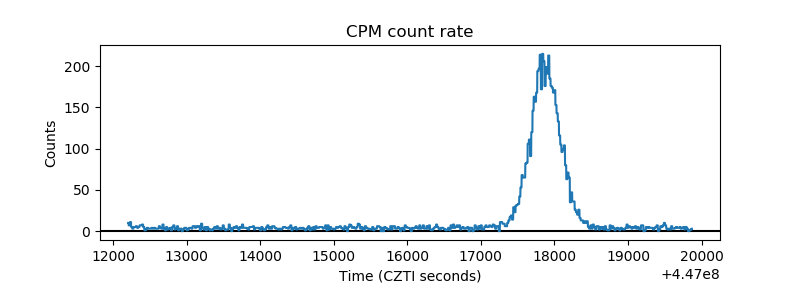 |
| CZT Counter | 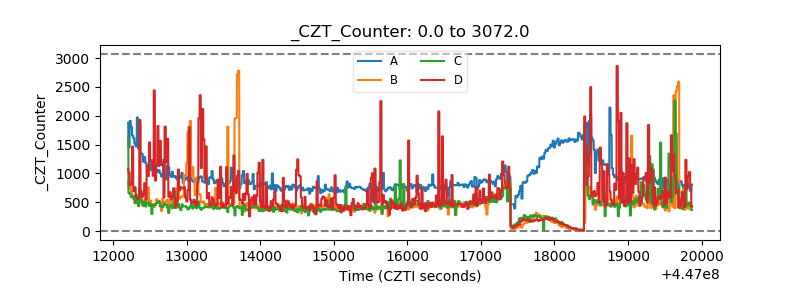 |
| +2.5 Volts monitor | 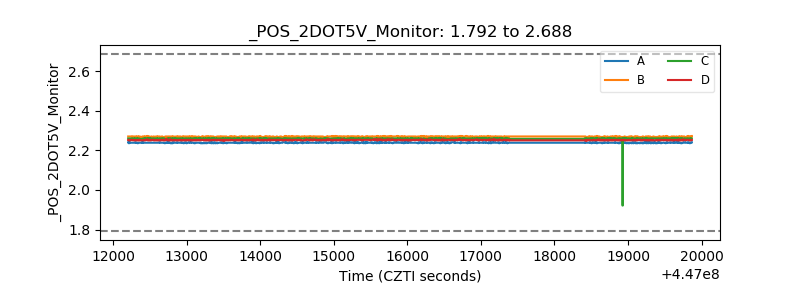 |
| +5 Volts monitor | 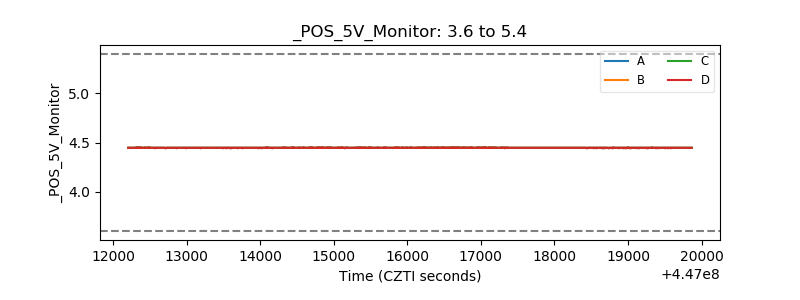 |
| _ROLL_ROT | 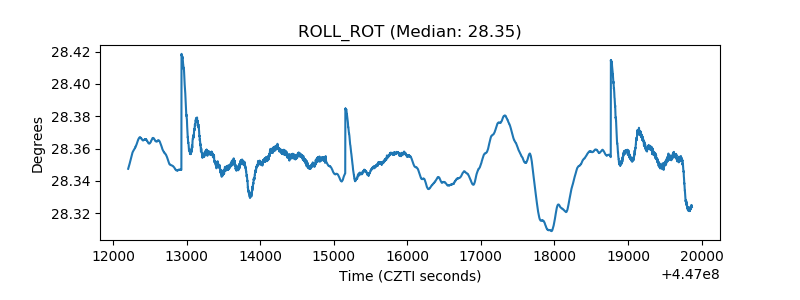 |
| _Roll_DEC | 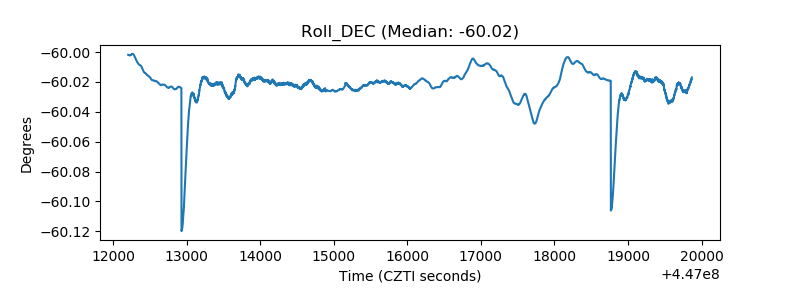 |
| _Roll_RA | 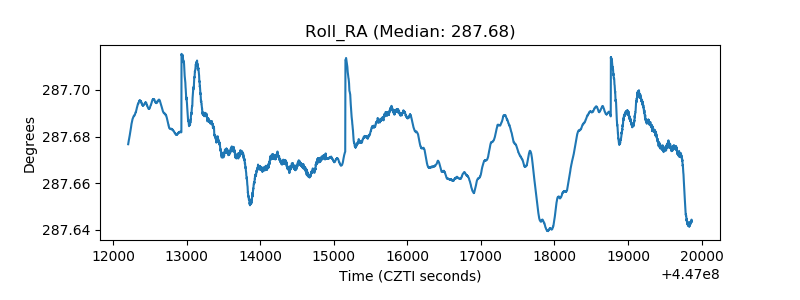 |
| Veto Counter | 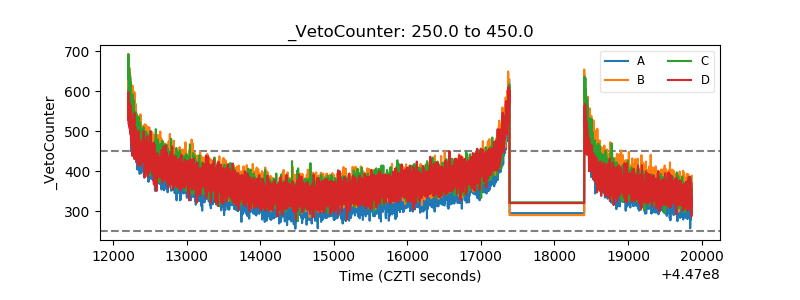 |