| Param | Original file | Final file |
|---|---|---|
| Filename | modeM0/AS1A13_071T04_9000006110_45564cztM0_level2.fits | modeM0/AS1A13_071T04_9000006110_45564cztM0_level2_quad_clean.evt |
| Size (bytes) | 491,267,520 | 113,342,400 |
| Size | 468.5 MB | 108.1 MB |
| Events in quadrant A | 6,063,847 | 741,742 |
| Events in quadrant B | 3,578,093 | 775,370 |
| Events in quadrant C | 3,326,547 | 750,017 |
| Events in quadrant D | 4,674,755 | 678,710 |
| Mode M9 | |||
|---|---|---|---|
| Quadrant | BADHDUFLAG | Total packets | Discarded packets |
| A | 0 | 11 | 0 |
| B | 0 | 12 | 0 |
| C | 0 | 12 | 0 |
| D | 0 | 12 | 0 |
| Mode M0 | |||
|---|---|---|---|
| Quadrant | BADHDUFLAG | Total packets | Discarded packets |
| A | 0 | 22925 | 2 |
| B | 0 | 15512 | 2 |
| C | 0 | 14979 | 2 |
| D | 0 | 18790 | 2 |
| Mode SS | |||
|---|---|---|---|
| Quadrant | BADHDUFLAG | Total packets | Discarded packets |
| A | 0 | 140 | 0 |
| B | 0 | 140 | 0 |
| C | 0 | 140 | 0 |
| D | 0 | 140 | 0 |
| Quadrant | Total seconds | Saturated seconds | Saturation percentage |
|---|---|---|---|
| A | 6981 | 334 | 4.784415% |
| B | 6981 | 198 | 2.836270% |
| C | 6981 | 45 | 0.644607% |
| D | 6981 | 196 | 2.807621% |
Noise dominated data is calculated using 1-second bins in cleaned event files. If a bin has >2000 counts, and if more than 50% of those come from <1% of pixels, then it is considered to be noise-dominated and hence unusable.
| Quadrant | # 1 sec bins | Bins with >0 counts | Bins with >2000 counts | High rate bins dominated by noise | Noise dominated (total time) | Noise dominated (detector-on time) | Marked lightcurve |
|---|---|---|---|---|---|---|---|
| A | 7596 | 6982 | 27 | 27 | 0.36% | 0.39% | 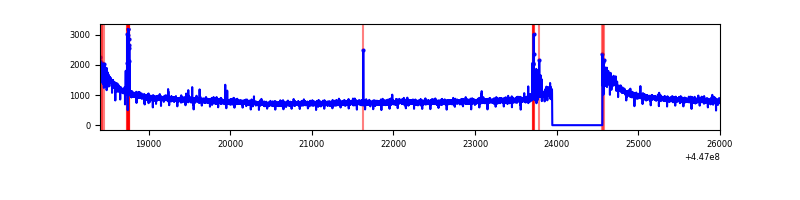 |
| B | 7596 | 6982 | 66 | 66 | 0.87% | 0.95% | 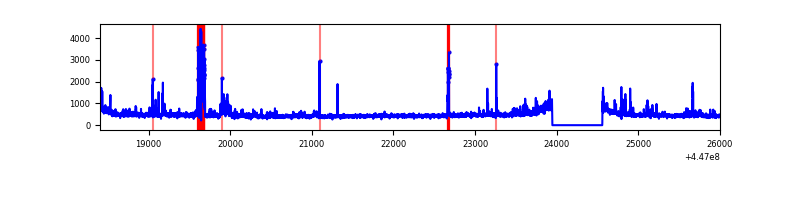 |
| C | 7596 | 6982 | 14 | 14 | 0.18% | 0.20% | 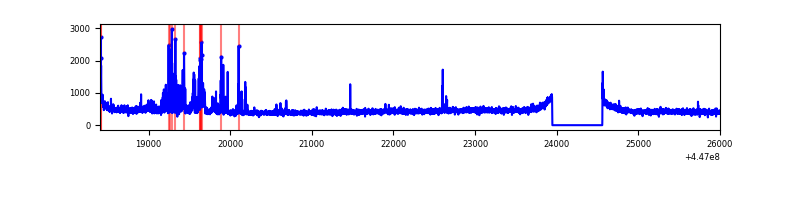 |
| D | 7596 | 6982 | 111 | 111 | 1.46% | 1.59% | 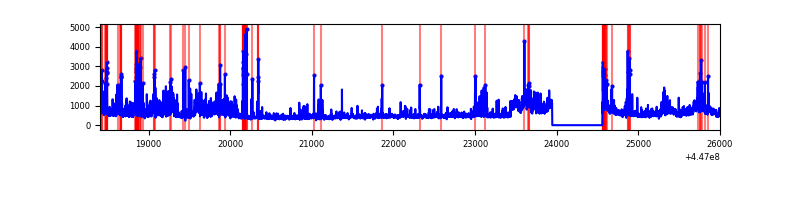 |
Top three noisy pixels from each quadrant. If the there are fewer than three noisy pixels in the level2.evt file, extra rows are filled as -1
| Pixel properties | Quadrant properties | ||||||
|---|---|---|---|---|---|---|---|
| Quadrant | DetID | PixID | Counts | Sigma | Mean | Median | Sigma |
| A | 10 | 83 | 2967525 | 18377.68 | 780 | 762 | 161.4 |
| A | 13 | 248 | 54321 | 331.77 | 780 | 762 | 161.4 |
| A | 10 | 248 | 12508 | 72.76 | 780 | 762 | 161.4 |
| B | 5 | 172 | 163434 | 1058.39 | 781 | 756 | 153.7 |
| B | 15 | 35 | 85246 | 549.69 | 781 | 756 | 153.7 |
| B | 7 | 221 | 41427 | 264.6 | 781 | 756 | 153.7 |
| C | 12 | 2 | 310562 | 1737.71 | 766 | 770 | 178.3 |
| C | 14 | 254 | 16904 | 90.5 | 766 | 770 | 178.3 |
| C | 13 | 61 | 5182 | 24.75 | 766 | 770 | 178.3 |
| D | 5 | 171 | 471446 | 2465.96 | 762 | 737 | 190.9 |
| D | 1 | 52 | 332510 | 1738.1 | 762 | 737 | 190.9 |
| D | 12 | 233 | 248331 | 1297.1 | 762 | 737 | 190.9 |
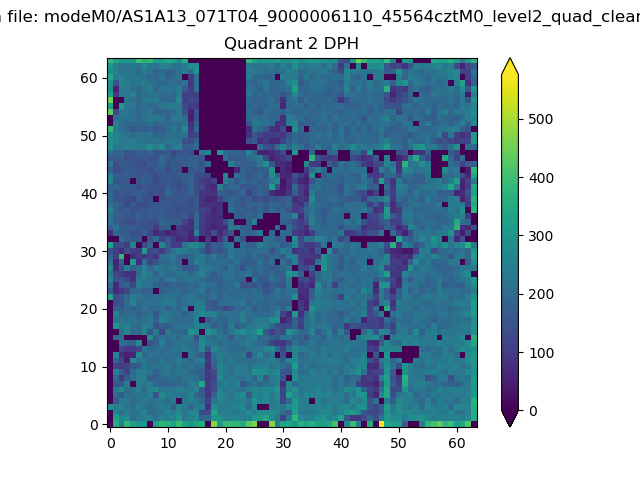
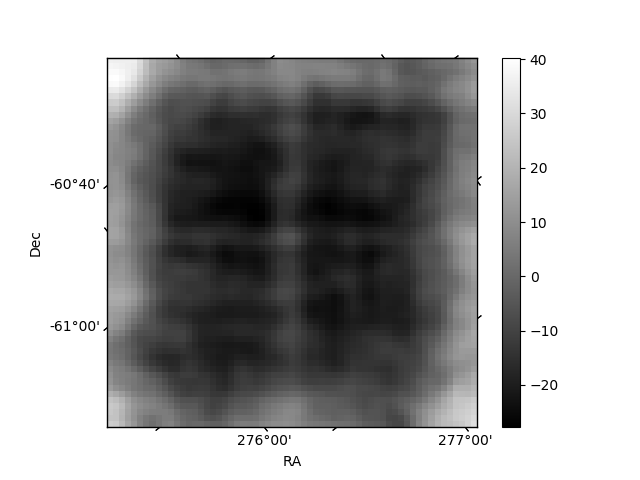
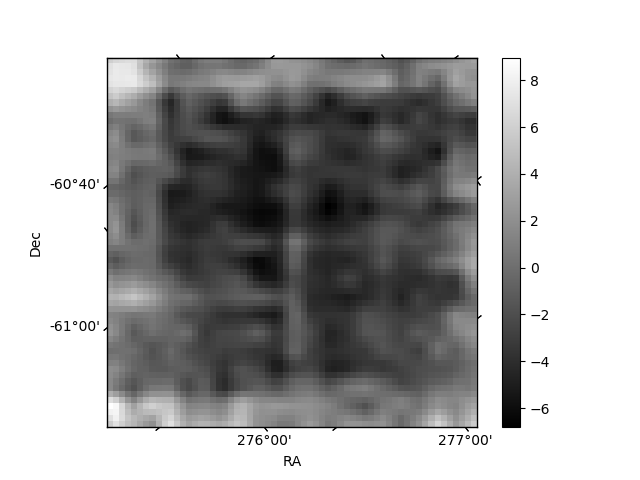
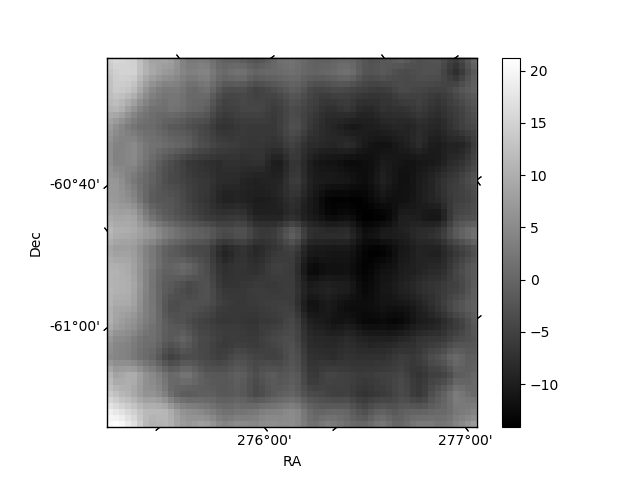
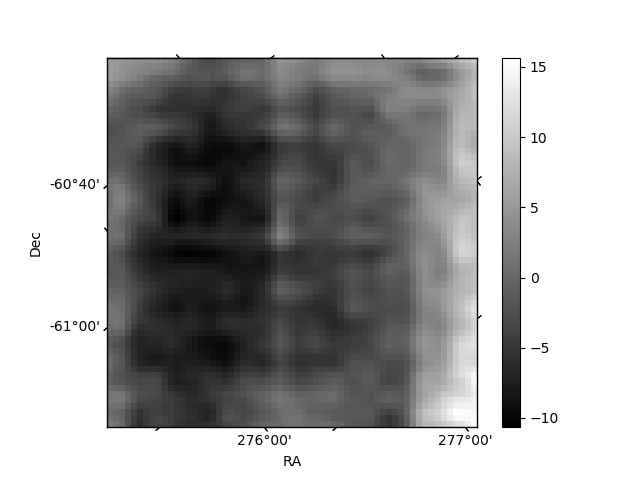
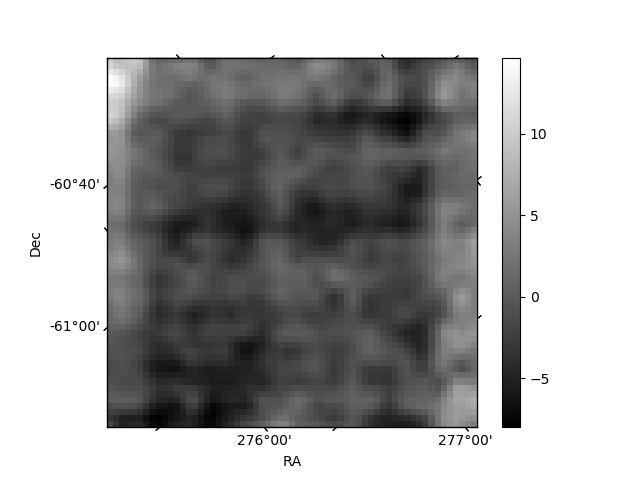
Histogram calculated using DETX and DETY for each event in the final _common_clean file
| Quadrant A | 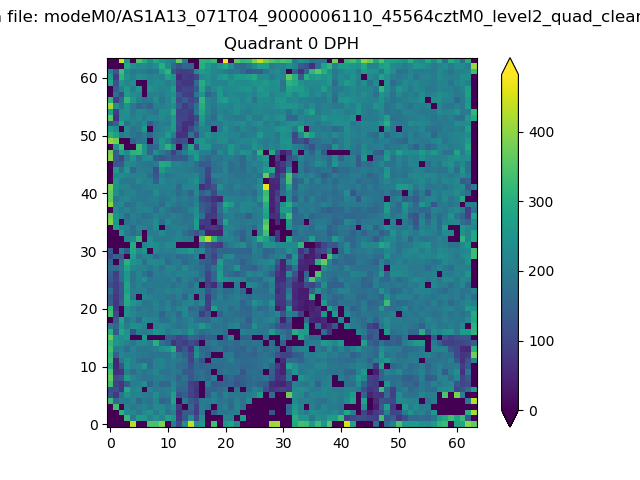 |
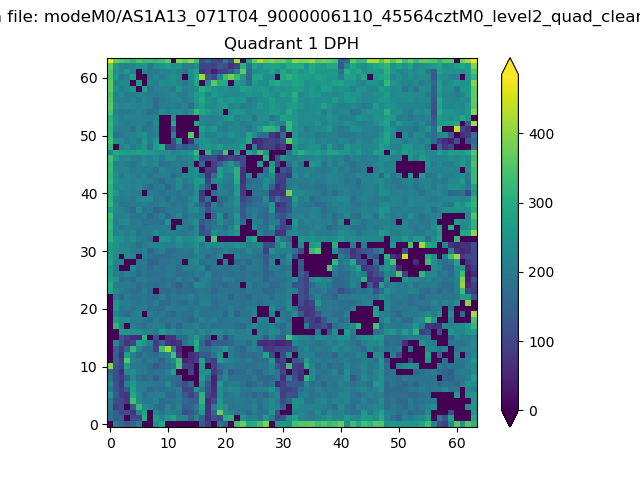 |
Quadrant B |
|---|---|---|---|
| Quadrant D | 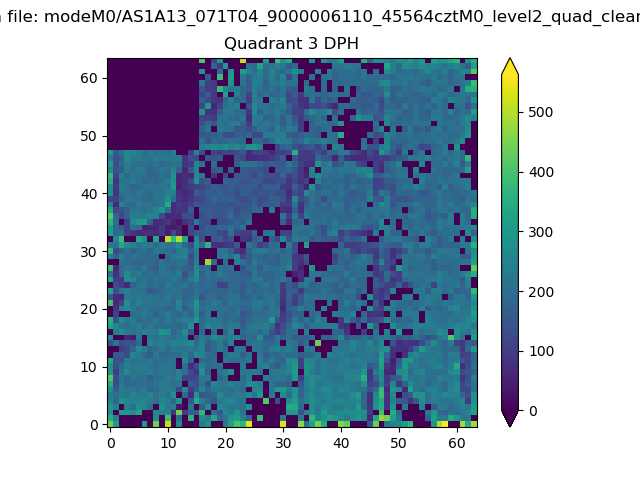 |
 |
Quadrant C |
| Plot type | Count rate plots | Images |
|---|---|---|
| Comparison with Poisson distribution Blue bars denote a histogram of data divided into 1 sec bins. Red curve is a Poisson curve with rate = median count rate of data. |
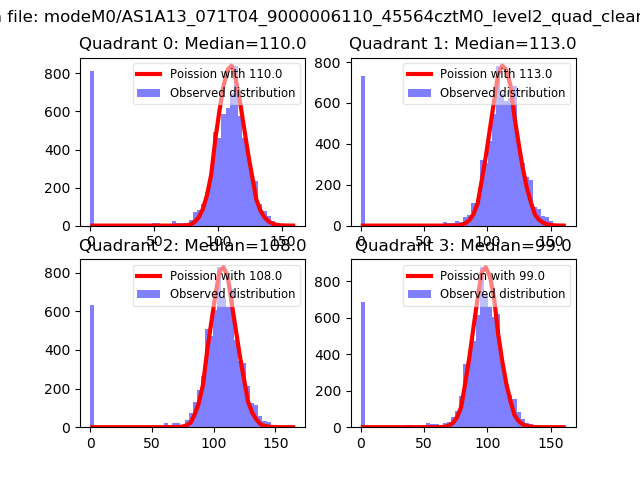 |
 |
| Quadrant-wise count rates Data is divided into 100 sec bins |
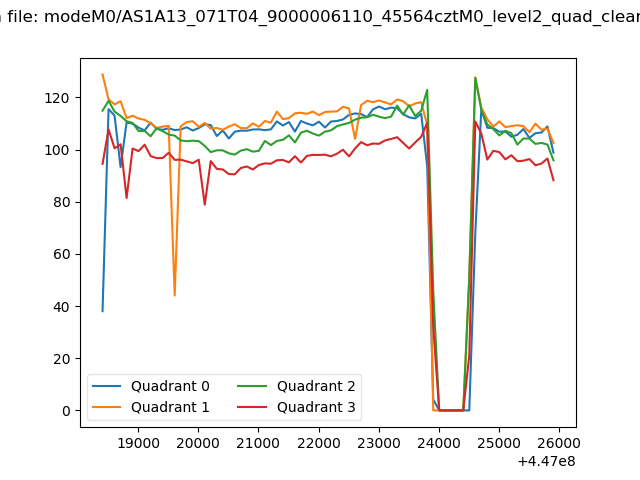 |
|
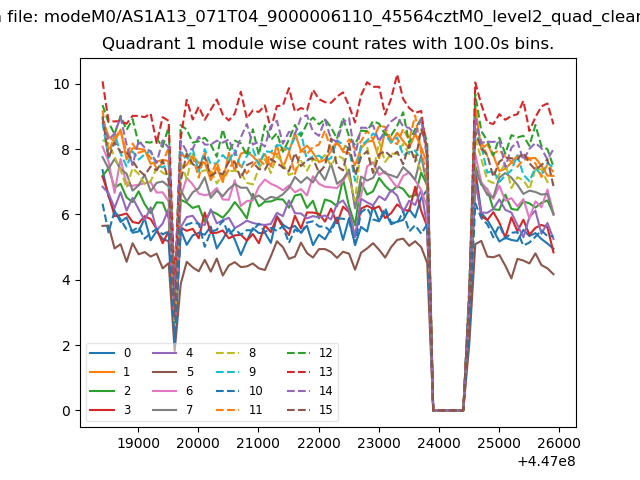
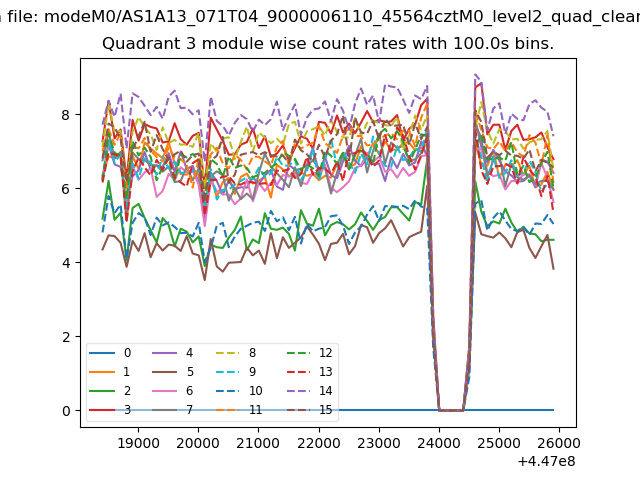
| Module-wise count rates for Quadrant A Data is divided into 100 sec bins |
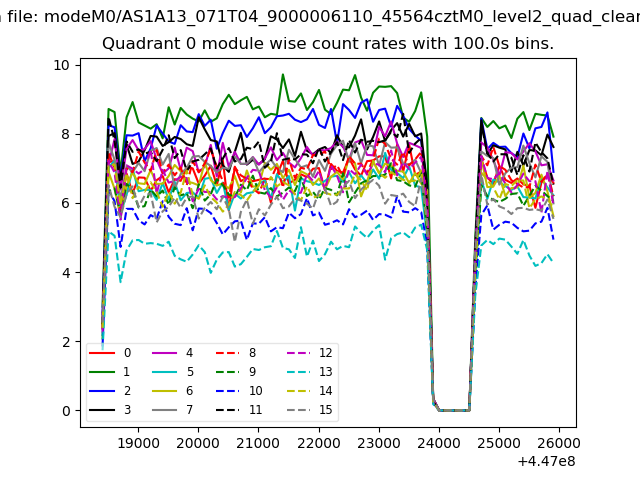 |
 |
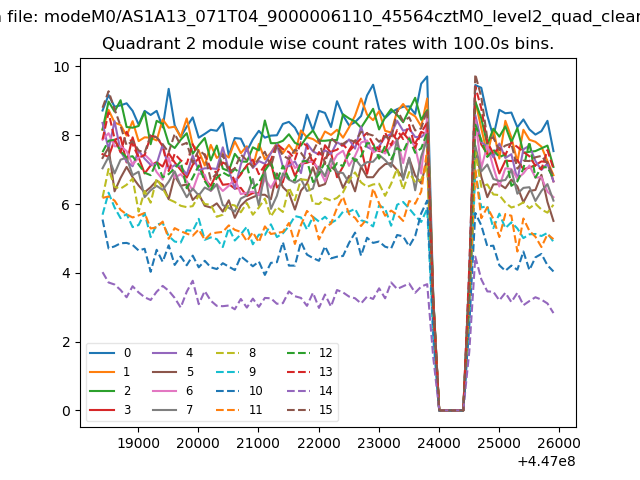
| Module-wise count rates for Quadrant B Data is divided into 100 sec bins |
 |
 |
| Module-wise count rates for Quadrant C Data is divided into 100 sec bins |
 |
 |
| Module-wise count rates for Quadrant D Data is divided into 100 sec bins |
 |
 |
| Parameter | Plot |
|---|---|
| CZT HV Monitor | 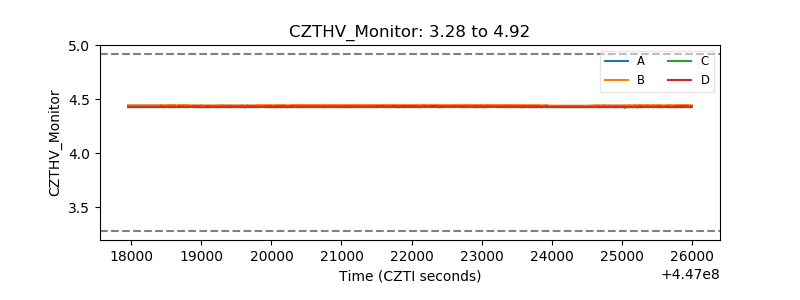 |
| D_VDD | 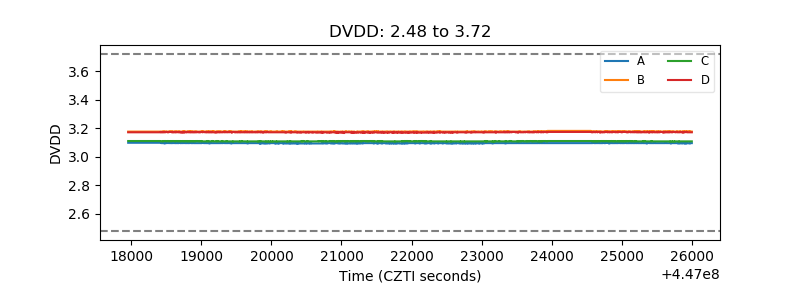 |
| Temperature 1 | 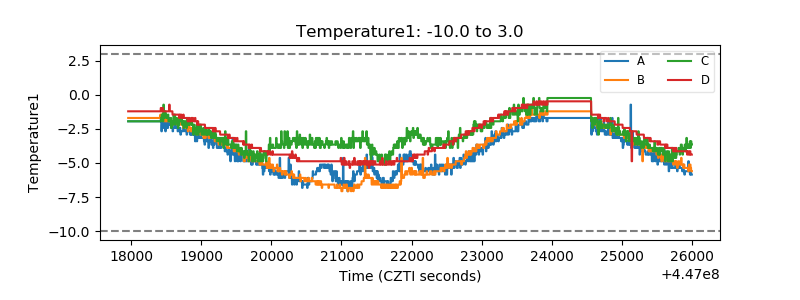 |
| Veto HV Monitor | 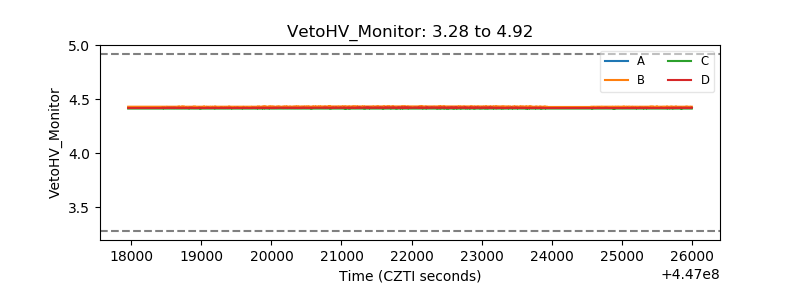 |
| Veto LLD | 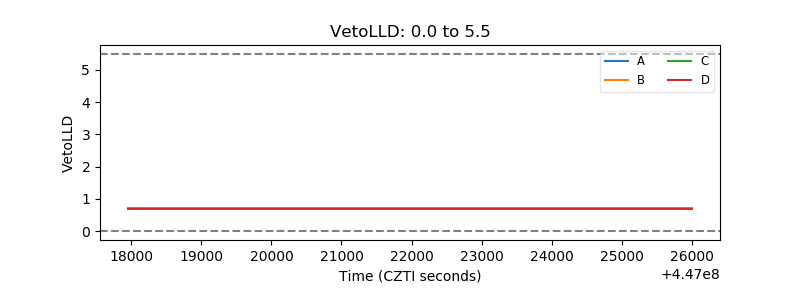 |
| Alpha Counter | 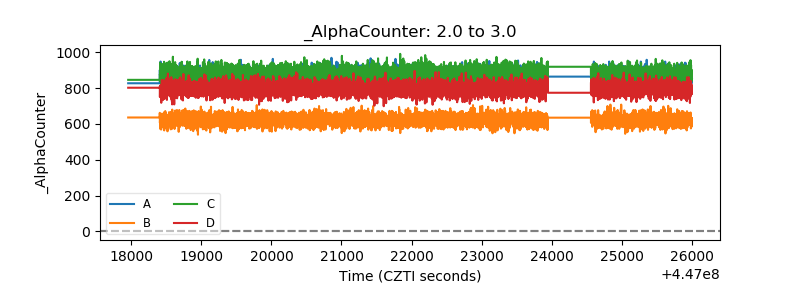 |
| _CPM_Rate | 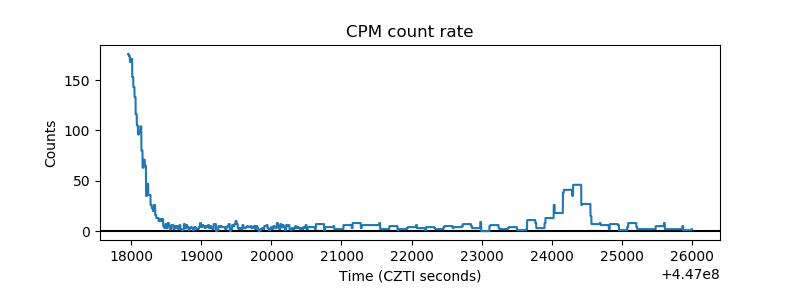 |
| CZT Counter | 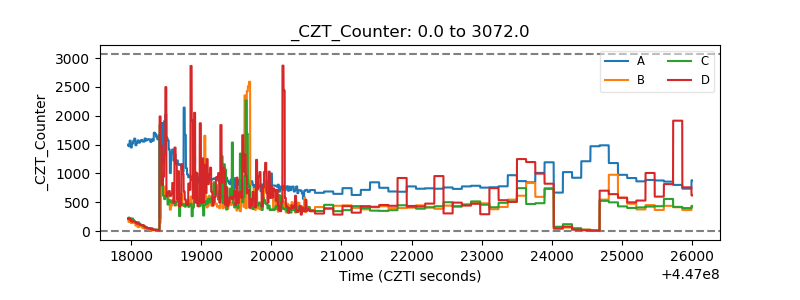 |
| +2.5 Volts monitor | 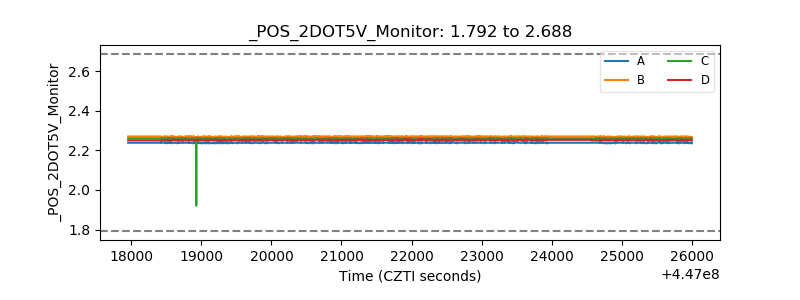 |
| +5 Volts monitor | 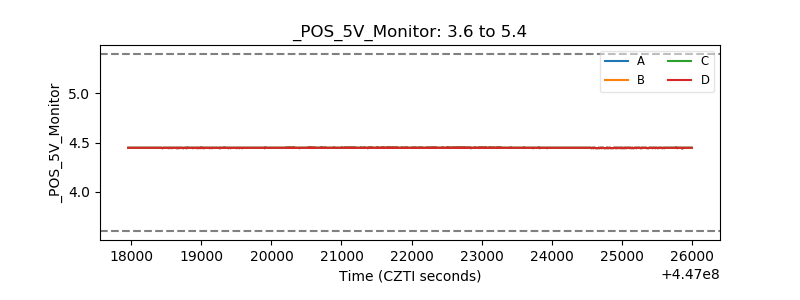 |
| _ROLL_ROT | 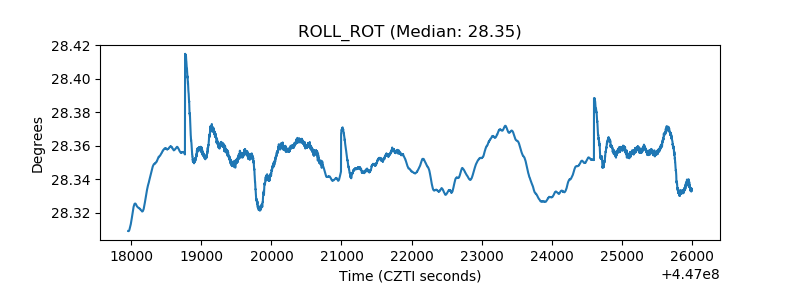 |
| _Roll_DEC | 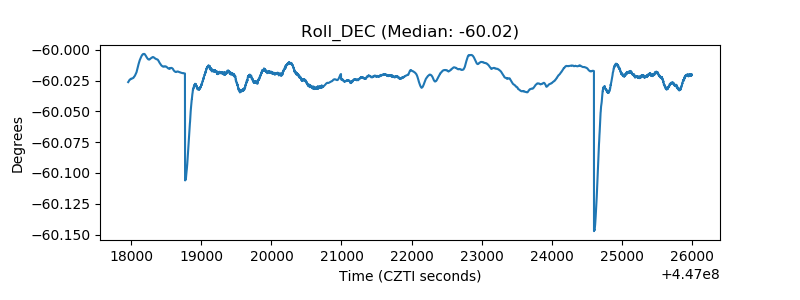 |
| _Roll_RA | 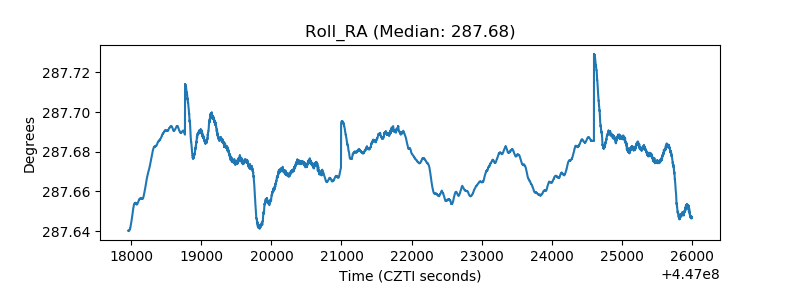 |
| Veto Counter | 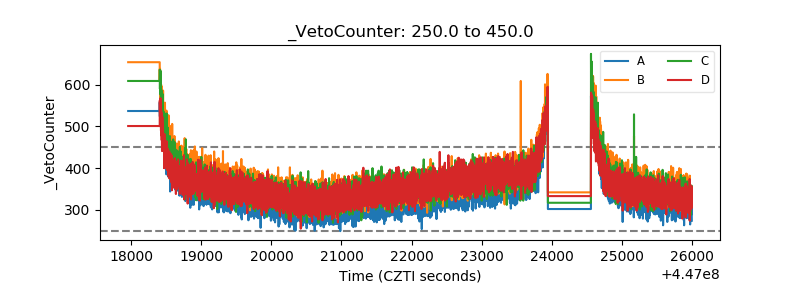 |