| Param | Original file | Final file |
|---|---|---|
| Filename | modeM0/AS1A13_071T04_9000006110_45565cztM0_level2.fits | modeM0/AS1A13_071T04_9000006110_45565cztM0_level2_quad_clean.evt |
| Size (bytes) | 538,830,720 | 124,107,840 |
| Size | 513.9 MB | 118.4 MB |
| Events in quadrant A | 6,330,459 | 830,170 |
| Events in quadrant B | 4,188,452 | 847,675 |
| Events in quadrant C | 3,407,463 | 814,921 |
| Events in quadrant D | 5,423,550 | 730,381 |
| Mode M0 | |||
|---|---|---|---|
| Quadrant | BADHDUFLAG | Total packets | Discarded packets |
| A | 0 | 24255 | 0 |
| B | 0 | 17813 | 0 |
| C | 0 | 15942 | 0 |
| D | 0 | 21572 | 0 |
| Mode SS | |||
|---|---|---|---|
| Quadrant | BADHDUFLAG | Total packets | Discarded packets |
| A | 0 | 154 | 0 |
| B | 0 | 154 | 0 |
| C | 0 | 154 | 0 |
| D | 0 | 154 | 0 |
| Quadrant | Total seconds | Saturated seconds | Saturation percentage |
|---|---|---|---|
| A | 7685 | 181 | 2.355237% |
| B | 7684 | 195 | 2.537741% |
| C | 7684 | 21 | 0.273295% |
| D | 7684 | 272 | 3.539823% |
Noise dominated data is calculated using 1-second bins in cleaned event files. If a bin has >2000 counts, and if more than 50% of those come from <1% of pixels, then it is considered to be noise-dominated and hence unusable.
| Quadrant | # 1 sec bins | Bins with >0 counts | Bins with >2000 counts | High rate bins dominated by noise | Noise dominated (total time) | Noise dominated (detector-on time) | Marked lightcurve |
|---|---|---|---|---|---|---|---|
| A | 7685 | 7685 | 3 | 3 | 0.04% | 0.04% | 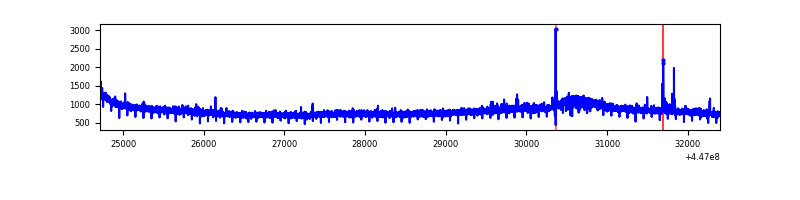 |
| B | 7684 | 7684 | 59 | 59 | 0.77% | 0.77% | 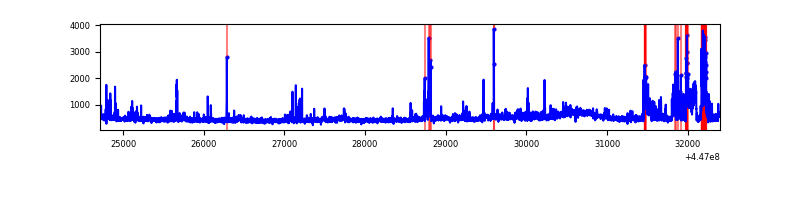 |
| C | 7684 | 7684 | 8 | 8 | 0.10% | 0.10% | 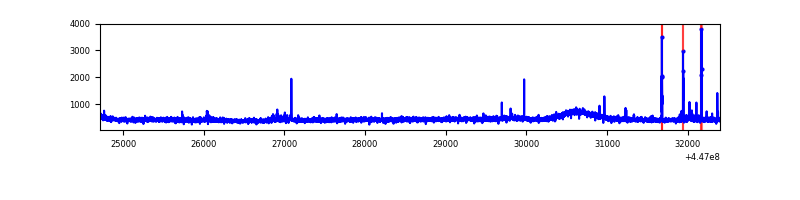 |
| D | 7684 | 7684 | 206 | 206 | 2.68% | 2.68% | 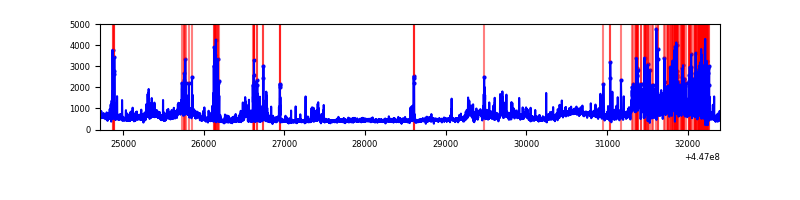 |
Top three noisy pixels from each quadrant. If the there are fewer than three noisy pixels in the level2.evt file, extra rows are filled as -1
| Pixel properties | Quadrant properties | ||||||
|---|---|---|---|---|---|---|---|
| Quadrant | DetID | PixID | Counts | Sigma | Mean | Median | Sigma |
| A | 10 | 83 | 2957178 | 16547.12 | 861 | 840 | 178.7 |
| A | 10 | 248 | 19100 | 102.2 | 861 | 840 | 178.7 |
| A | 2 | 79 | 11387 | 59.03 | 861 | 840 | 178.7 |
| B | 15 | 201 | 360817 | 2141.86 | 859 | 832 | 168.1 |
| B | 5 | 172 | 116500 | 688.21 | 859 | 832 | 168.1 |
| B | 4 | 171 | 67748 | 398.14 | 859 | 832 | 168.1 |
| C | 14 | 254 | 65069 | 326.63 | 842 | 845 | 196.6 |
| C | 12 | 2 | 26411 | 130.02 | 842 | 845 | 196.6 |
| C | 1 | 3 | 23734 | 116.41 | 842 | 845 | 196.6 |
| D | 1 | 52 | 707234 | 3362.45 | 836 | 808 | 210.1 |
| D | 5 | 171 | 530036 | 2519.02 | 836 | 808 | 210.1 |
| D | 11 | 241 | 356717 | 1694.06 | 836 | 808 | 210.1 |
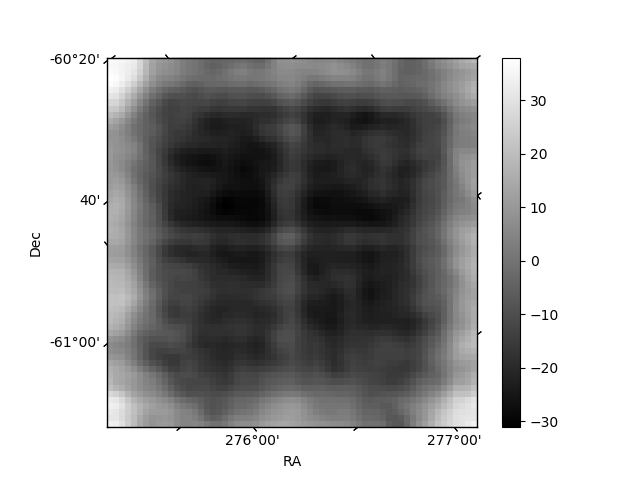
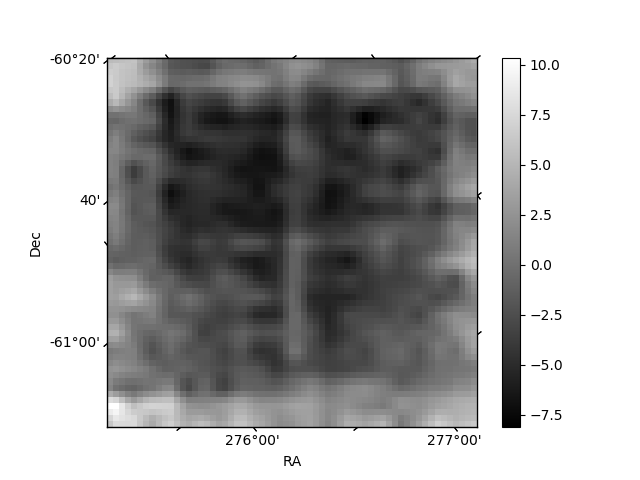
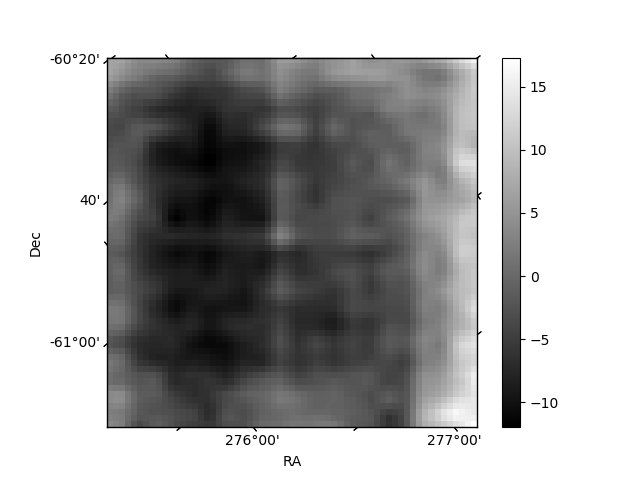
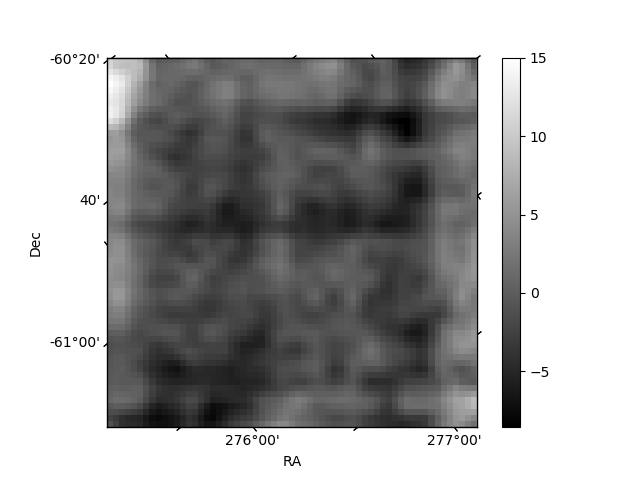
Histogram calculated using DETX and DETY for each event in the final _common_clean file
| Quadrant A | 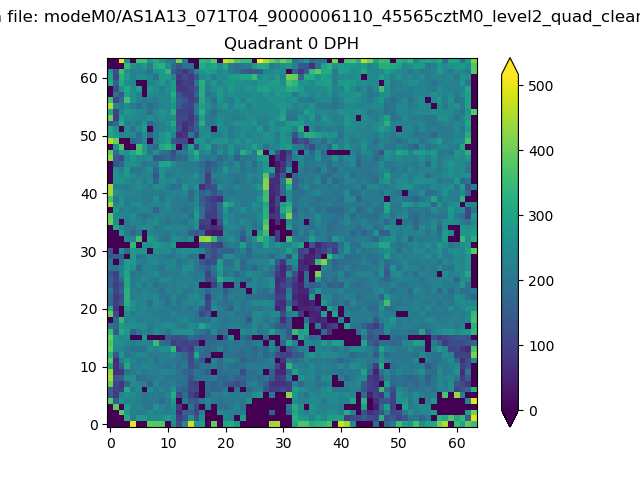 |
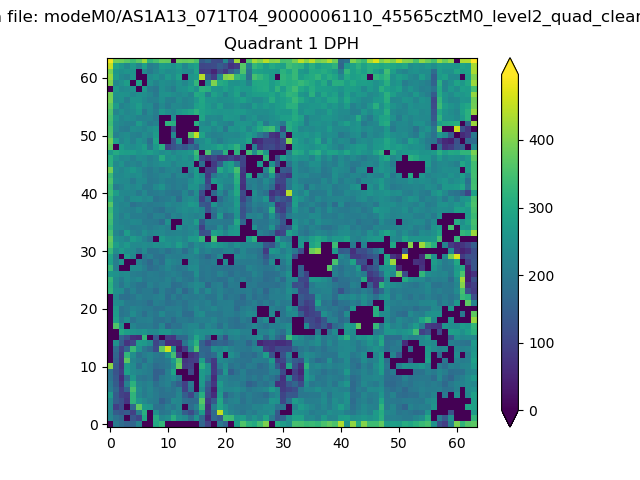 |
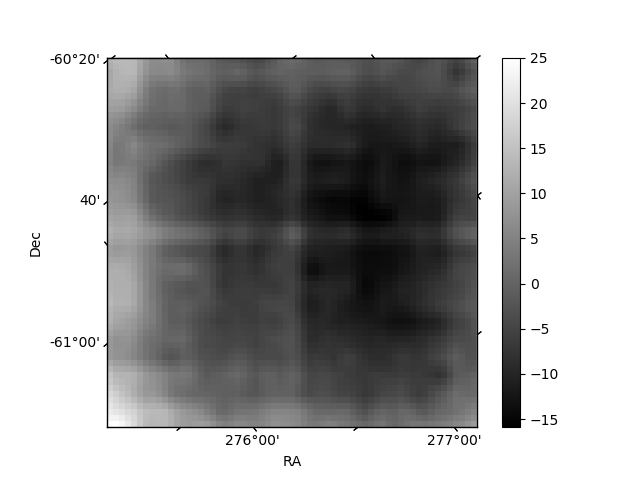
Quadrant B |
|---|---|---|---|
| Quadrant D | 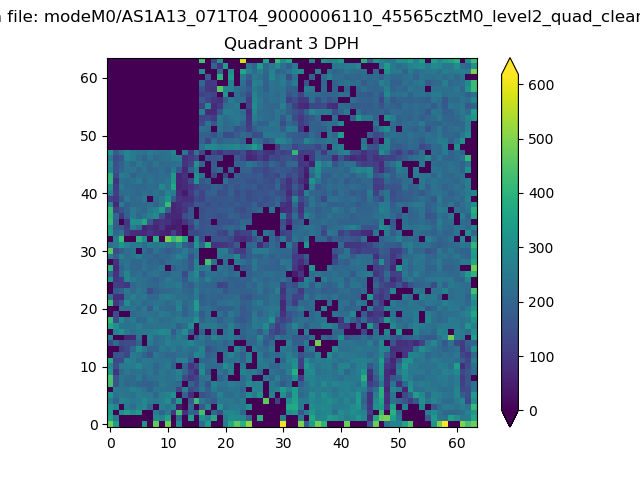 |
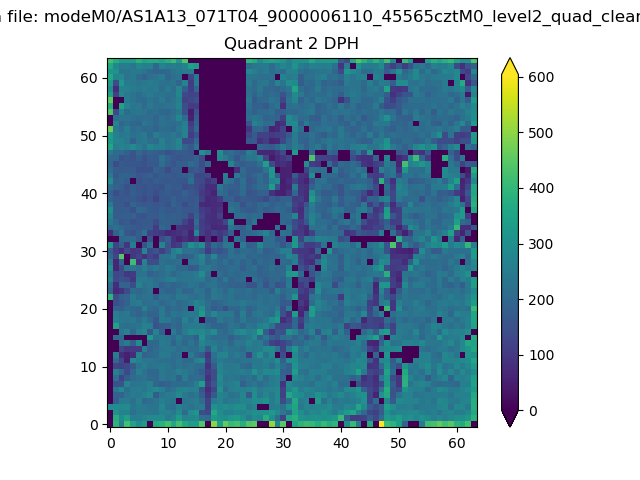 |
Quadrant C |
| Plot type | Count rate plots | Images |
|---|---|---|
| Comparison with Poisson distribution Blue bars denote a histogram of data divided into 1 sec bins. Red curve is a Poisson curve with rate = median count rate of data. |
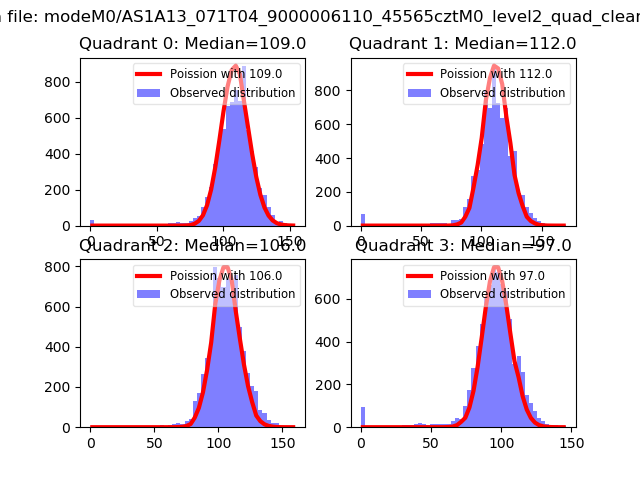 |
 |
| Quadrant-wise count rates Data is divided into 100 sec bins |
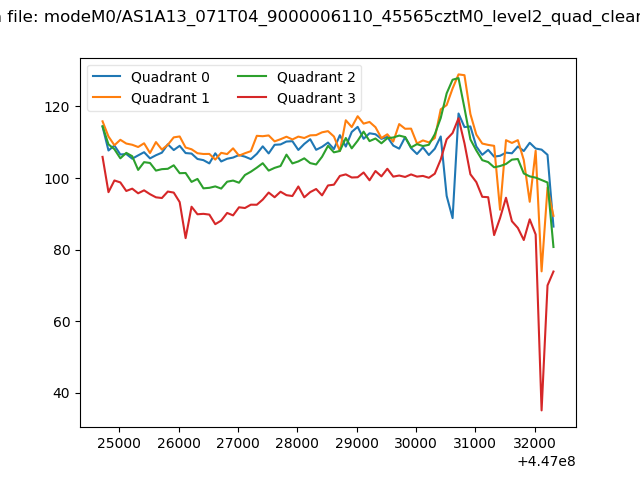 |
|
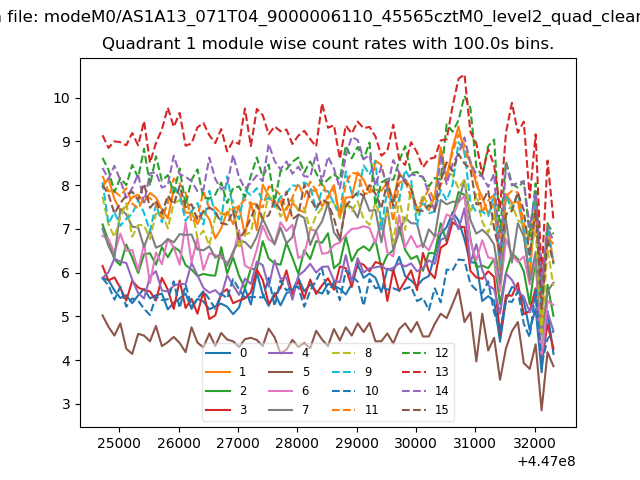
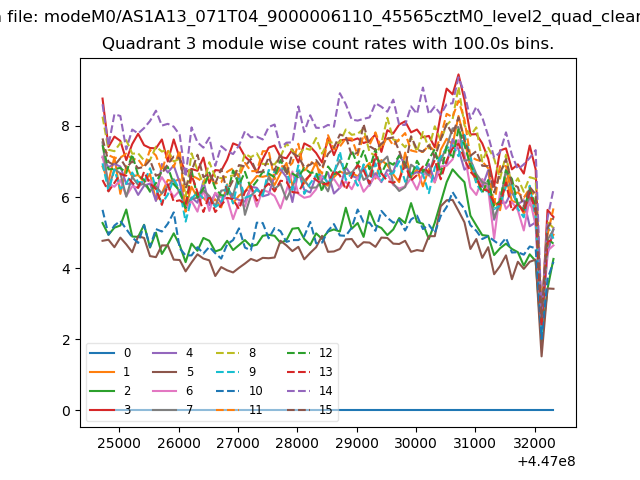
| Module-wise count rates for Quadrant A Data is divided into 100 sec bins |
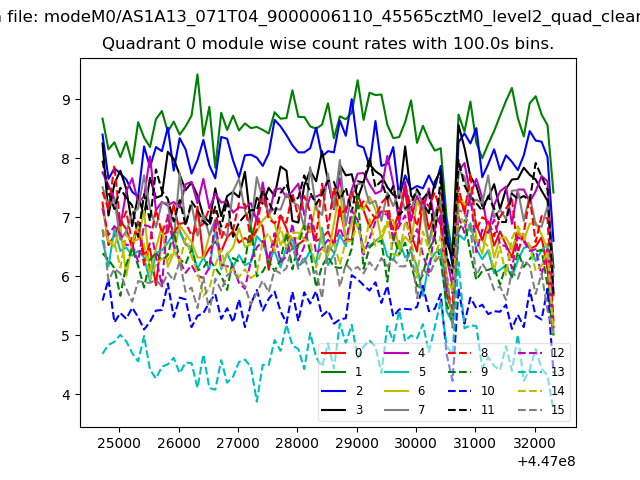 |
 |
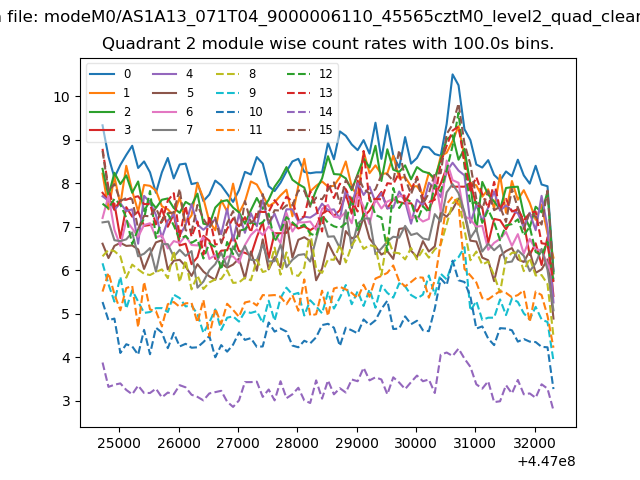
| Module-wise count rates for Quadrant B Data is divided into 100 sec bins |
 |
 |
| Module-wise count rates for Quadrant C Data is divided into 100 sec bins |
 |
 |
| Module-wise count rates for Quadrant D Data is divided into 100 sec bins |
 |
 |
| Parameter | Plot |
|---|---|
| CZT HV Monitor | 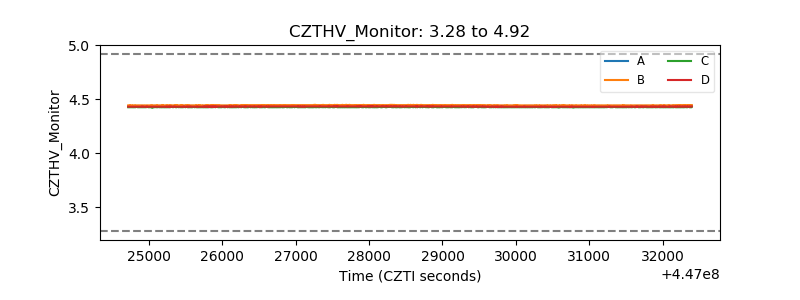 |
| D_VDD | 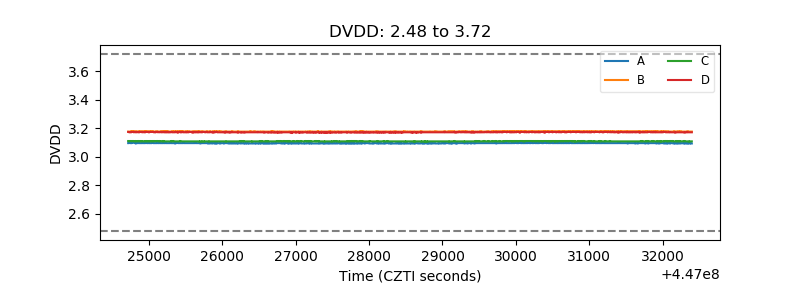 |
| Temperature 1 | 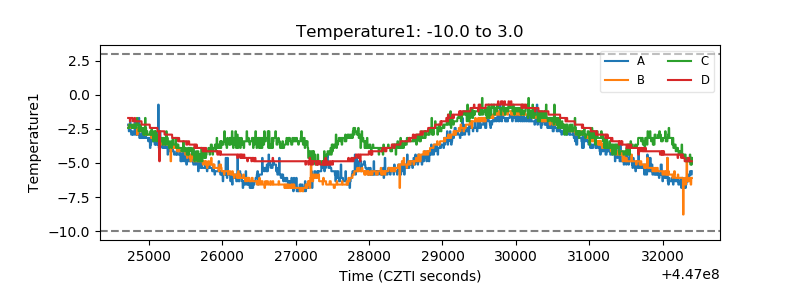 |
| Veto HV Monitor | 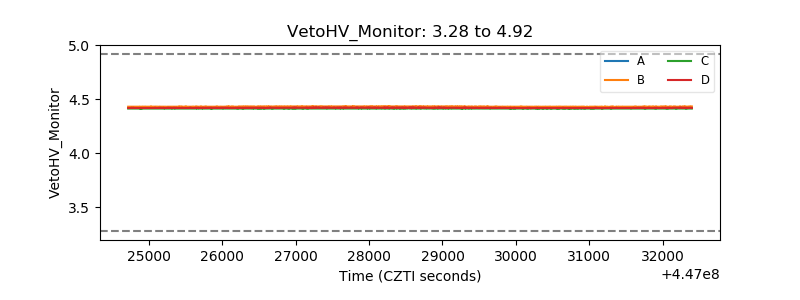 |
| Veto LLD | 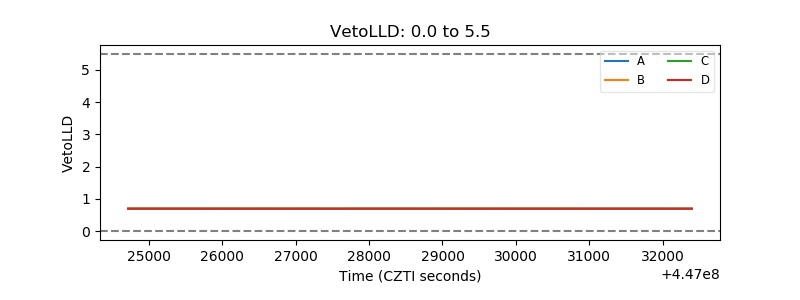 |
| Alpha Counter | 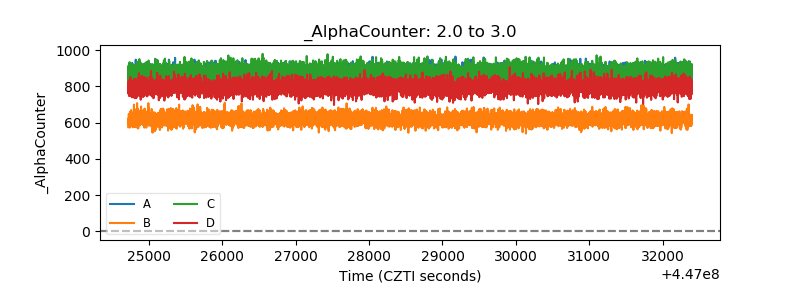 |
| _CPM_Rate | 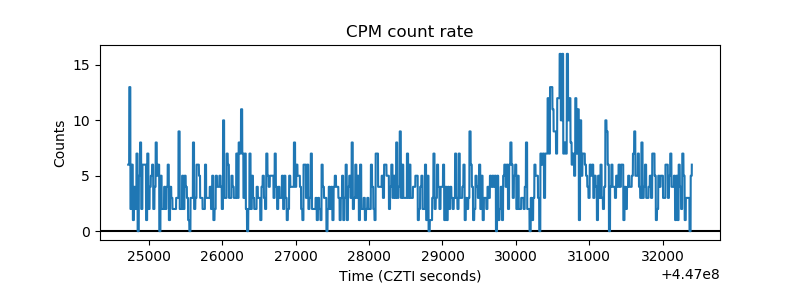 |
| CZT Counter | 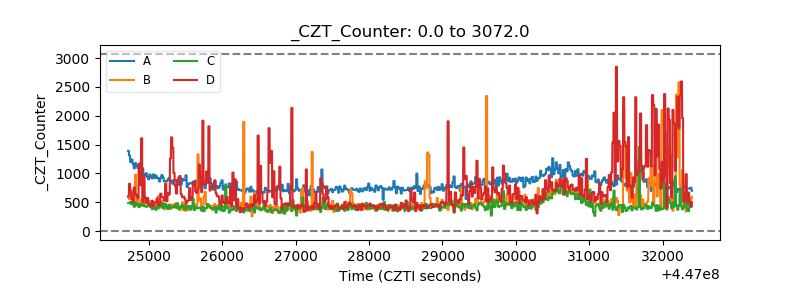 |
| +2.5 Volts monitor | 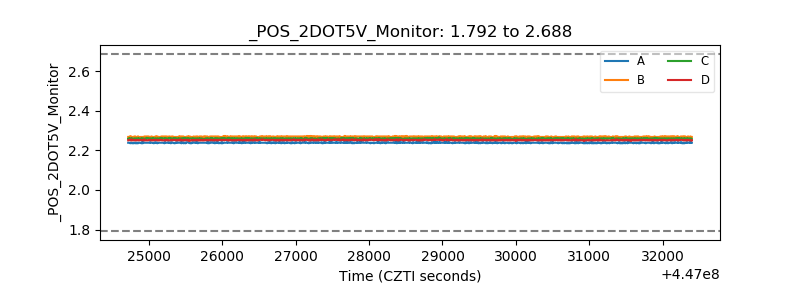 |
| +5 Volts monitor | 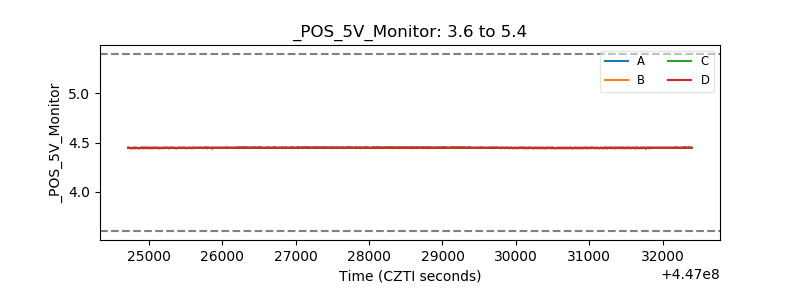 |
| _ROLL_ROT | 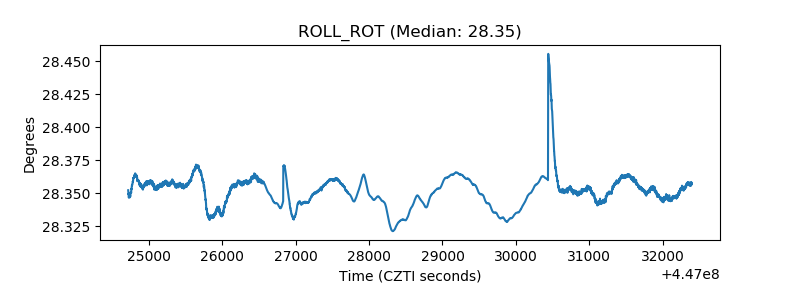 |
| _Roll_DEC | 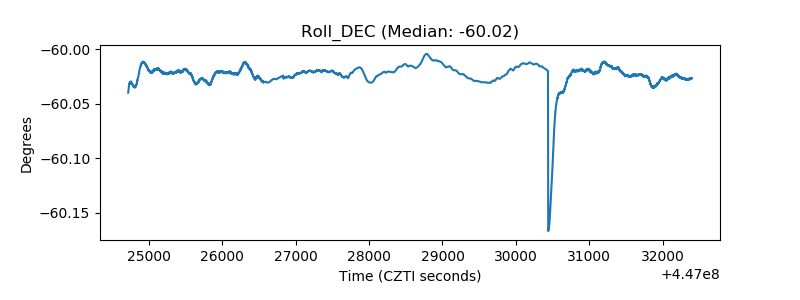 |
| _Roll_RA | 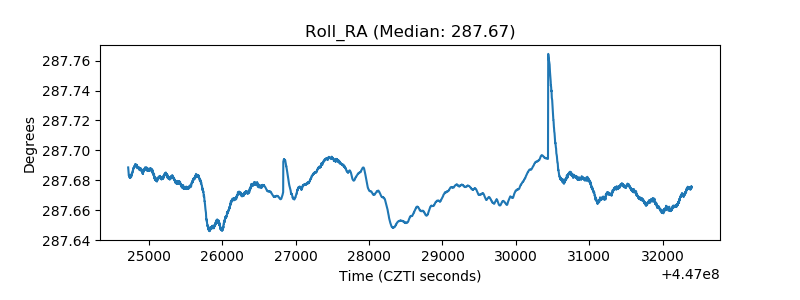 |
| Veto Counter | 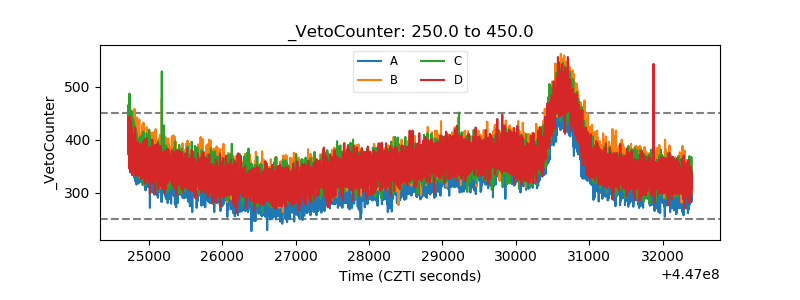 |