| Param | Original file | Final file |
|---|---|---|
| Filename | modeM0/AS1A13_071T04_9000006110_45567cztM0_level2.fits | modeM0/AS1A13_071T04_9000006110_45567cztM0_level2_quad_clean.evt |
| Size (bytes) | 620,496,000 | 130,639,680 |
| Size | 591.8 MB | 124.6 MB |
| Events in quadrant A | 6,781,512 | 896,423 |
| Events in quadrant B | 5,742,239 | 851,851 |
| Events in quadrant C | 3,994,134 | 866,803 |
| Events in quadrant D | 5,809,012 | 764,906 |
| Mode M0 | |||
|---|---|---|---|
| Quadrant | BADHDUFLAG | Total packets | Discarded packets |
| A | 0 | 26038 | 3 |
| B | 0 | 22921 | 1 |
| C | 0 | 17895 | 2 |
| D | 0 | 23140 | 5 |
| Mode SS | |||
|---|---|---|---|
| Quadrant | BADHDUFLAG | Total packets | Discarded packets |
| A | 0 | 166 | 0 |
| B | 0 | 166 | 0 |
| C | 0 | 166 | 0 |
| D | 0 | 166 | 0 |
| Quadrant | Total seconds | Saturated seconds | Saturation percentage |
|---|---|---|---|
| A | 8278 | 136 | 1.642909% |
| B | 8280 | 783 | 9.456522% |
| C | 8280 | 100 | 1.207729% |
| D | 8280 | 410 | 4.951691% |
Noise dominated data is calculated using 1-second bins in cleaned event files. If a bin has >2000 counts, and if more than 50% of those come from <1% of pixels, then it is considered to be noise-dominated and hence unusable.
| Quadrant | # 1 sec bins | Bins with >0 counts | Bins with >2000 counts | High rate bins dominated by noise | Noise dominated (total time) | Noise dominated (detector-on time) | Marked lightcurve |
|---|---|---|---|---|---|---|---|
| A | 8295 | 8281 | 1 | 1 | 0.01% | 0.01% | 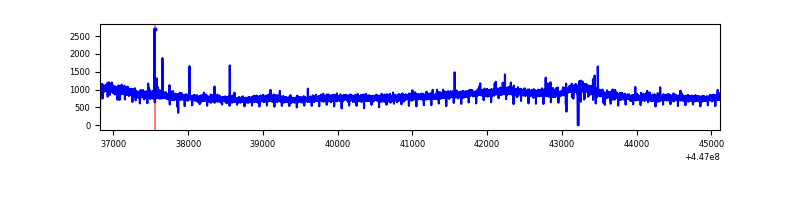 |
| B | 8295 | 8281 | 374 | 374 | 4.51% | 4.52% | 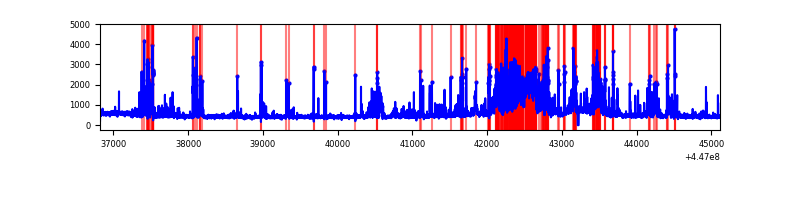 |
| C | 8296 | 8282 | 33 | 33 | 0.40% | 0.40% | 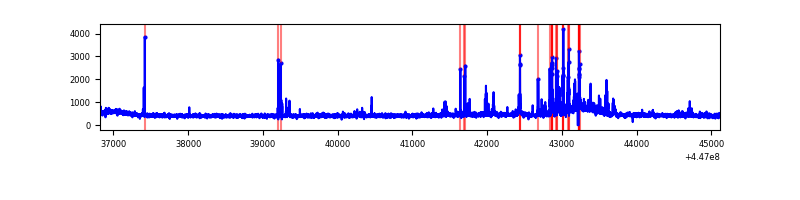 |
| D | 8296 | 8282 | 236 | 236 | 2.84% | 2.85% | 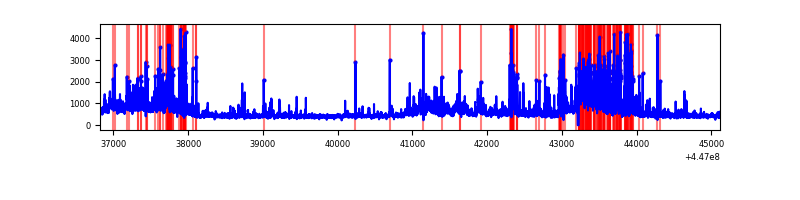 |
Top three noisy pixels from each quadrant. If the there are fewer than three noisy pixels in the level2.evt file, extra rows are filled as -1
| Pixel properties | Quadrant properties | ||||||
|---|---|---|---|---|---|---|---|
| Quadrant | DetID | PixID | Counts | Sigma | Mean | Median | Sigma |
| A | 10 | 83 | 3119350 | 16160.57 | 929 | 909 | 193.0 |
| A | 10 | 248 | 23877 | 119.03 | 929 | 909 | 193.0 |
| A | 13 | 6 | 14209 | 68.92 | 929 | 909 | 193.0 |
| B | 15 | 201 | 943480 | 5261.75 | 905 | 874 | 179.1 |
| B | 4 | 171 | 418110 | 2329.07 | 905 | 874 | 179.1 |
| B | 3 | 112 | 220774 | 1227.51 | 905 | 874 | 179.1 |
| C | 12 | 2 | 335158 | 1538.07 | 916 | 919 | 217.3 |
| C | 14 | 254 | 41504 | 186.76 | 916 | 919 | 217.3 |
| C | 12 | 249 | 24574 | 108.85 | 916 | 919 | 217.3 |
| D | 1 | 52 | 968310 | 4313.63 | 897 | 870 | 224.3 |
| D | 5 | 171 | 466963 | 2078.22 | 897 | 870 | 224.3 |
| D | 3 | 13 | 218553 | 970.61 | 897 | 870 | 224.3 |
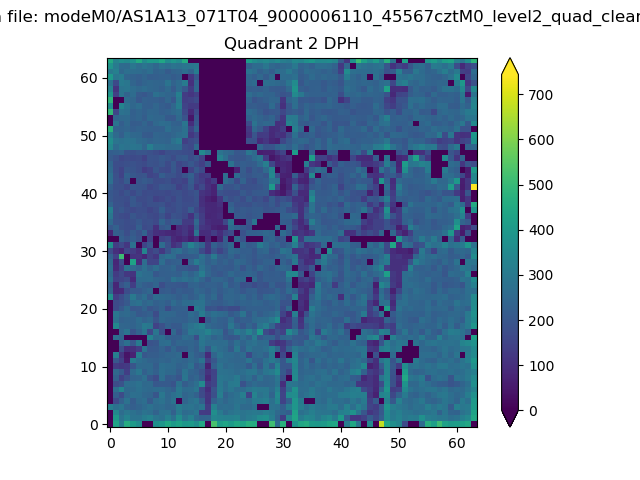
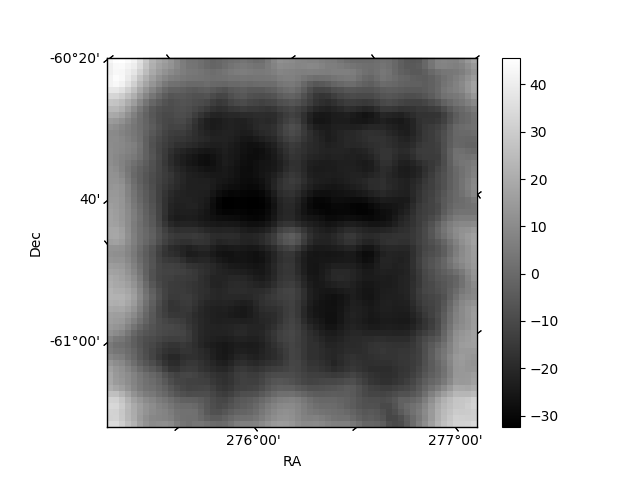
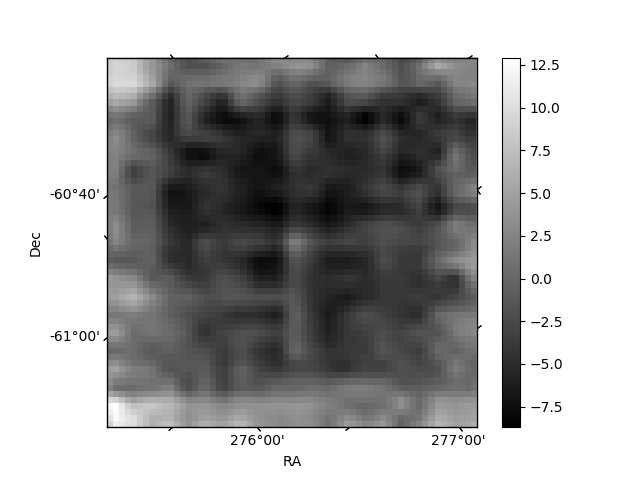
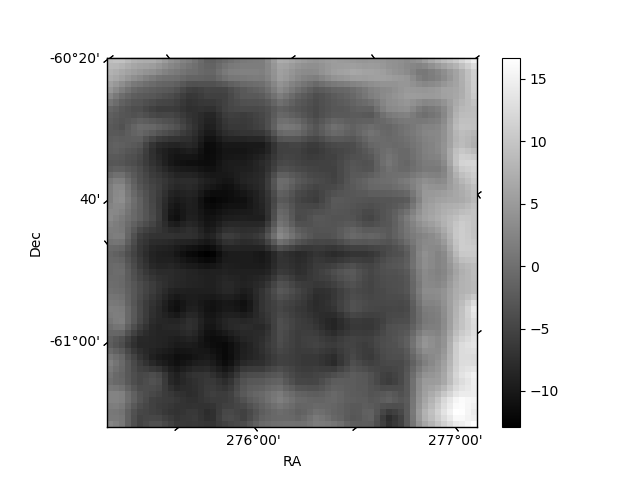
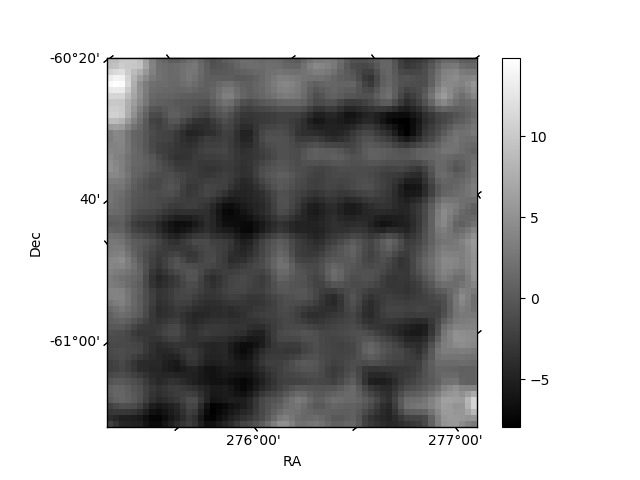
Histogram calculated using DETX and DETY for each event in the final _common_clean file
| Quadrant A | 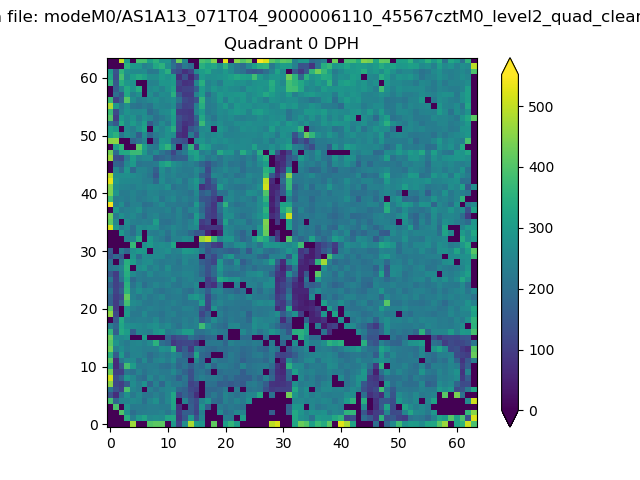 |
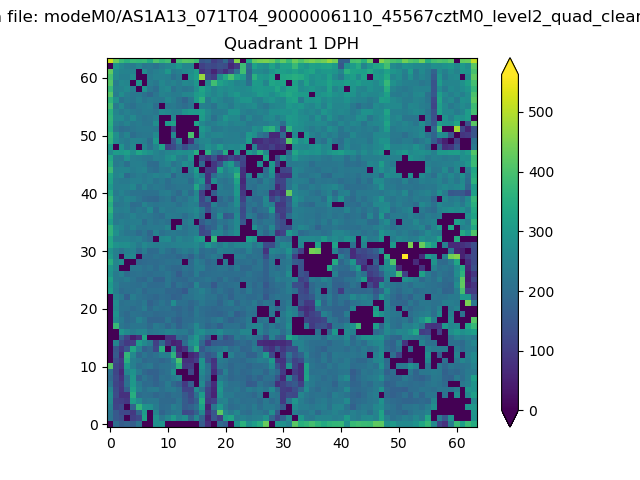 |
Quadrant B |
|---|---|---|---|
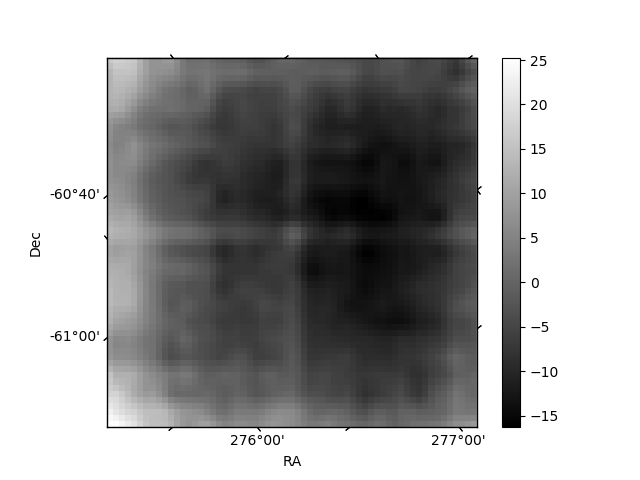
| Quadrant D | 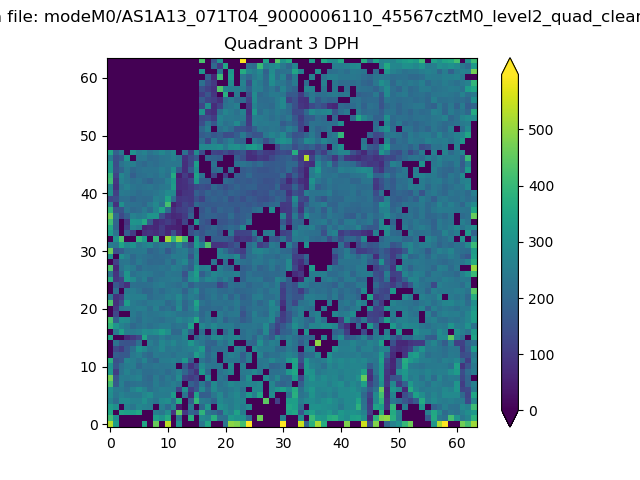 |
 |
Quadrant C |
| Plot type | Count rate plots | Images |
|---|---|---|
| Comparison with Poisson distribution Blue bars denote a histogram of data divided into 1 sec bins. Red curve is a Poisson curve with rate = median count rate of data. |
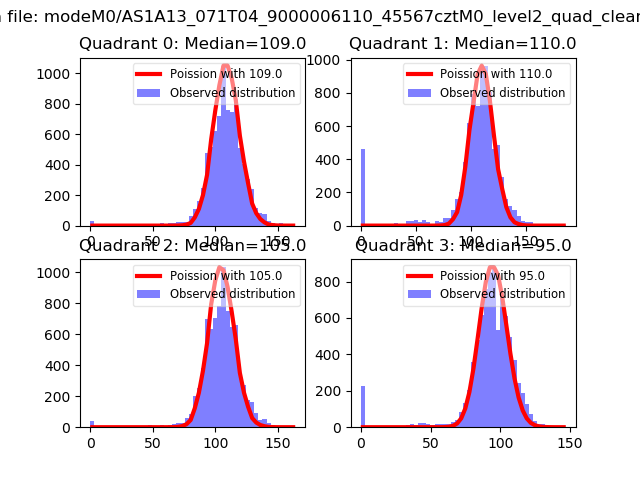 |
 |
| Quadrant-wise count rates Data is divided into 100 sec bins |
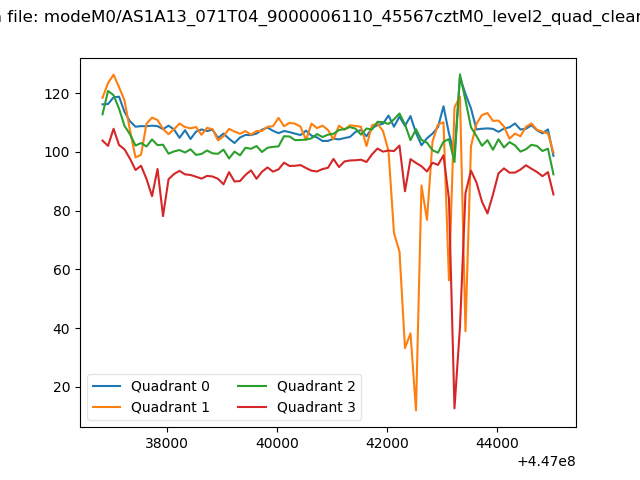 |
|
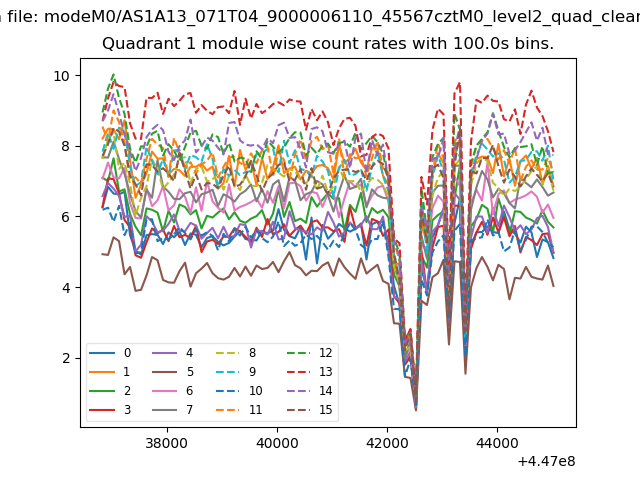
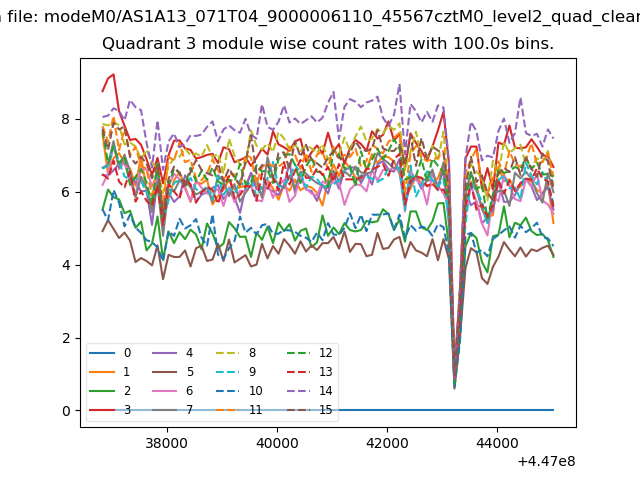
| Module-wise count rates for Quadrant A Data is divided into 100 sec bins |
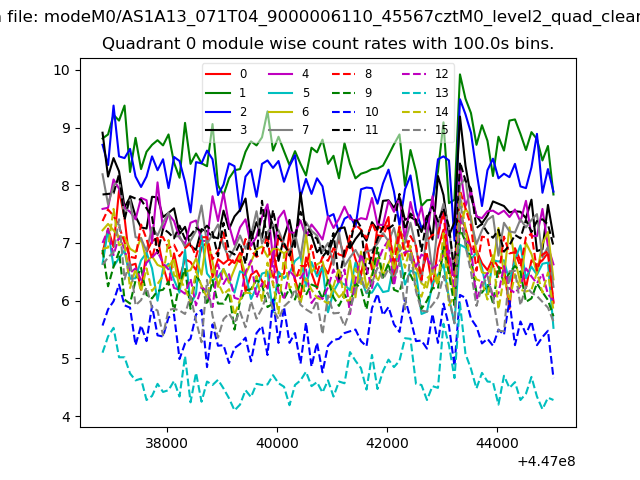 |
 |
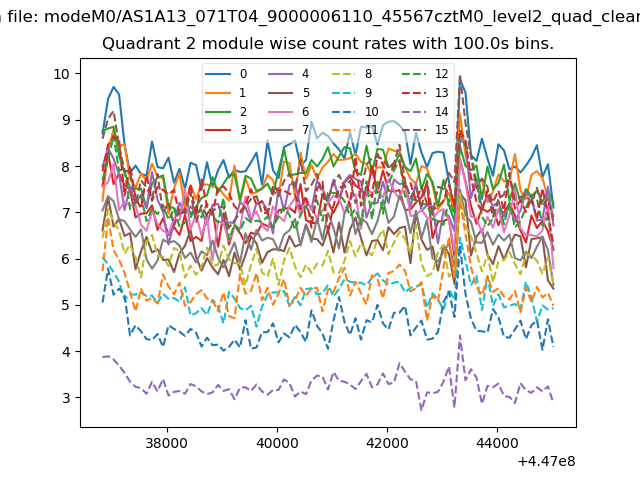
| Module-wise count rates for Quadrant B Data is divided into 100 sec bins |
 |
 |
| Module-wise count rates for Quadrant C Data is divided into 100 sec bins |
 |
 |
| Module-wise count rates for Quadrant D Data is divided into 100 sec bins |
 |
 |
| Parameter | Plot |
|---|---|
| CZT HV Monitor | 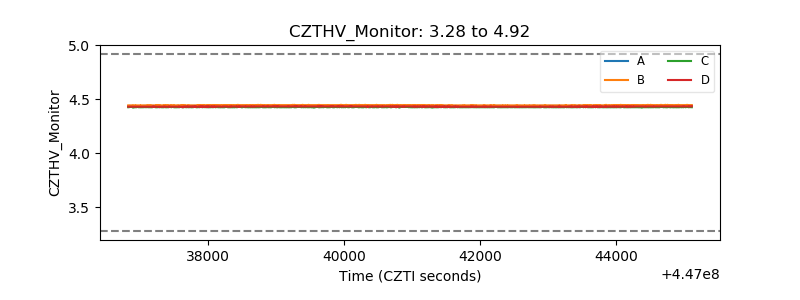 |
| D_VDD | 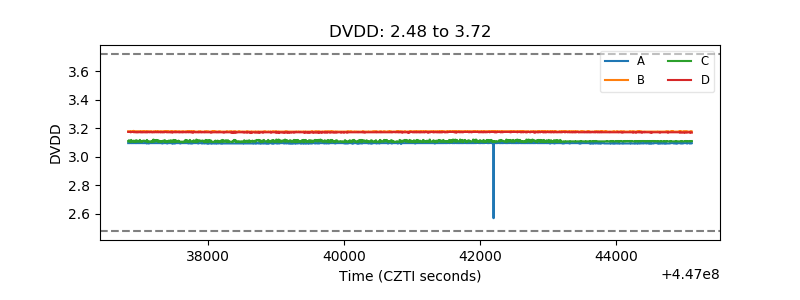 |
| Temperature 1 | 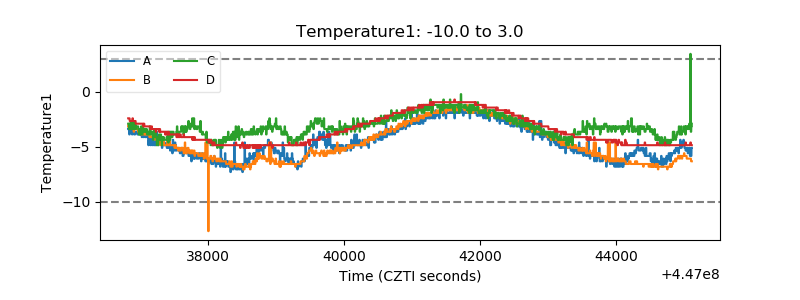 |
| Veto HV Monitor |  |
| Veto LLD | 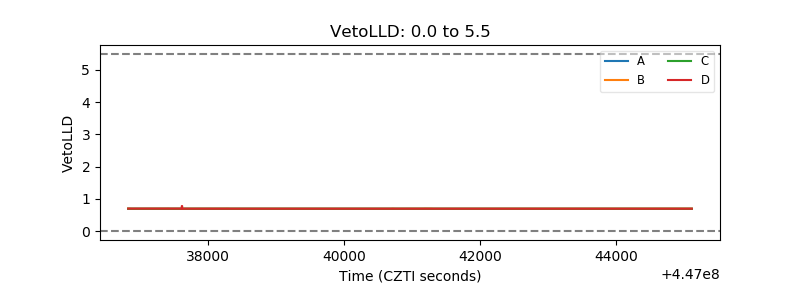 |
| Alpha Counter | 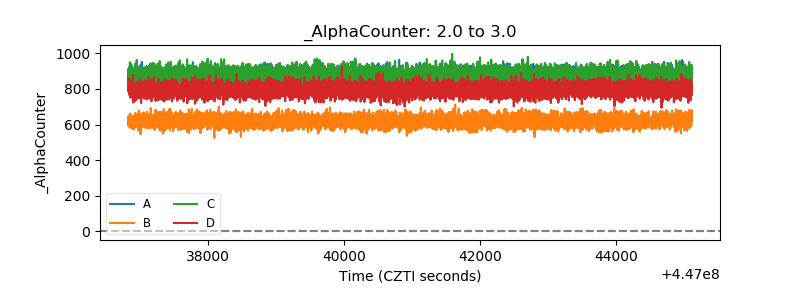 |
| _CPM_Rate | 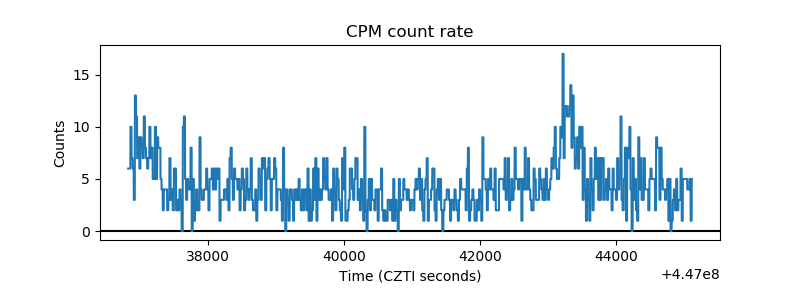 |
| CZT Counter | 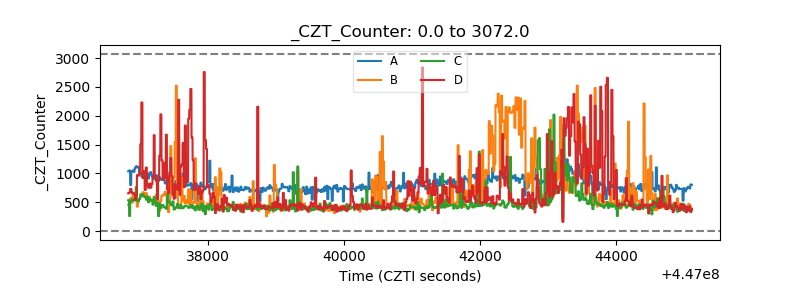 |
| +2.5 Volts monitor | 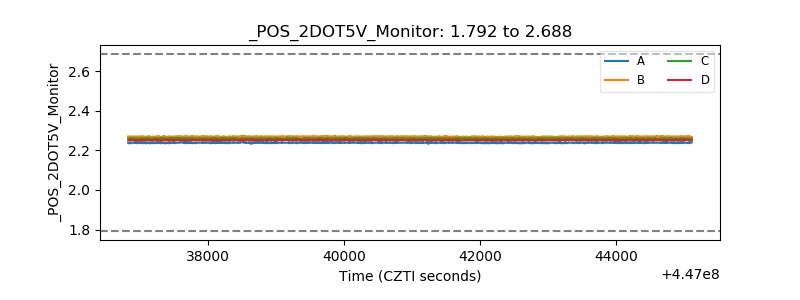 |
| +5 Volts monitor | 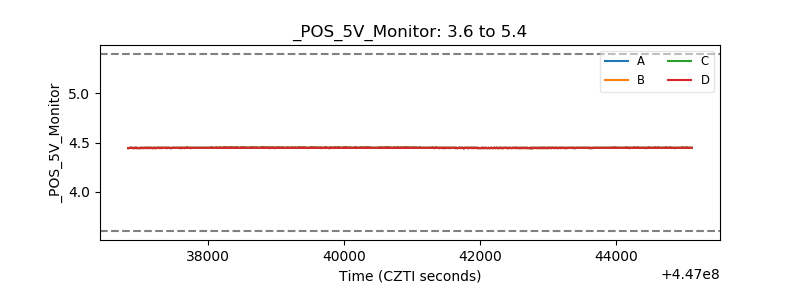 |
| _ROLL_ROT | 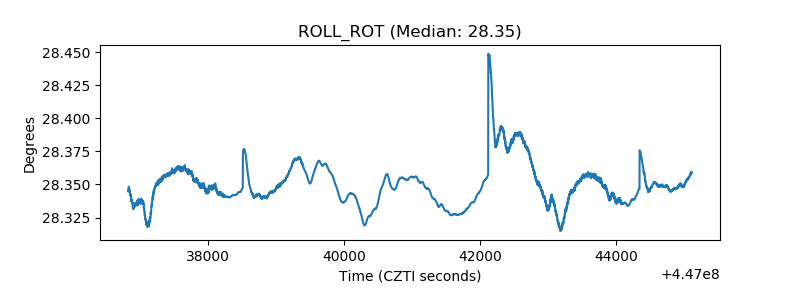 |
| _Roll_DEC | 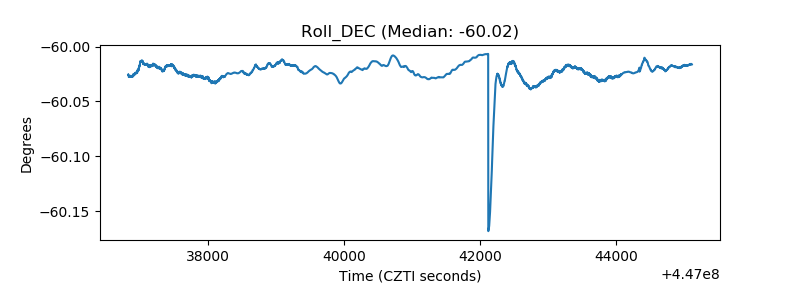 |
| _Roll_RA | 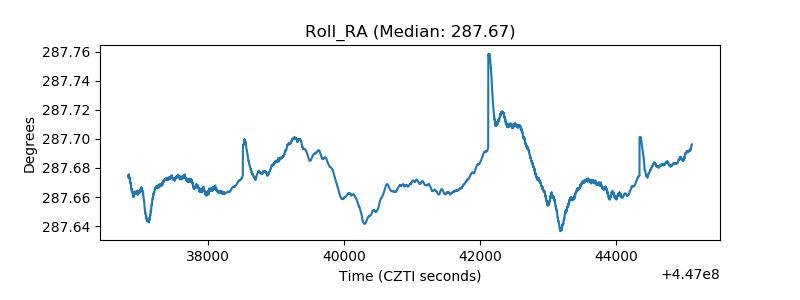 |
| Veto Counter | 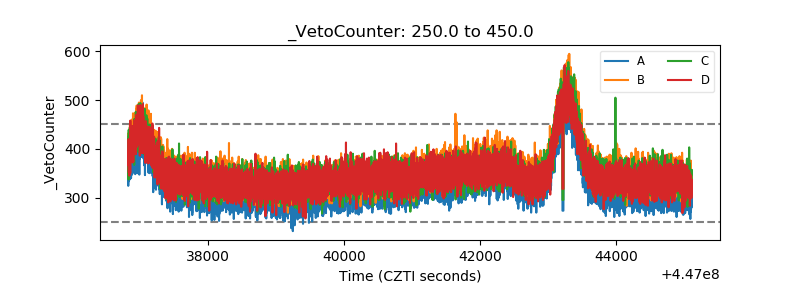 |