| Param | Original file | Final file |
|---|---|---|
| Filename | modeM0/AS1A13_071T04_9000006110_45571cztM0_level2.fits | modeM0/AS1A13_071T04_9000006110_45571cztM0_level2_quad_clean.evt |
| Size (bytes) | 1,768,916,160 | 384,422,400 |
| Size | 1.6 GB | 366.6 MB |
| Events in quadrant A | 20,152,448 | 2,581,082 |
| Events in quadrant B | 13,402,217 | 2,610,898 |
| Events in quadrant C | 12,684,335 | 2,513,066 |
| Events in quadrant D | 17,365,645 | 2,263,550 |
| Mode M9 | |||
|---|---|---|---|
| Quadrant | BADHDUFLAG | Total packets | Discarded packets |
| A | 0 | 27 | 0 |
| B | 0 | 27 | 0 |
| C | 0 | 27 | 0 |
| D | 0 | 27 | 0 |
| Mode M0 | |||
|---|---|---|---|
| Quadrant | BADHDUFLAG | Total packets | Discarded packets |
| A | 0 | 75945 | 4 |
| B | 0 | 56873 | 14 |
| C | 0 | 55321 | 4 |
| D | 0 | 68024 | 4 |
| Mode SS | |||
|---|---|---|---|
| Quadrant | BADHDUFLAG | Total packets | Discarded packets |
| A | 0 | 492 | 0 |
| B | 0 | 492 | 0 |
| C | 0 | 492 | 0 |
| D | 0 | 492 | 0 |
| Quadrant | Total seconds | Saturated seconds | Saturation percentage |
|---|---|---|---|
| A | 24281 | 467 | 1.923315% |
| B | 24278 | 960 | 3.954197% |
| C | 24281 | 660 | 2.718175% |
| D | 24281 | 1313 | 5.407520% |
Noise dominated data is calculated using 1-second bins in cleaned event files. If a bin has >2000 counts, and if more than 50% of those come from <1% of pixels, then it is considered to be noise-dominated and hence unusable.
| Quadrant | # 1 sec bins | Bins with >0 counts | Bins with >2000 counts | High rate bins dominated by noise | Noise dominated (total time) | Noise dominated (detector-on time) | Marked lightcurve |
|---|---|---|---|---|---|---|---|
| A | 26946 | 24285 | 24 | 24 | 0.09% | 0.10% | 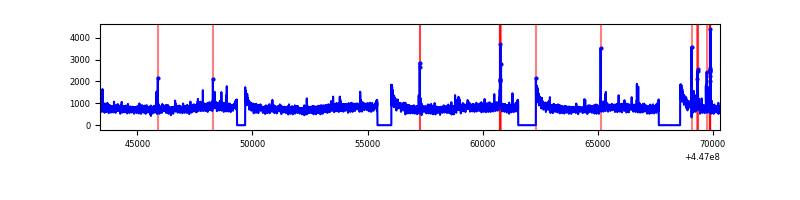 |
| B | 26946 | 24283 | 481 | 481 | 1.79% | 1.98% | 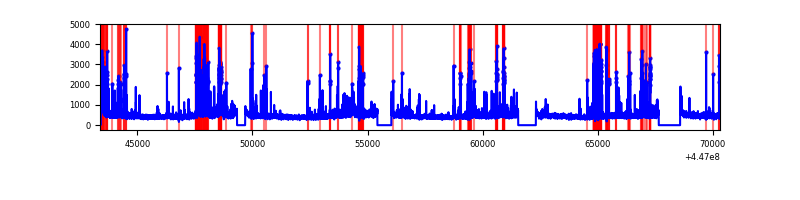 |
| C | 26946 | 24285 | 419 | 419 | 1.55% | 1.73% | 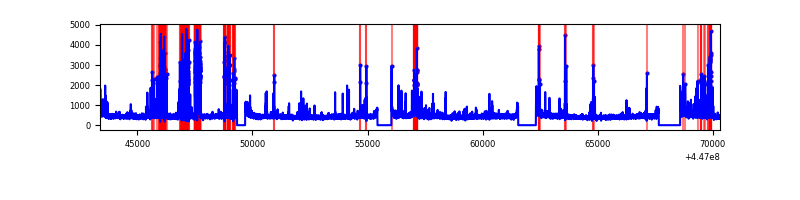 |
| D | 26946 | 24285 | 885 | 885 | 3.28% | 3.64% | 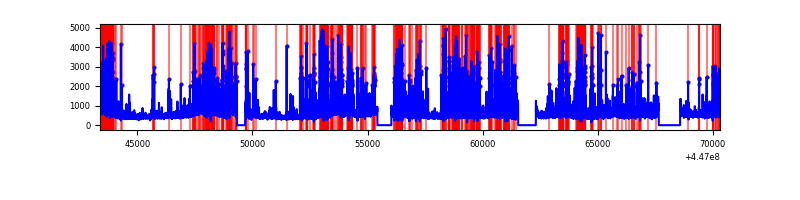 |
Top three noisy pixels from each quadrant. If the there are fewer than three noisy pixels in the level2.evt file, extra rows are filled as -1
| Pixel properties | Quadrant properties | ||||||
|---|---|---|---|---|---|---|---|
| Quadrant | DetID | PixID | Counts | Sigma | Mean | Median | Sigma |
| A | 10 | 83 | 9493457 | 17209.56 | 2684 | 2622 | 551.5 |
| A | 10 | 248 | 200519 | 358.84 | 2684 | 2622 | 551.5 |
| A | 0 | 243 | 50625 | 87.04 | 2684 | 2622 | 551.5 |
| B | 5 | 172 | 1147808 | 2217.93 | 2647 | 2565 | 516.4 |
| B | 15 | 201 | 787003 | 1519.18 | 2647 | 2565 | 516.4 |
| B | 4 | 171 | 190600 | 364.16 | 2647 | 2565 | 516.4 |
| C | 12 | 2 | 2120234 | 3456.99 | 2624 | 2640 | 612.6 |
| C | 14 | 254 | 261733 | 422.97 | 2624 | 2640 | 612.6 |
| C | 5 | 4 | 43536 | 66.76 | 2624 | 2640 | 612.6 |
| D | 1 | 52 | 4812662 | 7270.91 | 2611 | 2530 | 661.6 |
| D | 11 | 241 | 747604 | 1126.24 | 2611 | 2530 | 661.6 |
| D | 5 | 171 | 738670 | 1112.74 | 2611 | 2530 | 661.6 |
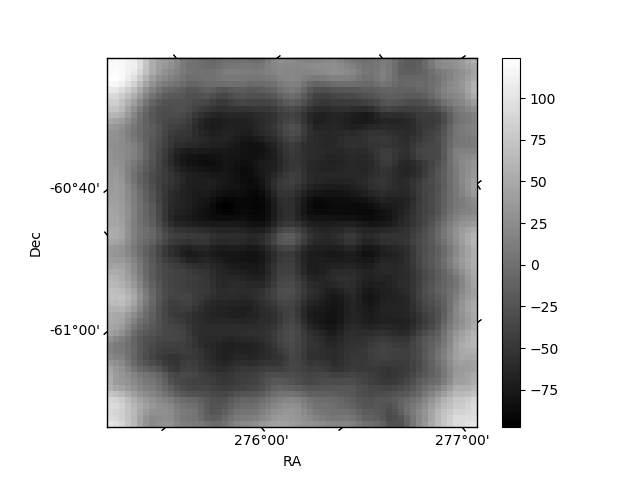
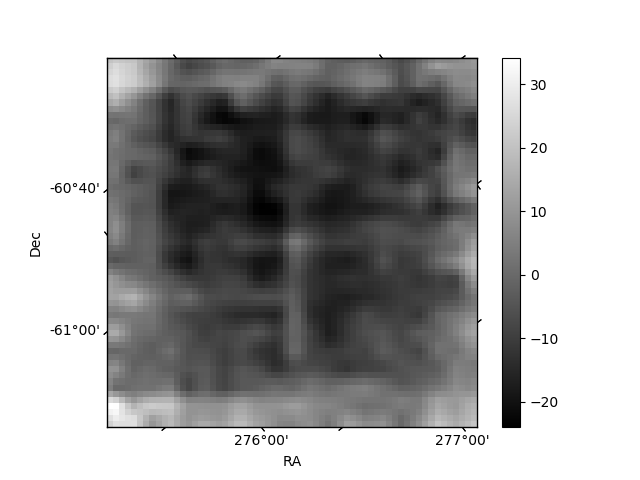
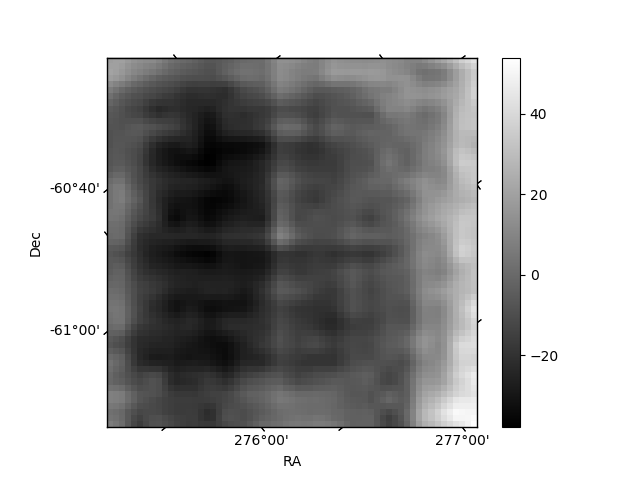
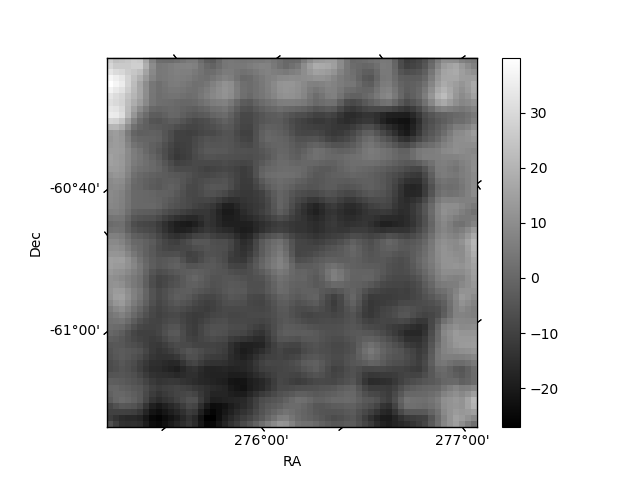
Histogram calculated using DETX and DETY for each event in the final _common_clean file
| Quadrant A | 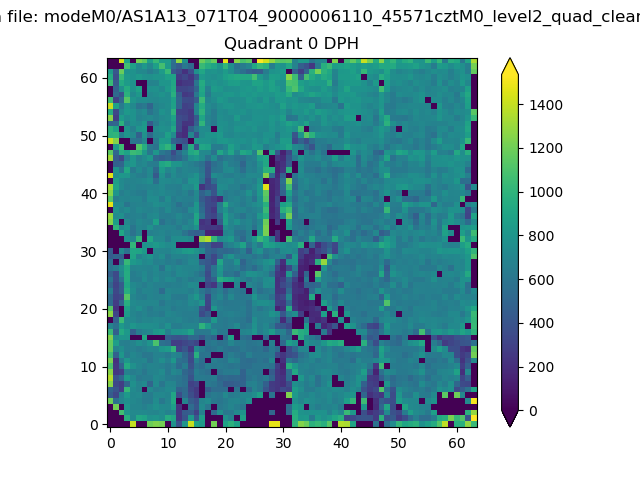 |
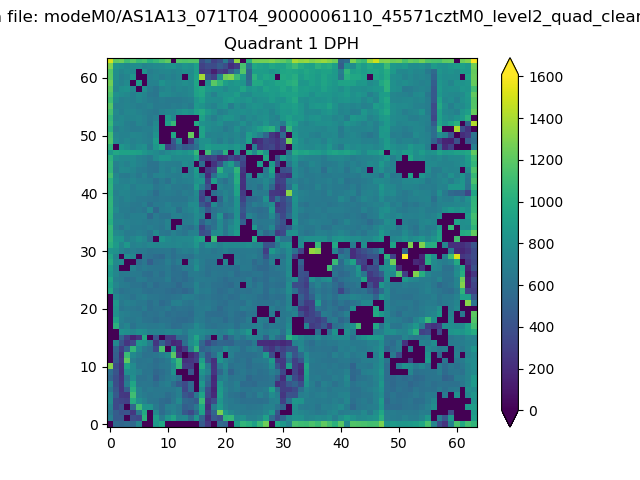 |
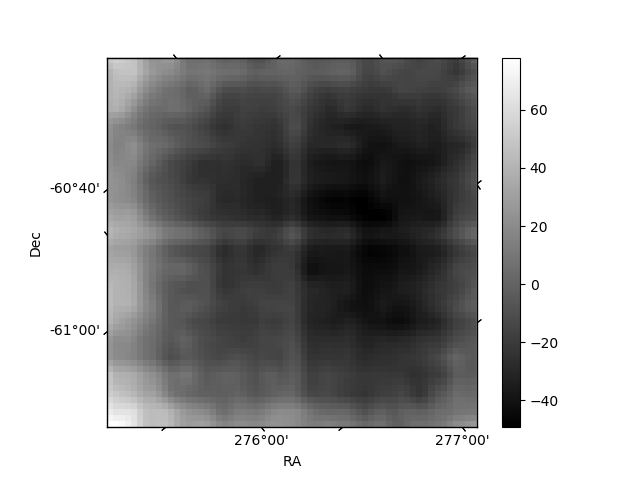
Quadrant B |
|---|---|---|---|
| Quadrant D | 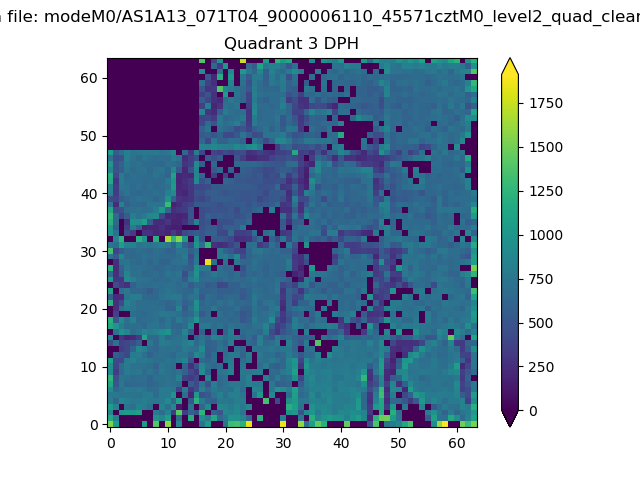 |
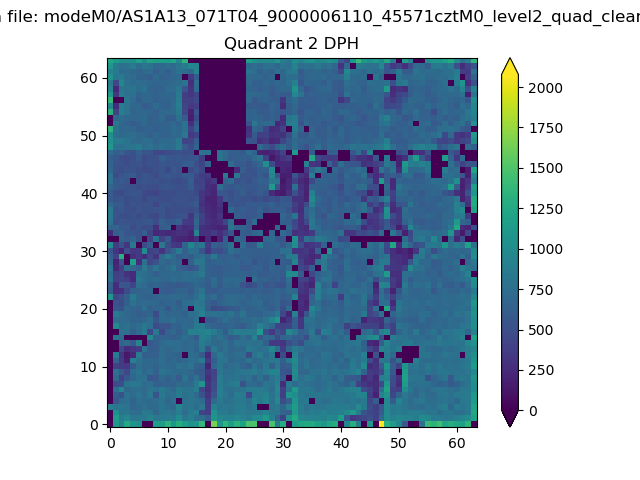 |
Quadrant C |
| Plot type | Count rate plots | Images |
|---|---|---|
| Comparison with Poisson distribution Blue bars denote a histogram of data divided into 1 sec bins. Red curve is a Poisson curve with rate = median count rate of data. |
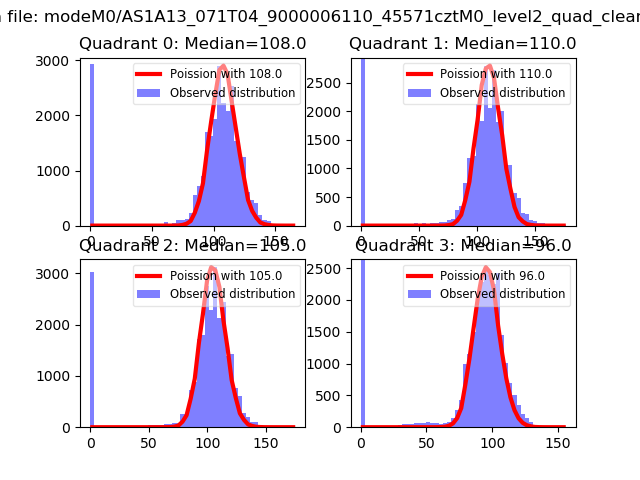 |
 |
| Quadrant-wise count rates Data is divided into 100 sec bins |
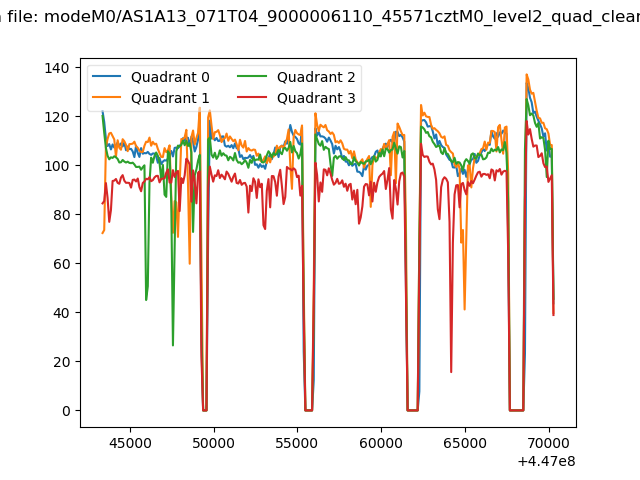 |
|
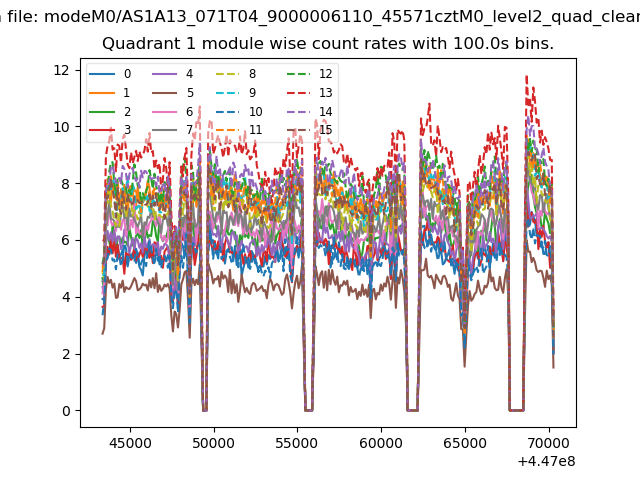
| Module-wise count rates for Quadrant A Data is divided into 100 sec bins |
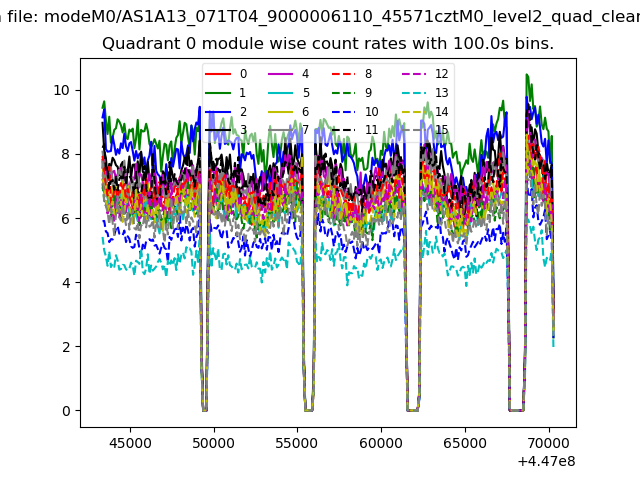 |
 |
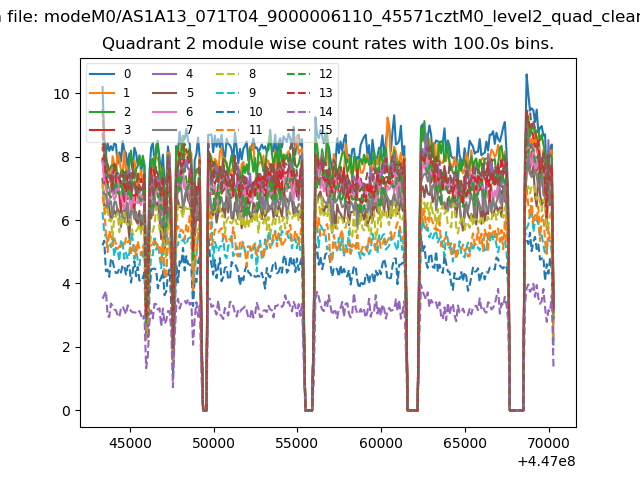
| Module-wise count rates for Quadrant B Data is divided into 100 sec bins |
 |
 |
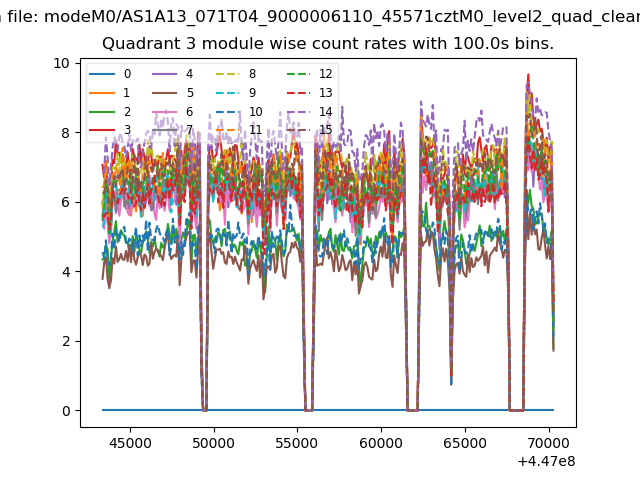
| Module-wise count rates for Quadrant C Data is divided into 100 sec bins |
 |
 |
| Module-wise count rates for Quadrant D Data is divided into 100 sec bins |
 |
 |
| Parameter | Plot |
|---|---|
| CZT HV Monitor | 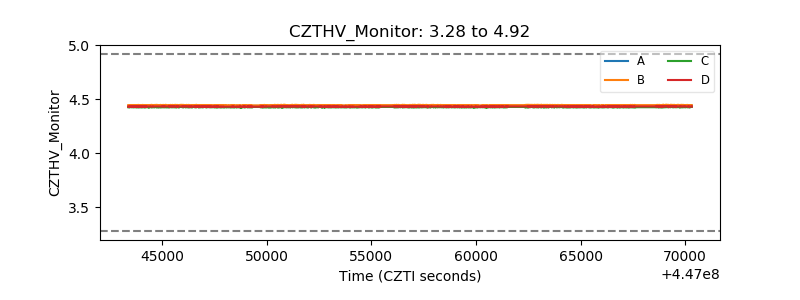 |
| D_VDD | 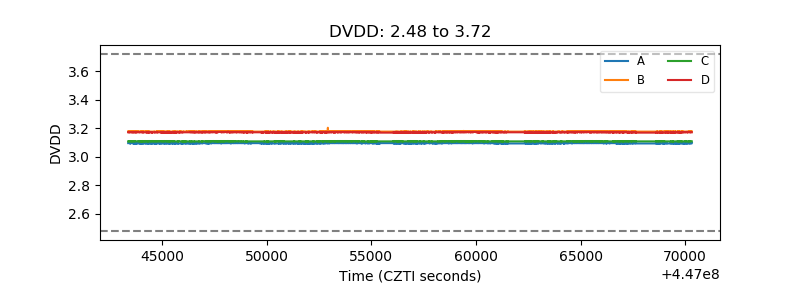 |
| Temperature 1 | 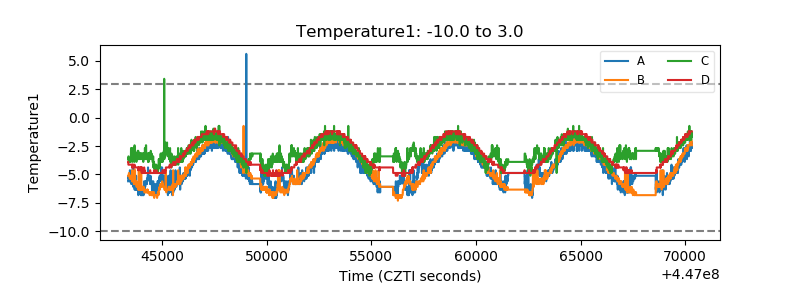 |
| Veto HV Monitor | 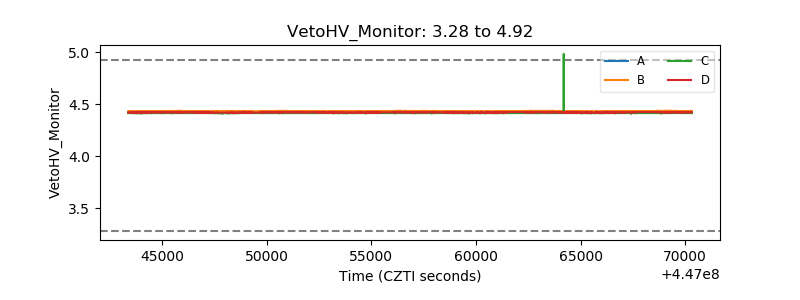 |
| Veto LLD | 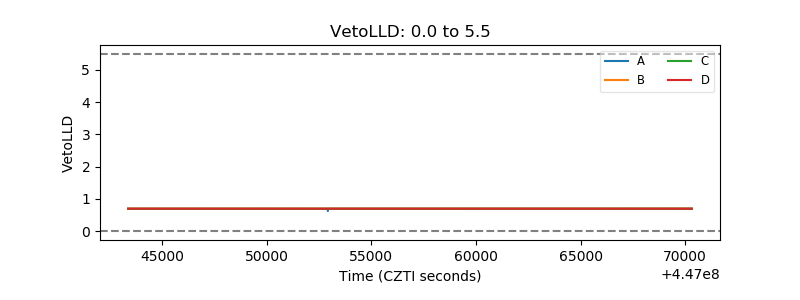 |
| Alpha Counter | 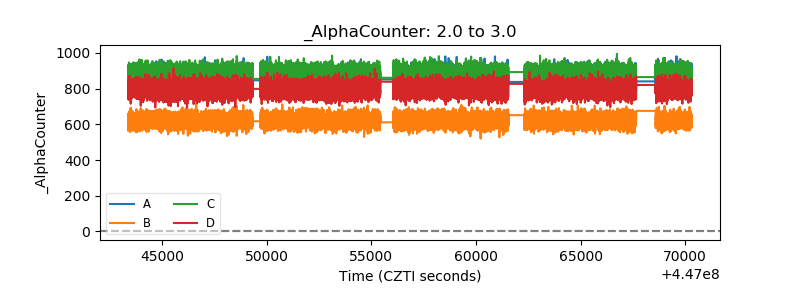 |
| _CPM_Rate | 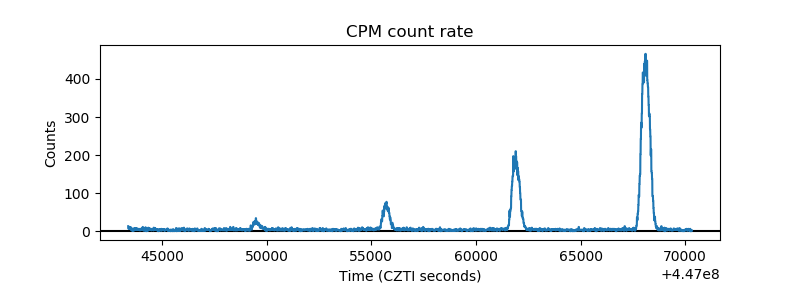 |
| CZT Counter | 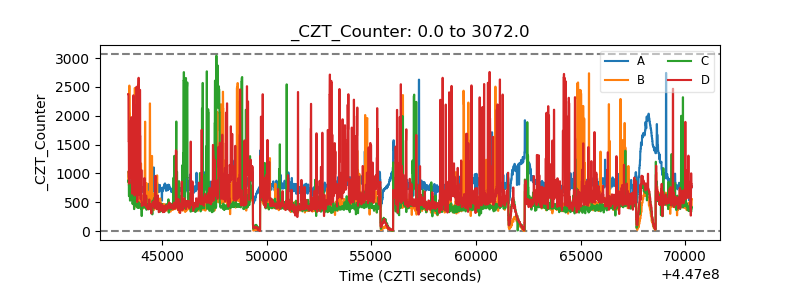 |
| +2.5 Volts monitor | 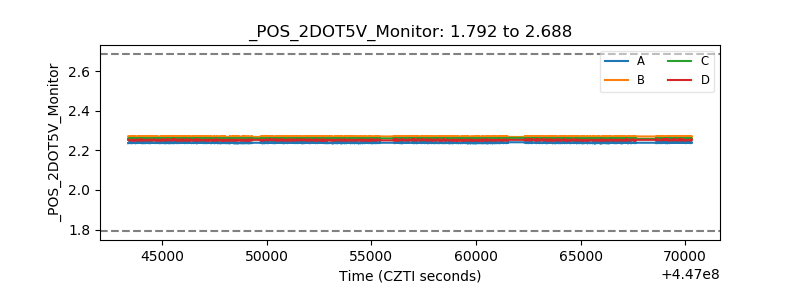 |
| +5 Volts monitor | 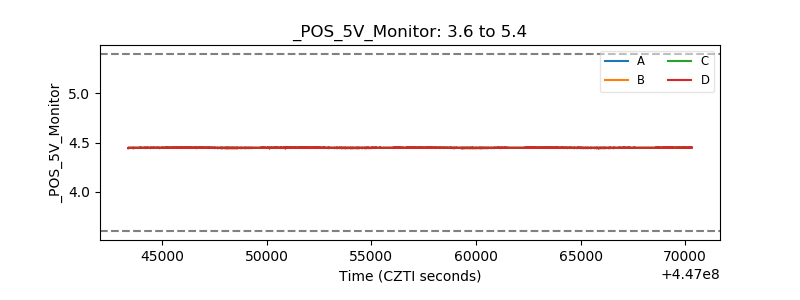 |
| _ROLL_ROT | 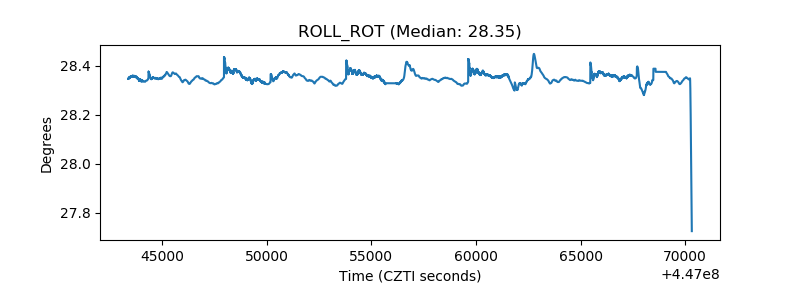 |
| _Roll_DEC | 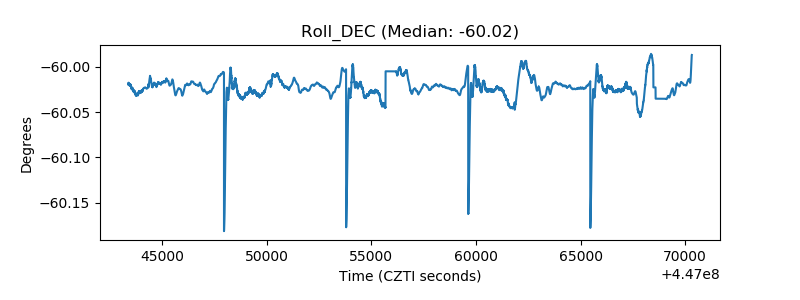 |
| _Roll_RA | 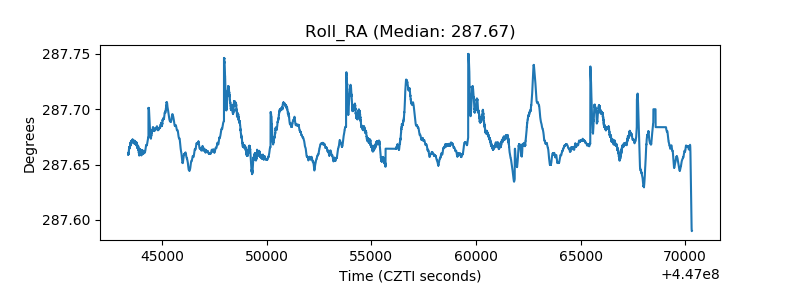 |
| Veto Counter | 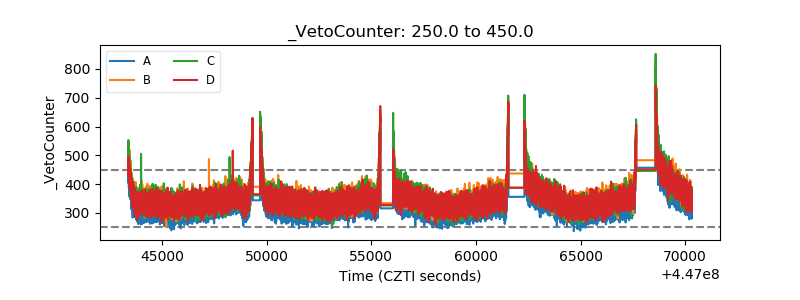 |