| Param | Original file | Final file |
|---|---|---|
| Filename | modeM0/AS1A13_071T04_9000006110_45574cztM0_level2.fits | modeM0/AS1A13_071T04_9000006110_45574cztM0_level2_quad_clean.evt |
| Size (bytes) | 452,332,800 | 102,168,000 |
| Size | 431.4 MB | 97.4 MB |
| Events in quadrant A | 5,156,702 | 688,456 |
| Events in quadrant B | 2,967,099 | 714,387 |
| Events in quadrant C | 3,718,928 | 665,340 |
| Events in quadrant D | 4,441,128 | 611,036 |
| Mode M9 | |||
|---|---|---|---|
| Quadrant | BADHDUFLAG | Total packets | Discarded packets |
| A | 0 | 11 | 0 |
| B | 0 | 11 | 0 |
| C | 0 | 11 | 0 |
| D | 0 | 11 | 0 |
| Mode M0 | |||
|---|---|---|---|
| Quadrant | BADHDUFLAG | Total packets | Discarded packets |
| A | 0 | 18895 | 1 |
| B | 0 | 12736 | 1 |
| C | 0 | 15062 | 9 |
| D | 0 | 17178 | 1 |
| Mode SS | |||
|---|---|---|---|
| Quadrant | BADHDUFLAG | Total packets | Discarded packets |
| A | 0 | 122 | 0 |
| B | 0 | 122 | 0 |
| C | 0 | 122 | 0 |
| D | 0 | 122 | 0 |
| Quadrant | Total seconds | Saturated seconds | Saturation percentage |
|---|---|---|---|
| A | 5930 | 162 | 2.731872% |
| B | 5930 | 74 | 1.247892% |
| C | 5925 | 239 | 4.033755% |
| D | 5930 | 269 | 4.536256% |
Noise dominated data is calculated using 1-second bins in cleaned event files. If a bin has >2000 counts, and if more than 50% of those come from <1% of pixels, then it is considered to be noise-dominated and hence unusable.
| Quadrant | # 1 sec bins | Bins with >0 counts | Bins with >2000 counts | High rate bins dominated by noise | Noise dominated (total time) | Noise dominated (detector-on time) | Marked lightcurve |
|---|---|---|---|---|---|---|---|
| A | 7075 | 5931 | 6 | 6 | 0.08% | 0.10% | 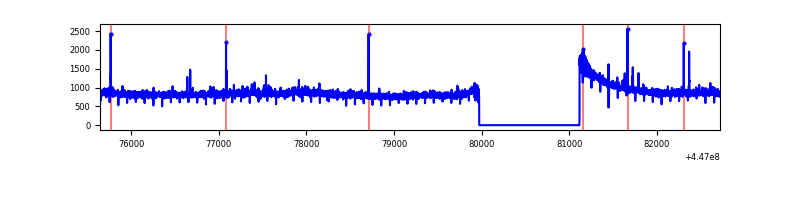 |
| B | 7075 | 5931 | 8 | 8 | 0.11% | 0.13% | 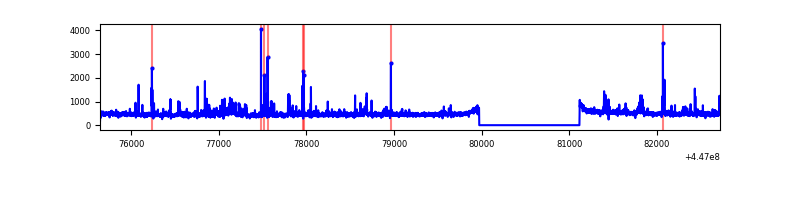 |
| C | 7074 | 5927 | 195 | 195 | 2.76% | 3.29% | 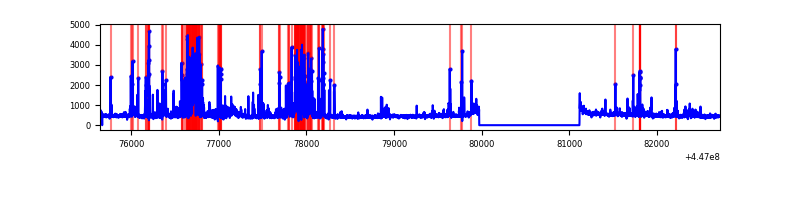 |
| D | 7075 | 5931 | 188 | 188 | 2.66% | 3.17% | 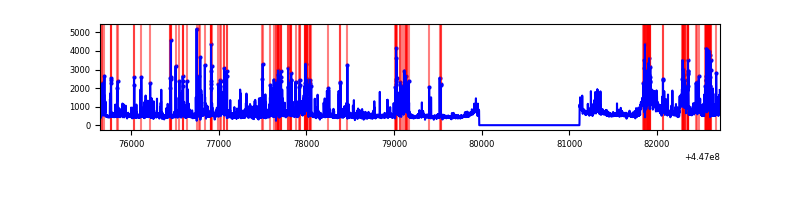 |
Top three noisy pixels from each quadrant. If the there are fewer than three noisy pixels in the level2.evt file, extra rows are filled as -1
| Pixel properties | Quadrant properties | ||||||
|---|---|---|---|---|---|---|---|
| Quadrant | DetID | PixID | Counts | Sigma | Mean | Median | Sigma |
| A | 10 | 83 | 2424340 | 17220.04 | 686 | 672 | 140.7 |
| A | 0 | 243 | 22467 | 154.85 | 686 | 672 | 140.7 |
| A | 10 | 248 | 19172 | 131.44 | 686 | 672 | 140.7 |
| B | 4 | 171 | 70010 | 527.42 | 682 | 663 | 131.5 |
| B | 5 | 172 | 53393 | 401.04 | 682 | 663 | 131.5 |
| B | 10 | 3 | 33292 | 248.16 | 682 | 663 | 131.5 |
| C | 12 | 2 | 1091531 | 7099.32 | 660 | 664 | 153.7 |
| C | 14 | 254 | 38870 | 248.64 | 660 | 664 | 153.7 |
| C | 2 | 14 | 11664 | 71.59 | 660 | 664 | 153.7 |
| D | 1 | 52 | 877492 | 5198.31 | 668 | 646 | 168.7 |
| D | 11 | 241 | 262096 | 1549.99 | 668 | 646 | 168.7 |
| D | 2 | 249 | 197341 | 1166.09 | 668 | 646 | 168.7 |
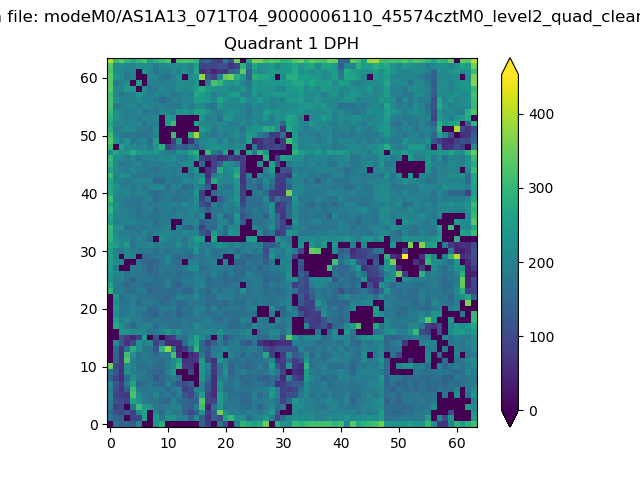
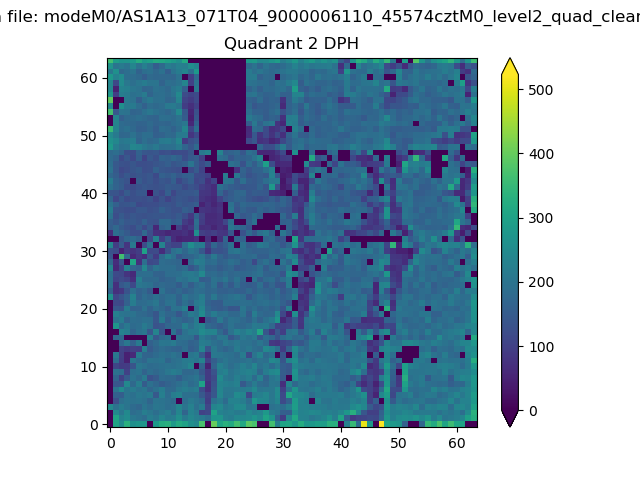
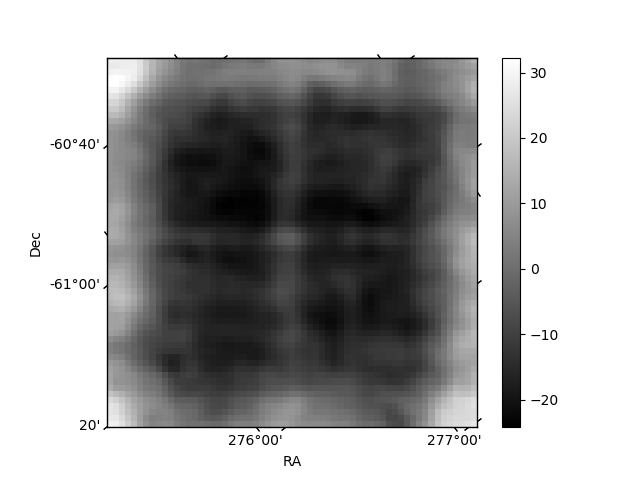
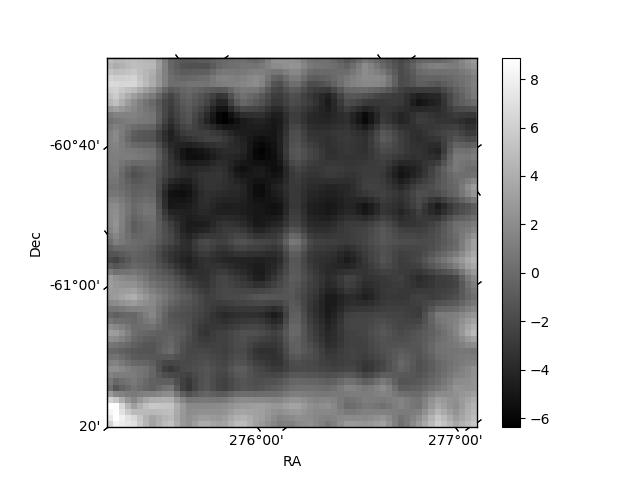
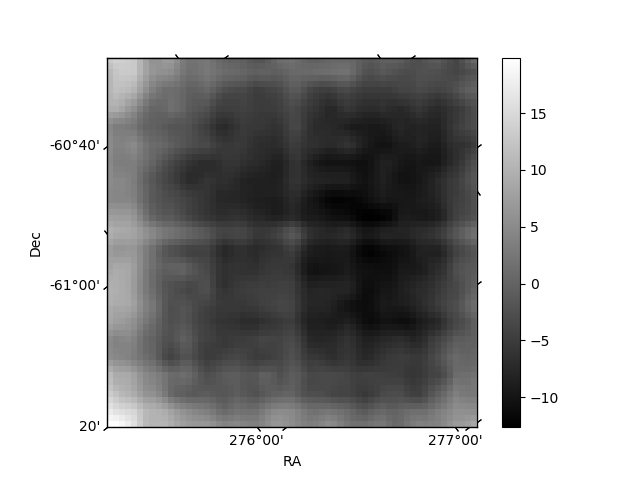
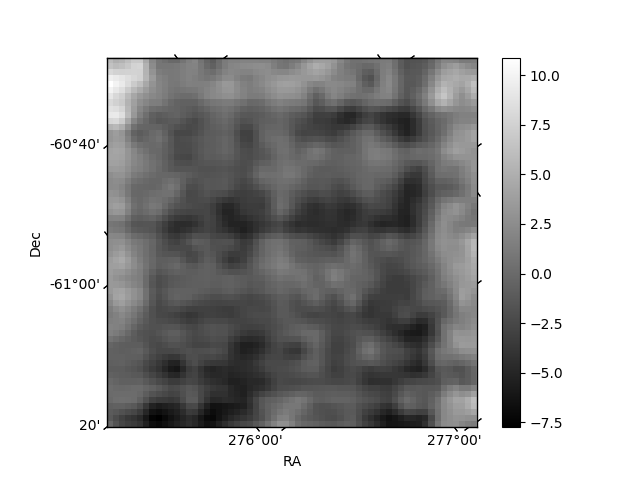
Histogram calculated using DETX and DETY for each event in the final _common_clean file
| Quadrant A | 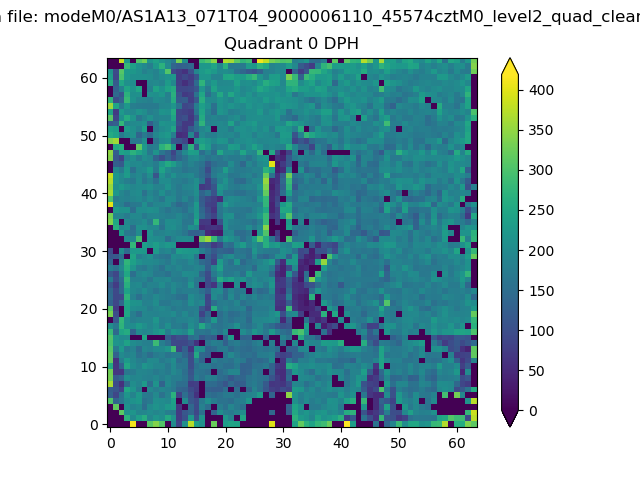 |
 |
Quadrant B |
|---|---|---|---|
| Quadrant D | 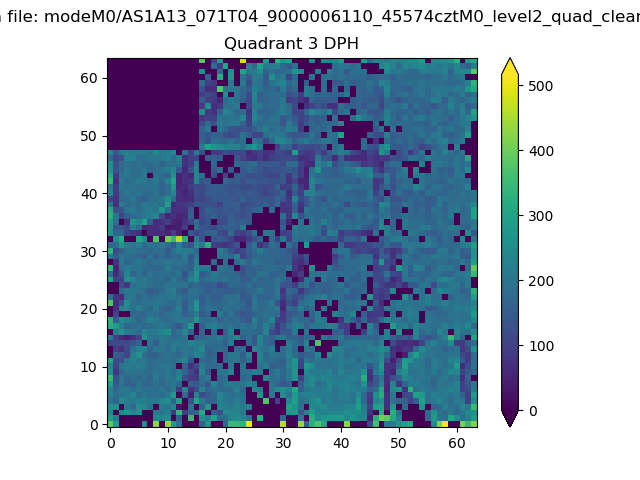 |
 |
Quadrant C |
| Plot type | Count rate plots | Images |
|---|---|---|
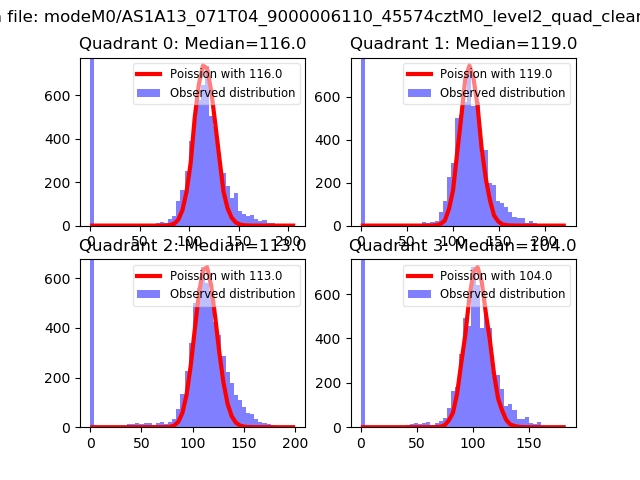
| Comparison with Poisson distribution Blue bars denote a histogram of data divided into 1 sec bins. Red curve is a Poisson curve with rate = median count rate of data. |
 |
 |
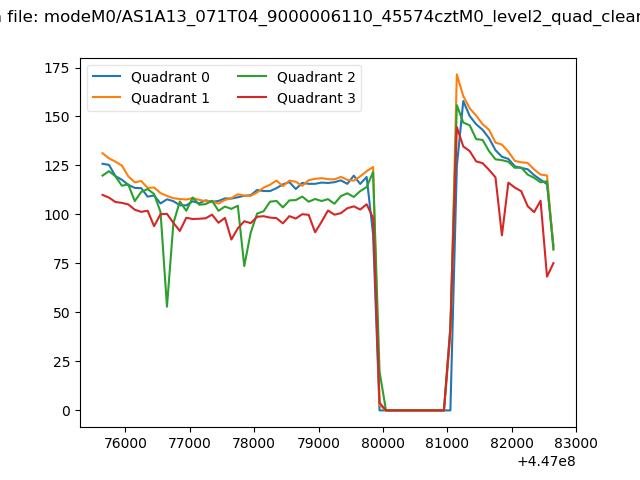
| Quadrant-wise count rates Data is divided into 100 sec bins |
 |
|
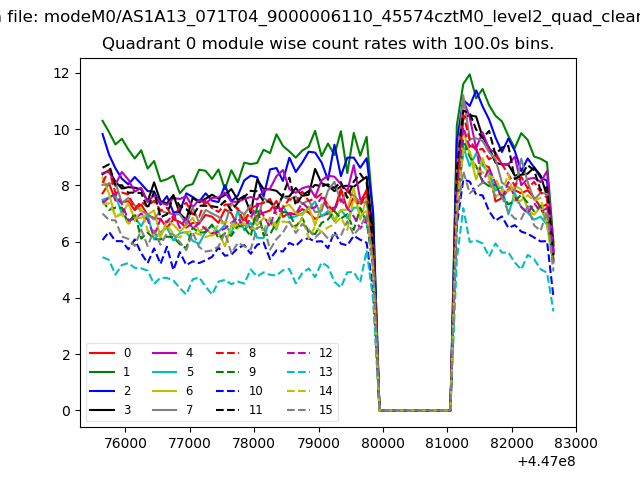
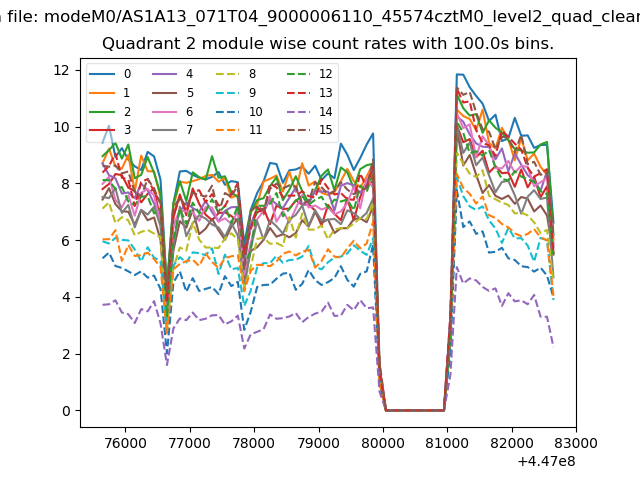
| Module-wise count rates for Quadrant A Data is divided into 100 sec bins |
 |
 |
| Module-wise count rates for Quadrant B Data is divided into 100 sec bins |
 |
 |
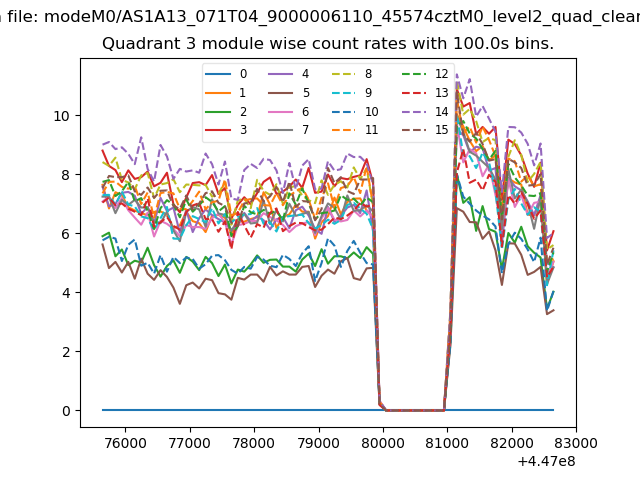
| Module-wise count rates for Quadrant C Data is divided into 100 sec bins |
 |
 |
| Module-wise count rates for Quadrant D Data is divided into 100 sec bins |
 |
 |
| Parameter | Plot |
|---|---|
| CZT HV Monitor |  |
| D_VDD | 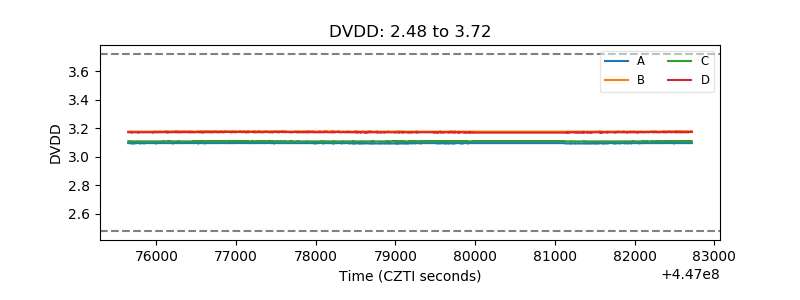 |
| Temperature 1 | 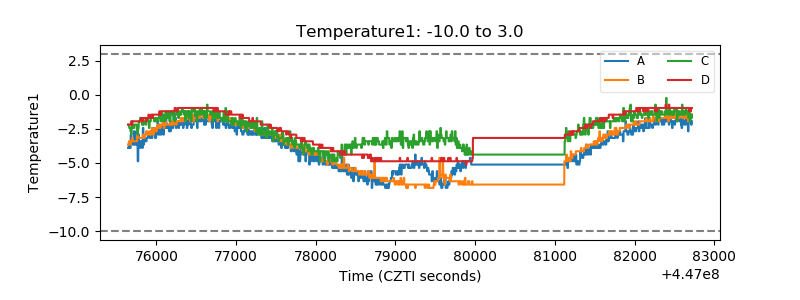 |
| Veto HV Monitor | 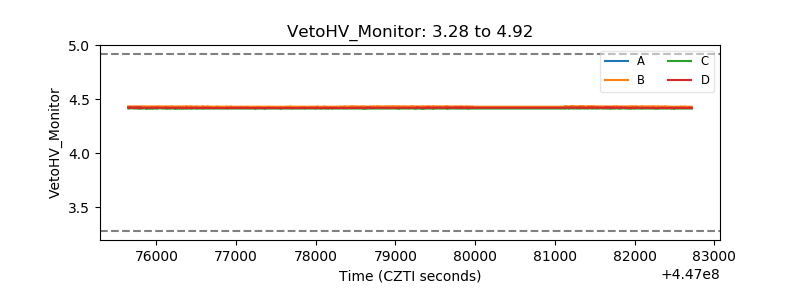 |
| Veto LLD | 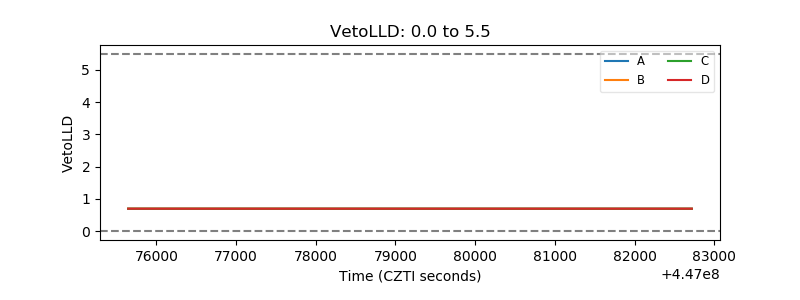 |
| Alpha Counter | 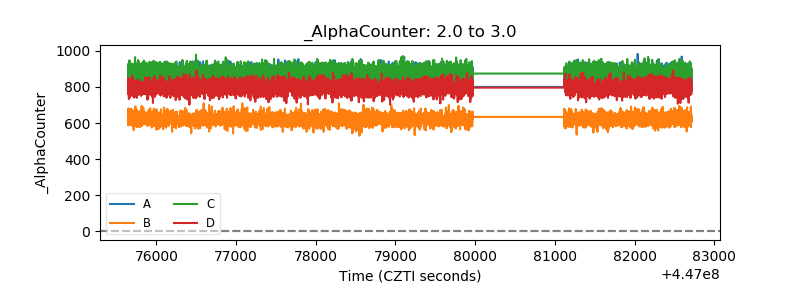 |
| _CPM_Rate | 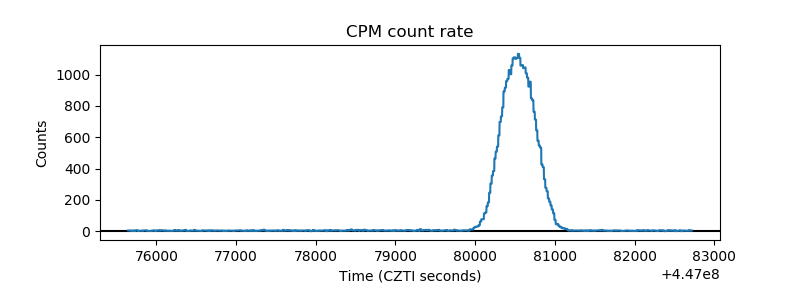 |
| CZT Counter | 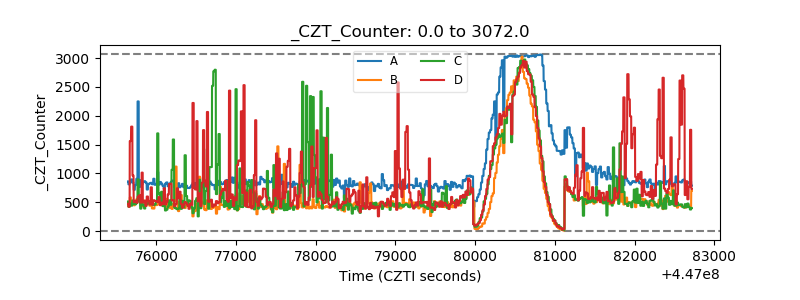 |
| +2.5 Volts monitor | 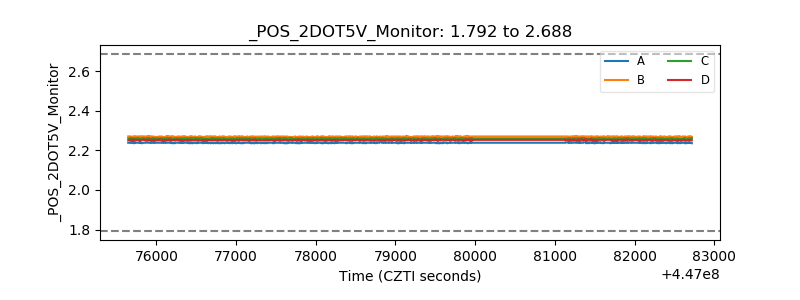 |
| +5 Volts monitor | 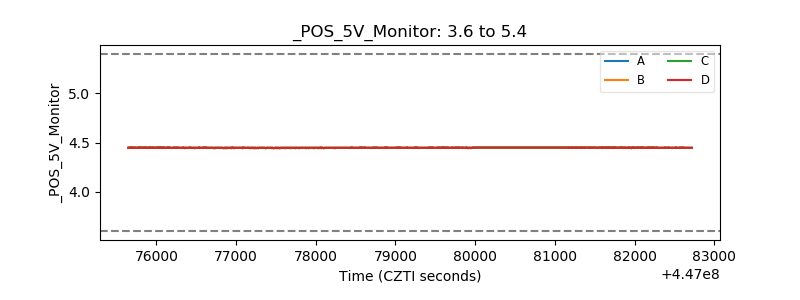 |
| _ROLL_ROT | 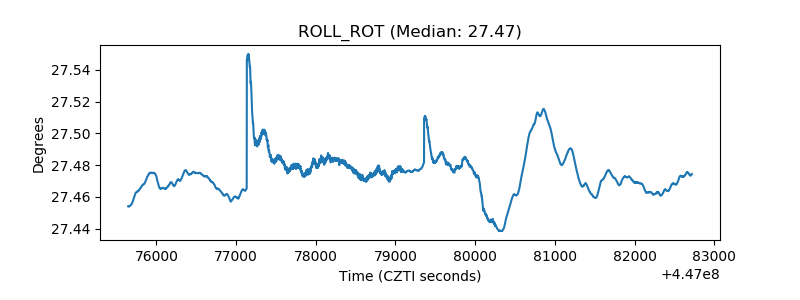 |
| _Roll_DEC | 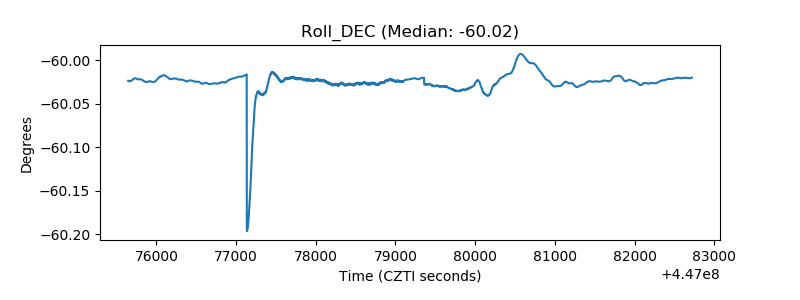 |
| _Roll_RA | 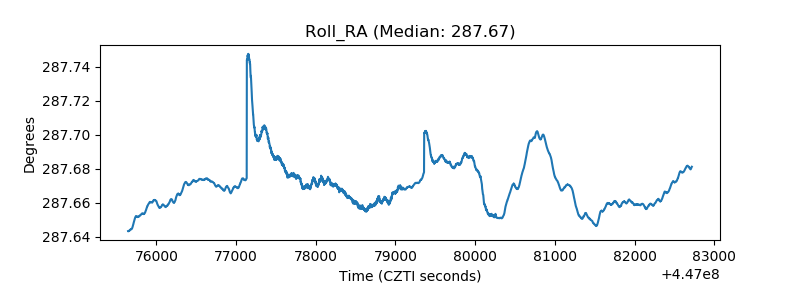 |
| Veto Counter | 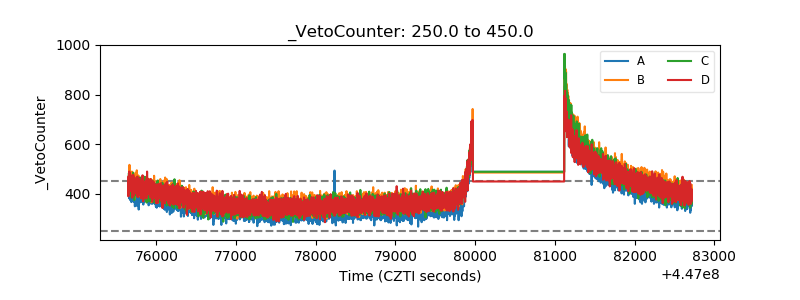 |