| Param | Original file | Final file |
|---|---|---|
| Filename | modeM0/AS1A13_071T04_9000006110_45575cztM0_level2.fits | modeM0/AS1A13_071T04_9000006110_45575cztM0_level2_quad_clean.evt |
| Size (bytes) | 527,163,840 | 104,097,600 |
| Size | 502.7 MB | 99.3 MB |
| Events in quadrant A | 5,424,826 | 732,621 |
| Events in quadrant B | 4,126,153 | 726,301 |
| Events in quadrant C | 3,549,177 | 702,419 |
| Events in quadrant D | 5,941,959 | 566,632 |
| Mode M9 | |||
|---|---|---|---|
| Quadrant | BADHDUFLAG | Total packets | Discarded packets |
| A | 0 | 13 | 0 |
| B | 0 | 13 | 0 |
| C | 0 | 13 | 0 |
| D | 0 | 13 | 0 |
| Mode M0 | |||
|---|---|---|---|
| Quadrant | BADHDUFLAG | Total packets | Discarded packets |
| A | 0 | 19827 | 1 |
| B | 0 | 16070 | 1 |
| C | 0 | 14713 | 7 |
| D | 0 | 21907 | 1 |
| Mode SS | |||
|---|---|---|---|
| Quadrant | BADHDUFLAG | Total packets | Discarded packets |
| A | 0 | 122 | 0 |
| B | 0 | 122 | 0 |
| C | 0 | 122 | 0 |
| D | 0 | 122 | 0 |
| Quadrant | Total seconds | Saturated seconds | Saturation percentage |
|---|---|---|---|
| A | 6080 | 161 | 2.648026% |
| B | 6081 | 392 | 6.446308% |
| C | 6078 | 221 | 3.636064% |
| D | 6081 | 1075 | 17.678013% |
Noise dominated data is calculated using 1-second bins in cleaned event files. If a bin has >2000 counts, and if more than 50% of those come from <1% of pixels, then it is considered to be noise-dominated and hence unusable.
| Quadrant | # 1 sec bins | Bins with >0 counts | Bins with >2000 counts | High rate bins dominated by noise | Noise dominated (total time) | Noise dominated (detector-on time) | Marked lightcurve |
|---|---|---|---|---|---|---|---|
| A | 7295 | 6081 | 13 | 13 | 0.18% | 0.21% | 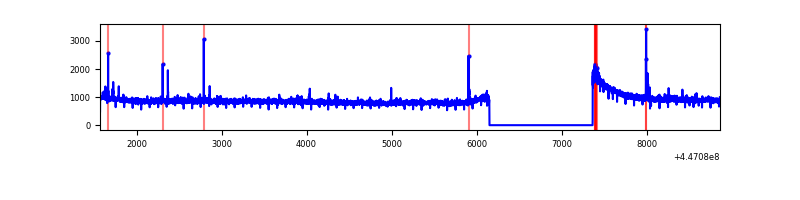 |
| B | 7296 | 6082 | 254 | 254 | 3.48% | 4.18% | 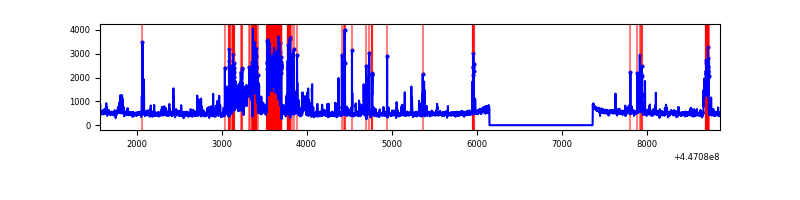 |
| C | 7296 | 6080 | 135 | 135 | 1.85% | 2.22% | 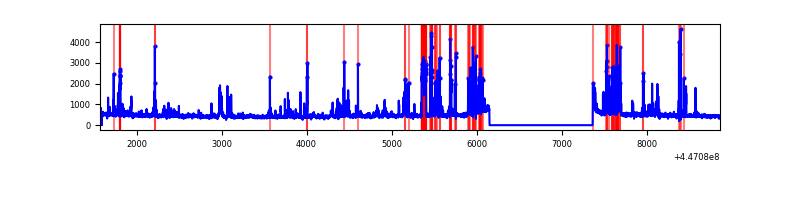 |
| D | 7296 | 6082 | 417 | 417 | 5.72% | 6.86% | 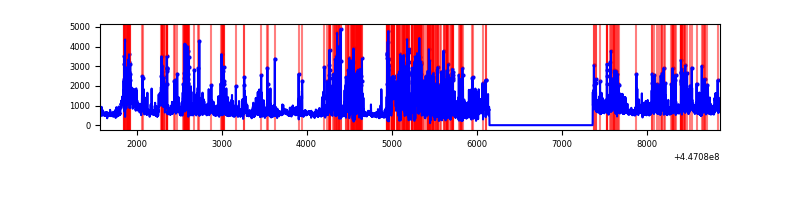 |
Top three noisy pixels from each quadrant. If the there are fewer than three noisy pixels in the level2.evt file, extra rows are filled as -1
| Pixel properties | Quadrant properties | ||||||
|---|---|---|---|---|---|---|---|
| Quadrant | DetID | PixID | Counts | Sigma | Mean | Median | Sigma |
| A | 10 | 83 | 2546174 | 17378.34 | 720 | 706 | 146.5 |
| A | 10 | 248 | 41169 | 276.25 | 720 | 706 | 146.5 |
| A | 0 | 243 | 20040 | 132.0 | 720 | 706 | 146.5 |
| B | 4 | 171 | 1019956 | 7531.37 | 700 | 681 | 135.3 |
| B | 5 | 172 | 128012 | 940.84 | 700 | 681 | 135.3 |
| B | 15 | 201 | 92842 | 680.97 | 700 | 681 | 135.3 |
| C | 14 | 254 | 440008 | 2760.56 | 689 | 693 | 159.1 |
| C | 12 | 2 | 412417 | 2587.18 | 689 | 693 | 159.1 |
| C | 8 | 222 | 6762 | 38.14 | 689 | 693 | 159.1 |
| D | 1 | 52 | 2307370 | 14525.35 | 631 | 611 | 158.8 |
| D | 11 | 241 | 403229 | 2535.23 | 631 | 611 | 158.8 |
| D | 11 | 224 | 355511 | 2234.76 | 631 | 611 | 158.8 |
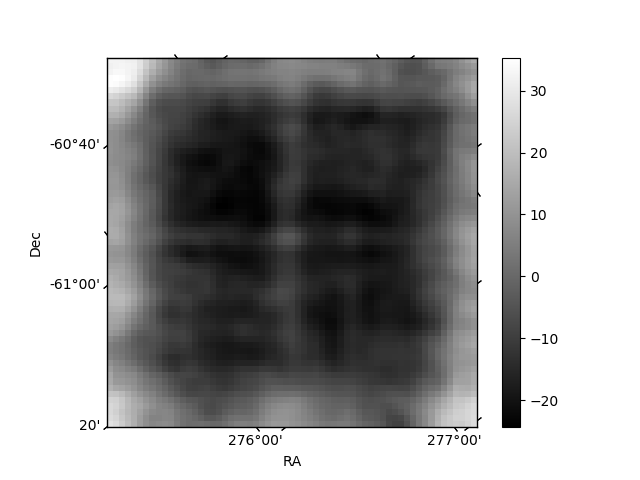
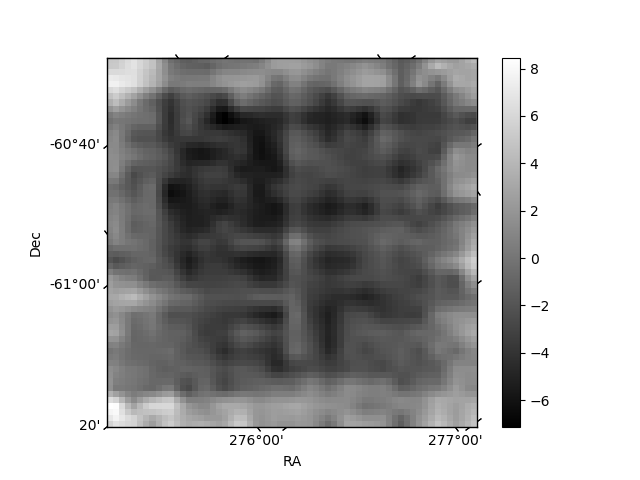
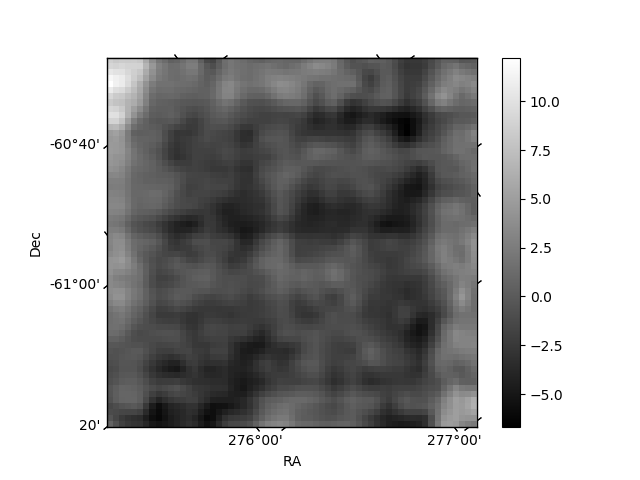
Histogram calculated using DETX and DETY for each event in the final _common_clean file
| Quadrant A | 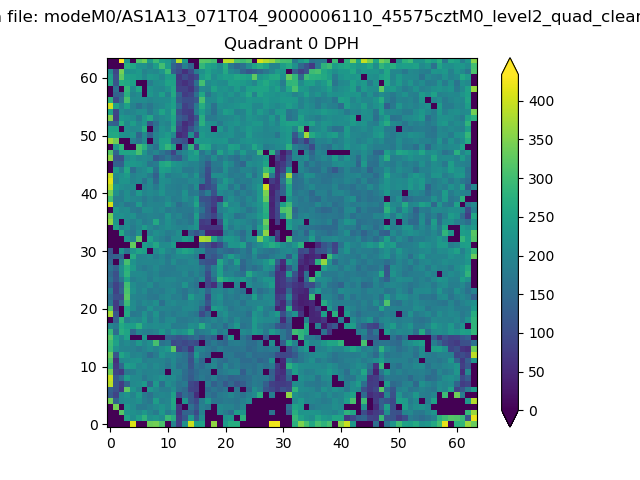 |
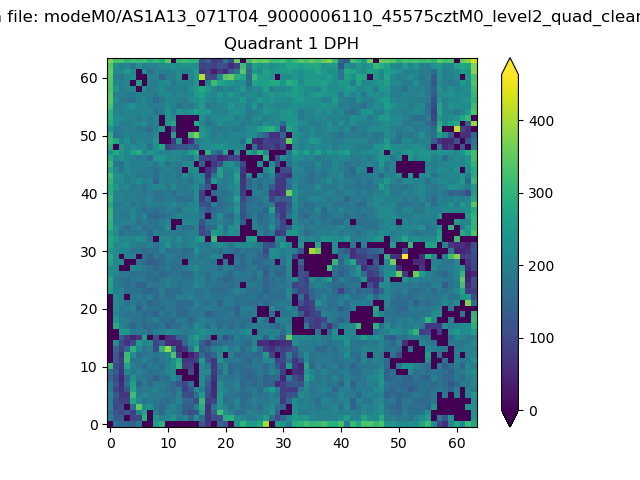 |
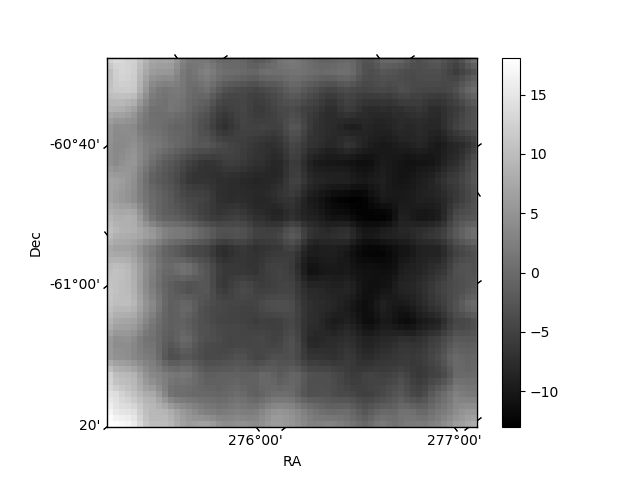
Quadrant B |
|---|---|---|---|
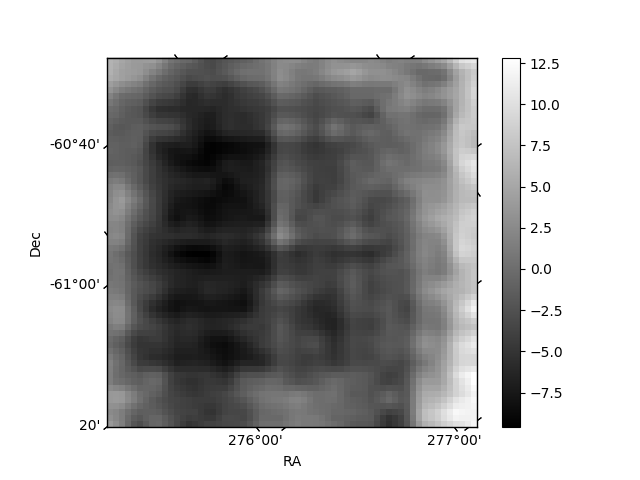
| Quadrant D | 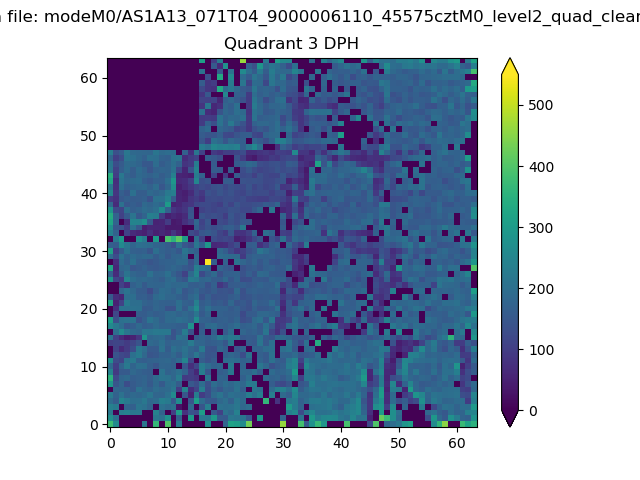 |
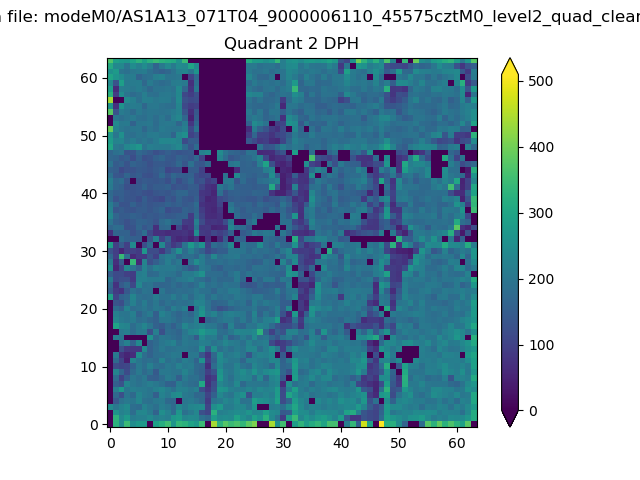 |
Quadrant C |
| Plot type | Count rate plots | Images |
|---|---|---|
| Comparison with Poisson distribution Blue bars denote a histogram of data divided into 1 sec bins. Red curve is a Poisson curve with rate = median count rate of data. |
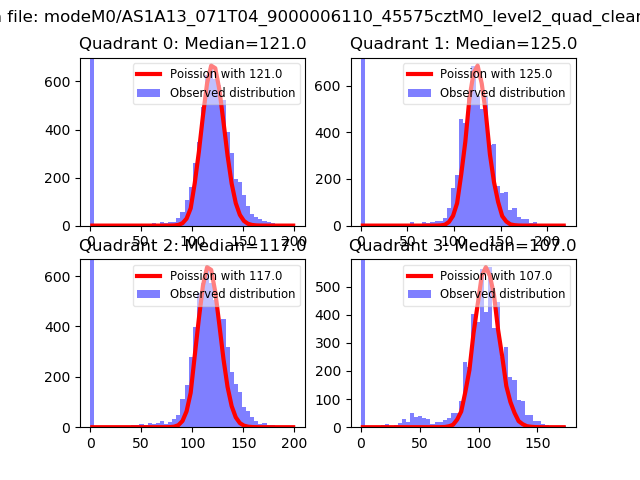 |
 |
| Quadrant-wise count rates Data is divided into 100 sec bins |
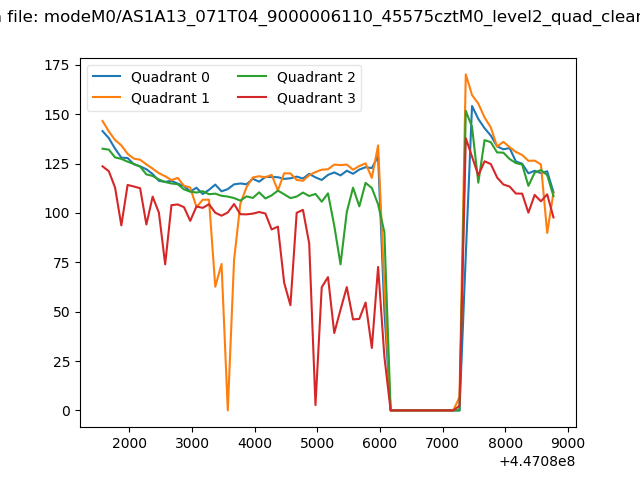 |
|
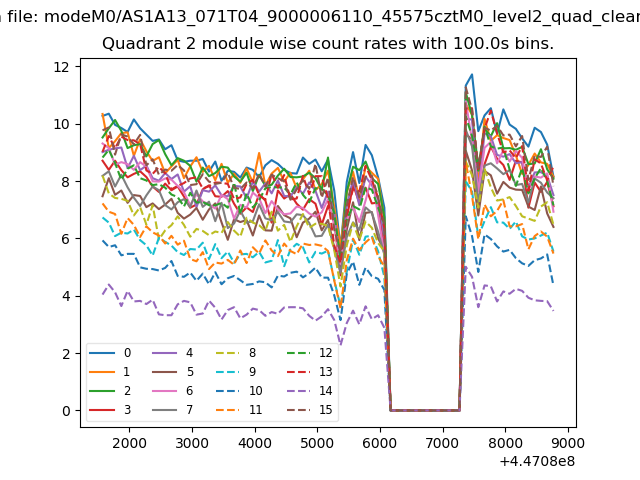
| Module-wise count rates for Quadrant A Data is divided into 100 sec bins |
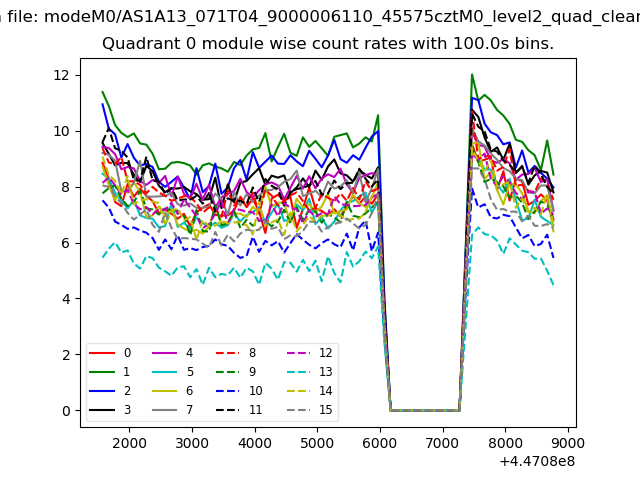 |
 |
| Module-wise count rates for Quadrant B Data is divided into 100 sec bins |
 |
 |
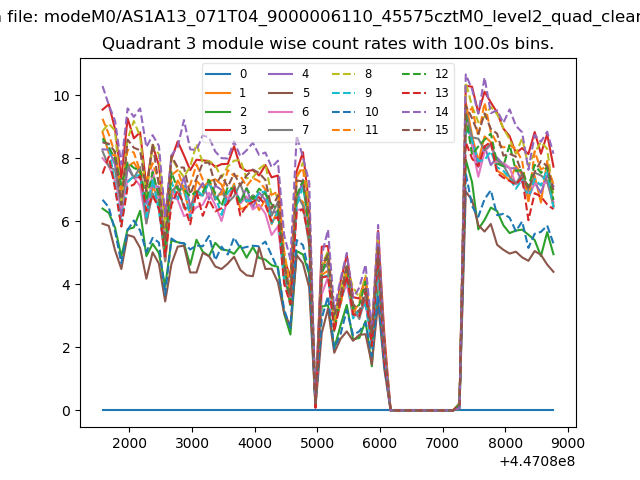
| Module-wise count rates for Quadrant C Data is divided into 100 sec bins |
 |
 |
| Module-wise count rates for Quadrant D Data is divided into 100 sec bins |
 |
 |
| Parameter | Plot |
|---|---|
| CZT HV Monitor | 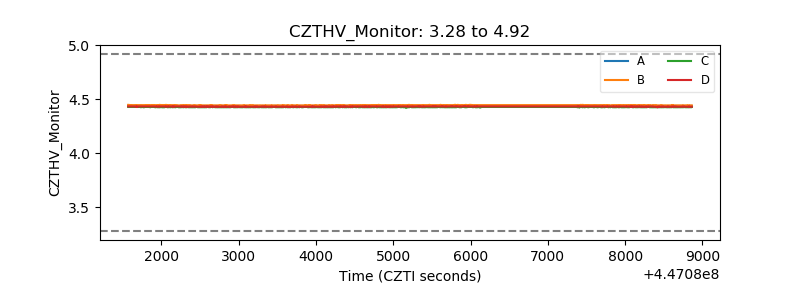 |
| D_VDD | 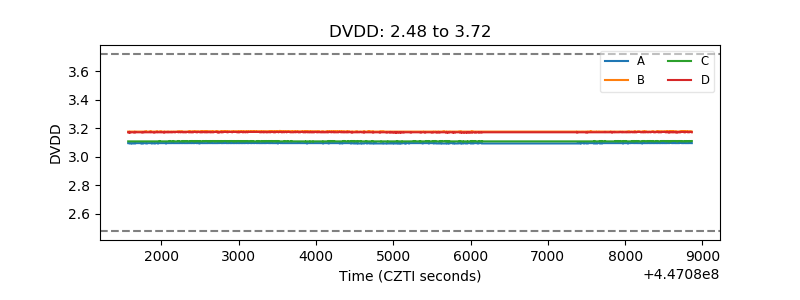 |
| Temperature 1 | 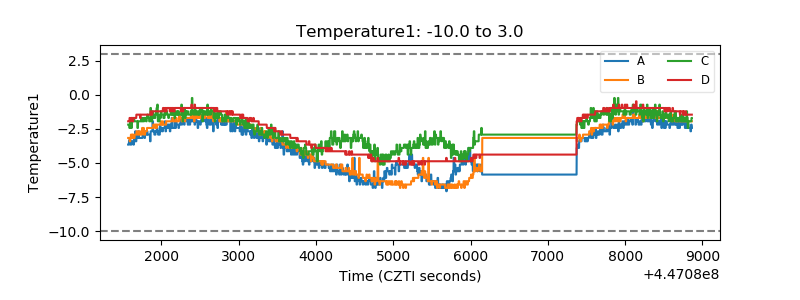 |
| Veto HV Monitor | 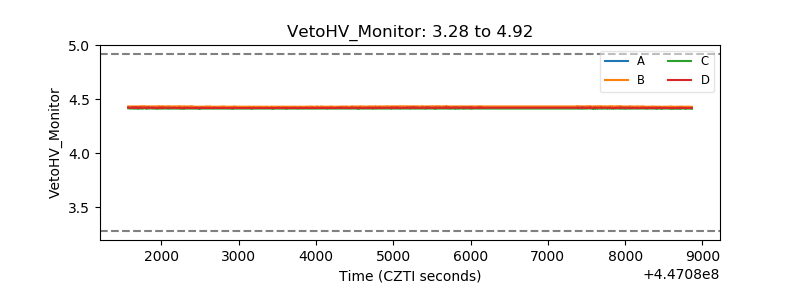 |
| Veto LLD | 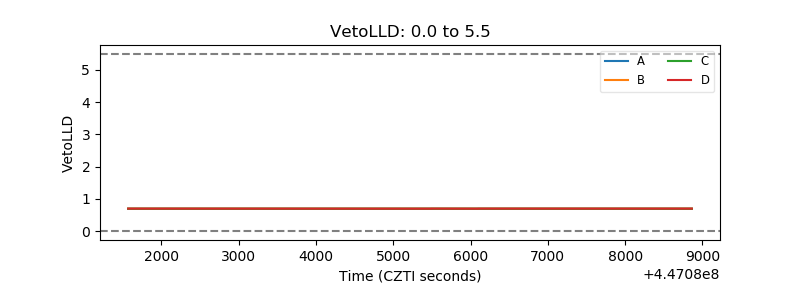 |
| Alpha Counter | 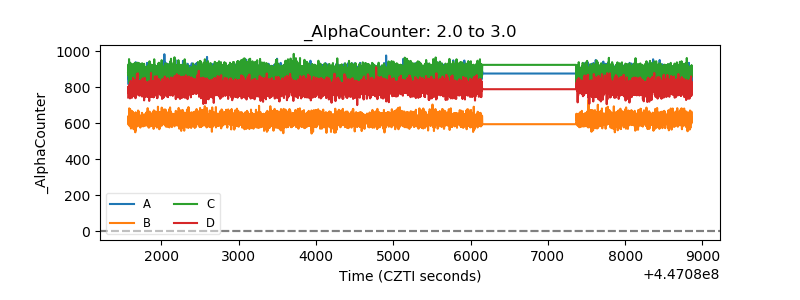 |
| _CPM_Rate | 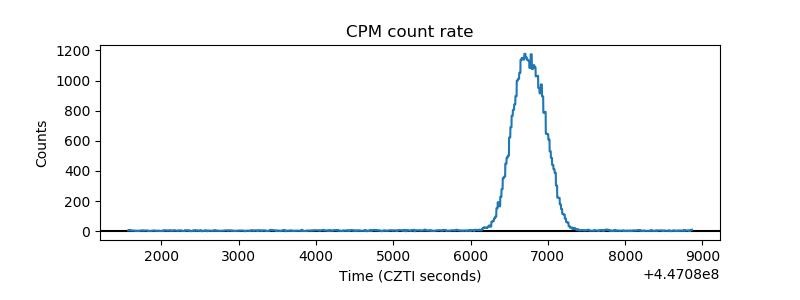 |
| CZT Counter | 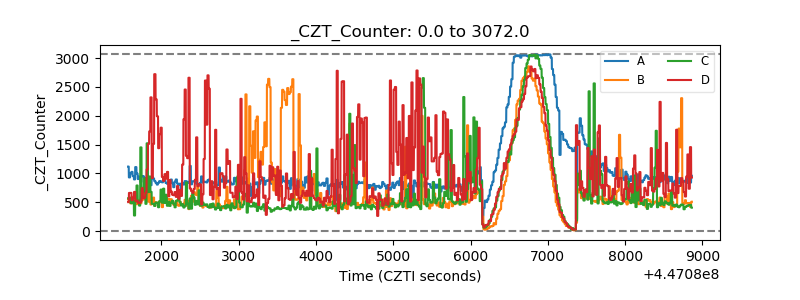 |
| +2.5 Volts monitor | 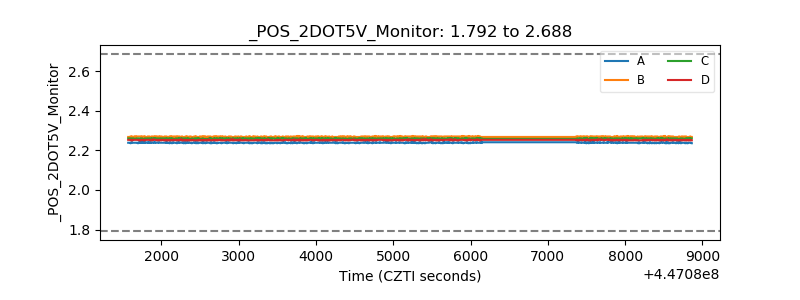 |
| +5 Volts monitor | 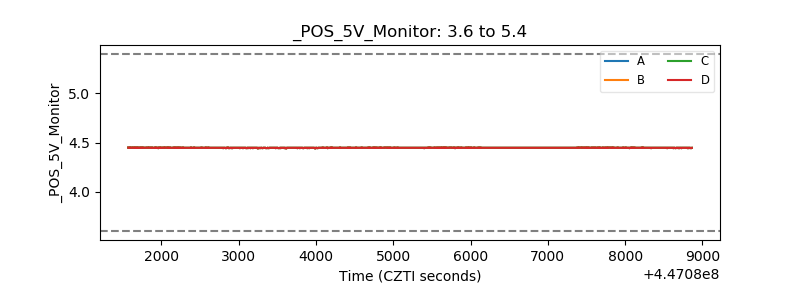 |
| _ROLL_ROT | 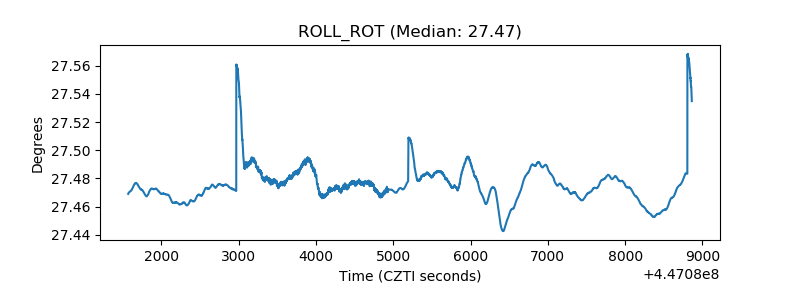 |
| _Roll_DEC | 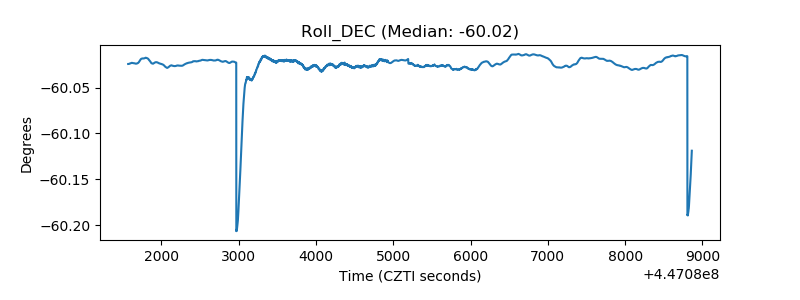 |
| _Roll_RA | 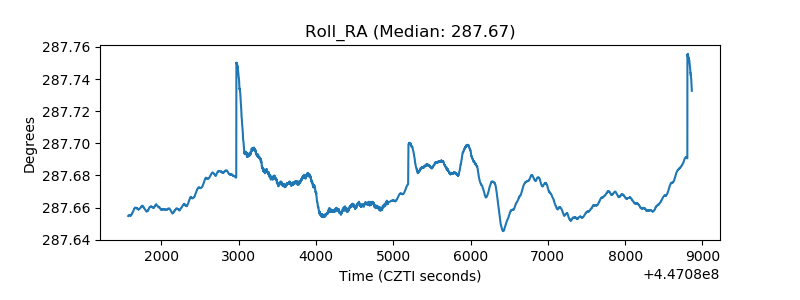 |
| Veto Counter | 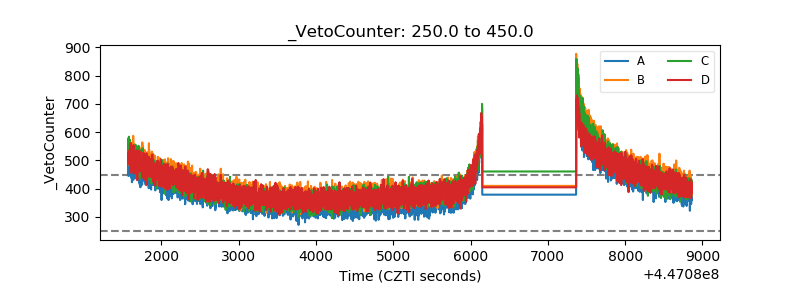 |